HAL Id: cea-02439445
https://hal-cea.archives-ouvertes.fr/cea-02439445
Submitted on 26 Feb 2020
HAL is a multi-disciplinary open access
archive for the deposit and dissemination of
sci-entific research documents, whether they are
pub-lished or not. The documents may come from
teaching and research institutions in France or
abroad, or from public or private research centers.
L’archive ouverte pluridisciplinaire HAL, est
destinée au dépôt et à la diffusion de documents
scientifiques de niveau recherche, publiés ou non,
émanant des établissements d’enseignement et de
recherche français ou étrangers, des laboratoires
publics ou privés.
Comparisons between a priori Uncertainty
Quantification and Calculation/Measurement
Discrepancies Applied to the MERCI UO_2 Fuel Rod
Decay Heat Experiment
S. Lahaye, T-D. Huynh, A. Tsilanizara, J-C. Jaboulay, S. Bourganel
To cite this version:
S. Lahaye, T-D. Huynh, A. Tsilanizara, J-C. Jaboulay, S. Bourganel. Comparisons between a priori
Uncertainty Quantification and Calculation/Measurement Discrepancies Applied to the MERCI UO_2
Fuel Rod Decay Heat Experiment. ANS Winter Meeting 2016 - ANS Winter Meeting and Nuclear
Technology Expo, Nov 2016, Las Vegas, United States. �cea-02439445�
Comparisons between a priori Uncertainty Quantification and Calculation/Measurement Discrepancies Applied to the
MERCI UO2Fuel Rod Decay Heat Experiment.
S. Lahaye∗, T.D. Huynh∗, A. Tsilanizara∗, J.C. Jaboulay∗, S. Bourganel∗
∗CEA/DEN/DANS/DM2S/SERMA, F-91191 Gif sur Yvette Cedex, France
sebastien.lahaye@cea.fr INTRODUCTION
In 2008, an UO2 fuel rod was irradiated up to
∼ 3.5GWd/tHLin the CEA/Saclay research reactor OSIRIS [1] through the MERCI experiment [2]. Some rod’s pellets were analysed. Experimental results were obtained:
• fuel rod decay heat measurement by calorimetry (cooling times from 27 minutes to 42 days),
• evaluation of the amounts of some nuclei (U, Pu, C s, Nd...) by isotopic dilution mass spectrometry,
• nuclide activities.
Comparison of type (C − M)/M where C is the calculated decay heat and M the experimentally measured decay heat was reported in reference [3]. Neutronics flux was computed by CEA TRIPOLI-4 Monte-Carlo or APOLLO2 deterministic transport code system [4, 5]. Irradiation and cooling phases were simulated with CEA DARWIN/PEPIN2 [6] code system. Good agreements were globally shown between numerical simulation results and experimental measurements on total decay heat. Uncertainty propagation in this previous work [3] was established from Rebah’s studies [7].
These last years, within the framework of supports to its industrial partners EDF and Areva, the CEA/DEN has imple-mented two different approaches to propagate nuclear data uncertainties to depletion code outputs. A direct forward de-terministic perturbation method using sensitivity profiles was implemented in the French industrial depletion code system
DARWIN/PEPIN2 [6]. Meanwhile, a propagation based on
Monte Carlo correlated sampling [8] was achieved using the CEA uncertainty platform URANIE [9] and the new genera-tion deplegenera-tion code MENDEL [10].
Both methods will be described in this article.
Uncertainties on nuclear data (independent fission yields, multigroup microscopic cross sections, radioactive decay constants, radioactive decay branching ratio and radioactive decay energies) are propagated to decay heat and isotopic concentrations.
To match MERCI first study [3], flux computation is realized by APOLLO2. Furthermore, uncertainty quantifi-cation (UQ) is re-evaluated by both DARWIN/PEPIN2 and MENDEL codes. It is an important stage in the process of val-idating both depletion codes with their respective data library. UNCERTAINTIES ON NUCLEAR DATA
Experimental results are given with a discrepancy, which is assimilated to the standard deviation of the random variable associated to the measurement value.
Uncertainty quantification on numerical simulations aims to compute the standard deviation of the outputs due to the uncertainties on the input data. In this paper, we consider only uncertainties due to nuclear data. Other potential sources of uncertainties are considered perfectly known (geometry, technological data...). Nuclear data without uncertainty data in the evaluation files are associated to a zero standard deviation (no uncertainty).
In the present work, DARWIN/PEPIN2 and MENDEL
use uncertainty data from JEFF-3.1.1 [11] for independent fission yields, radioactive decay constants, radioactive decay branching ratios and radioactive decay energies. Table I shows the quantity of uncertain parameters taken from JEFF-3.1.1. TABLE I. Number of physical parameters with non-zero un-certainty value in JEFF-3.1.1 evaluation.
evaluation JEFF-3.1.1
Independent fission yields 33668
Radioactive decay constant 3204
Radioactive branching ratios 505
Radioactive decay energies 1554
No correlations are considered between different physical quantities. Radioactive decay periods and radioactive decay energies are two by two independent. Radioactive decay branching ratios are correlated in such a way that the sum of branching ways is equal to 1 (correlation matrix).
For independent fission yields, MENDEL and
DARWIN/PEPIN2 can choose different models: no
correlation between yields, normalization (sum of yields equal to a constant for each fissile systems) or correlations taking into account the mass yields constraints [12].
Uncertainties for microscopic multigroup cross sections are taken from the COMAC data base [13]. COMAC matrices describe correlations between partial cross sections for one given isotope, and between groups for one given cross section. Data between two distinct nuclei are not correlated. Multi-group data are directly taken into account in URANIE sam-pling, and multigroup samples are used in MENDEL, while one-group variance and correlations on monocinetic reaction rates are calculated to be used by DARWIN/PEPIN2. It has been shown through inter-comparisons that the effect of the multigroup mesh rather than one group data is of second order. UNCERTAINTY PROPAGATION METHODS
We describe briefly the propagation methods and hypotheses in this section. Further details will be given in full presentation.
Deterministic Method Used in DARWIN/PEPIN2
DARWIN/PEPIN2 propagates uncertainties from nuclear data to decay heat or isotopic concentrations using a direct forward first order perturbation method. With X the uncertain input variables and Y the uncertain outputs, we can use the following formula:
cov(Y)= SY/Xcov(X)STY/X (1)
where cov(X) (resp. cov(Y)) stands for the
variance-covariance matrix for variable X (resp. Y) and SY/Xstands for the sensitivity matrix of Y regarding X.
The use of a direct forward first order perturbation method implies the hypothesis of linearity of the outputs (as a function of uncertain nuclear data). For small perturbations of the uncertain input parameters (limited to one standard deviation), this approximation is proved to be valid when comparing with propagation approaches not taking this linearity hypothesis, such as stochastic uncertainty propagation approach used in MENDEL.
The uncertainty propagation in DARWIN/PEPIN2 needs the same number of depletion calculations as the number of uncertain parameters for the calculation of sensitivity
coefficients. This is performed in parallel mode by
DARWIN/PEPIN2 through its INCERD module, which
establish the sensitivity matrix before computing the interest output covariance through equation (1).
Stochastic Method Used in MENDEL
MENDEL propagates uncertainty using a correlated sample method. All realizations are generated with URANIE. For this study, 2000 realizations generated by LHS sampling method were propagated. Most random variables are supposed to be Gaussian if the relative standard deviation is lower than 50% and are supposed to be Log-Normal in the other cases. Fission yields are always considered log-normal. Correlations are taken into account when available, through the use of importance sampling in URANIE.
The sampling method and hypotheses will be described in the full presentation.
DECAY HEAT UNCERTAINTY QUANTIFICATION We compare numerical calculation discrepancy to decay heat measurements and uncertainty propagation results (like-lihood) in Figs 1 and 2. The red plain lines show theC − M
M relative discrepancy between mesurement (M) and calcula-tions (C). For those computed values, uncertainty on nuclear data has not been taken into account. Grey domain marks an uncertainty zone of 2 standard deviation around the reference value (zero). Note that the decay heat measurement uncer-tainty is given to ±1% and is included to the grey domain definition.
This grey domain corresponds to a 97.7% likelihood if decay heat is considered to be Gaussian.
Both graphs are similar, and prove a rather good agree-ment between experiagree-mental data and computation. Indeed, for all considered cooling times (from 27 min to 42 days), the two
standard deviation domain obtained by uncertainty quantifica-tion covers the decay heat discrepancy between experimental data and calculation results.
time (s) 4 10 5 10 6 10 discrepancy (%) -10 -5 0 5 10 (C-M)/M
C from DARWIN calculation
Fig. 1. In red, decay heat discrepancy between experiment data and DARWIN. In grey, the 2 standard deviation from deterministic method used in DARWIN/PEPIN2 domain.
time (s) 4 10 5 10 6 10 discrepancy (%) -10 -5 0 5 10 (C-M)/M
C from MENDEL calculation
Fig. 2. In red, decay heat discrepancy between experiment data and MENDEL. In grey, the 2 standard deviation domain from stochastic method used in MENDEL.
time (s)
4
10 5
10 6
10
relative standard deviation (%)
0 1 2 3 4 5 YELXsBr Y E L Xs Br
Fig. 3. Contributions of each type of nuclear data to total decay heat. Main contributors are fission yields uncertainties.
Contributions by type of nuclear data are shown in Fig. 3. The main contributor to decay heat uncertainty among nuclear data are the uncertainties due to independent fission yields (in red). We considered here for both codes that fission yields are normalized so that the sum for one fissile system is constant. We do not take here in consideration the correlations resulting from mass yields constraints [12]. For this small bur-nup, other contributors are negligible, especially radioactive decay branching ratios and radioactive decay periods.
Full presentation will analyze more precisely uncertainty quantification and sensitivity analysis, in particular the effects of correlation hypotheses on fission yields.
ISOTOPIC DENSITY UNCERTAINTY QUANTIFICA-TION
Experimental ratios of concentrations were measured for both heavy nuclides (U, Pu) and fission products (Cs, Nd). Those values, associated to experimental measurement error bars, enable to verify the actual burnup of the fuel rod, in particular when considering Neodymium isotopes.
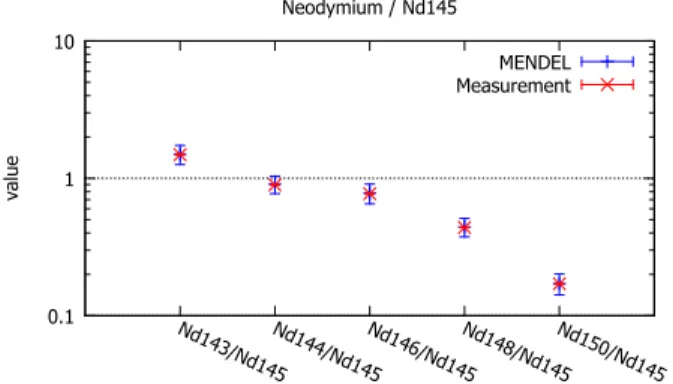
We show in graph 4 experimental values and MENDEL uncertainty quantification propagation values for Neodymium ratios. DARWIN/PEPIN2 uncertainty propagation results are coherent with MENDEL ones for all isotopes.
0.1 1 10 Nd143/Nd145Nd144/Nd145Nd146/Nd145Nd148/Nd145Nd150/Nd145 value Neodymium / Nd145 MENDEL Measurement
Fig. 4. MERCI experimental data and MENDEL uncertainty quantification for Neodymium isotopes.
Error bars correspond to one standard deviation. We observe a good agreement for all ratios, all experimental error bars being fully included in MENDEL uncertainty quantifica-tion standard deviaquantifica-tion.
For Plutonium, only Pu242/Pu239 experimental value is outside the one standard deviation of calculation results, due to the very low amount of Pu242, leading to a bad evaluation of the quantities during the isotopic dilution mass spectrometry. For Cesium and Uranium isotopes MERCI experimental results are inside the one standard deviation of calculation results, as will be shown in full presentation.
CONCLUSION
Comparisons between codes and experimental measure-ment give globally good agreemeasure-ment.
Other isotopic concentration uncertainty propagation
re-sults and analysis of correlation hypotheses consequences on decay heat uncertainty will be given in the full presentation.
This work is a new contribution for the validation of both
MENDEL and DARWIN/PEPIN2 codes for isotopic
concen-tration and decay heat computations, as well as both deter-ministic and probabilistic methods to propagate nuclear data uncertainty to those quantities.
ACKNOWLEDGMENTS
The authors thank EDF and AREVA for their financial support to the developments of DARWIN/PEPIN2 and MENDEL code systems.
REFERENCES
1. S. LOUBIÈRE ET AL., “OSIRIS Reactor for Fuel, Ma-terial and Other Irradiation,” in “12th Int. Group on Re-search Reactor, Beijing, China,” (October 28-30 2009). 2. C. BLANDIN ET AL., “MERCI-MOSAIC: Experimental
Tools for Residual Power Measurement in OSIRIS Reac-tor,” in “12th Int. Group on Research ReacReac-tor,” (2009). 3. J. C. JABOULAY and S. BOURGANEL, “Analysis of
MERCI Decay Heat Measurement for PWR UO2 Fuel
Rod,” Nuclear Techonology, 177, 73–82 (January 2012). 4. E. BRUN ET AL., “Systematic Uncertainty Due to
Statis-tics in Monte Carlo Burnup Codes: Application to a Sim-ple Benchmark with TRIPOLI-4-D,” Prog. in Nucl. Sci. and Technol., 2, 879 – 885 (2011).
5. R. SANCHEZ ET AL., “APOLLO2 year 2010,” Nuclear Engineering and Technology, 42, 5, 474–499 (2010). 6. A. TSILANIZARA ET AL., “DARWIN: an Evolution
Code System for a Large Range of Applications,” Nucl. Science Technol. Suppl., 1, 845 – 849 (2000).
7. J. REBAH, Uncertainty on Decay Heat Power Due to Fission Product Data Uncertainty, Ph.D. thesis, CEA-N-2387 PhD thesis (1998).
8. A. TSILANIZARA ET AL., “Probabilistic approach for decay heat uncertainty estimation under URANIE plat-form by using MENDEL depletion code,” Annals of Nu-clear Energy, 90, 62–70 (2016).
9. F. GAUDIER, “URANIE: the CEA/DEN Uncertainty and Sensitivity platform,” Proc. - Social and Behavioral Sci-ences, 2, 16, 7660–7661 (2010).
10. S. LAHAYE ET AL., “First Verification and Validation Steps of MENDEL Release V1.0 Cycle Code System,” in “PHYSOR 2014,” (2014), Kyoto, Japan.
11. M. KELLET, O. BERSILLON, and R. MILLS, The JEFF-3.1/-3.1.1 Radioactive Decay Data and Fission Yields Sub-libraries, OECD (2009).
12. T. R. ENGLAND and B. F. RIDER, “ENDF-349, Eval-uation and Compilation of Fission Product Yields 1993,” Tech. Rep. LA-UR-94-3106 (1994).
13. C. DE SAINT-JEAN ET AL., “Estimation of Multi-Group Cross-Sections Covariances for235,238U, 239Pu, 241Am, 56Fe,23Na and27Al,” in “PHYSOR 2012,” (2012).