HAL Id: tel-03168270
https://tel.archives-ouvertes.fr/tel-03168270
Submitted on 12 Mar 2021HAL is a multi-disciplinary open access
archive for the deposit and dissemination of sci-entific research documents, whether they are pub-lished or not. The documents may come from teaching and research institutions in France or abroad, or from public or private research centers.
L’archive ouverte pluridisciplinaire HAL, est destinée au dépôt et à la diffusion de documents scientifiques de niveau recherche, publiés ou non, émanant des établissements d’enseignement et de recherche français ou étrangers, des laboratoires publics ou privés.
and future challenges
Mélina Hillion
To cite this version:
Mélina Hillion. Teacher recruitment and management : current practices and future challenges. Eco-nomics and Finance. Université Paris sciences et lettres, 2018. English. �NNT : 2018PSLEH118�. �tel-03168270�
de l’Université de recherche Paris Sciences et Lettres
PSL Research University
Préparée à l’Ecole des hautes études en sciences soci
ales
Teacher Recruitment And Management:
Current Practices And Future Challenges
COMPOSITION DU JURY :
Mme. MEURS Dominique
Université Paris Ouest – Nanterre La Défense,
Rapporteur
Mme. BACACHE Maya
Télécom Paris Tech, Rapporteur
M. GURGAND Marc
Ecole d’Economie de Paris, CNRS, Membre du jury
Mme. BEJEAN Sophie
Université de Bourgogne, Membre du jury
M. BRYSON Alex
University College London, Membre du jury
Soutenue par
Mélina
HILLION
Le 15 novembre 2018
h
Ecole doctorale
n°
465ECOLE DOCTORALE ECONOMIE PANTHEON SORBONNE
Spécialité
ANALYSE ET POLITIQUE ECONOMIQUES
Dirigée par Philippe ASKENAZY
hRemerciements
Tout d’abord, je tiens à remercier mon directeur de thèse, Philippe Askenazy, de m’avoir fait confiance dès le début en acceptant de diriger mes recherches, de m’avoir fait bénéficier de ses conseils et de ses brillantes idées, et de m’avoir encouragée et soutenue tout au long de cette aventure. Je le remercie également pour sa disponibilité et pour avoir rendu possible mon séjour à l’Université de Berkeley.
Je remercie Dominique Meurs et Maya Bacache pour leurs nombreux commentaires très constructifs, qui m’ont permis d’améliorer considérablement mon travail. Je leur suis également reconnaissante d’avoir accepté d’être rapporteurs de cette thèse. J’ai également fortement bénéficié des conseils de Marc Gurgand que je remercie d’avoir accepté d’être membre du jury.
I would like to thank Alex Bryson for welcoming me so warmly to the Quantitative Social Science seminar at UCL and for agreeing to be a member of the jury. Je suis très reconnaissante à Sophie Béjean d’avoir également accepté d’être membre du jury.
Je souhaite remercier les personnes qui m’ont accueillie à la DEPP et sans le con-cours desquelles cette thèse n’aurait pas eu sa forme actuelle. Je suis particulièrement reconnaissante à Fabienne Rosenwald, Xavier Sorbes, Cédric Afsa, Pierette Briant et Julie Solard qui m’ont ouvert les portes de la DEPP et m’ont permis de travailler sur les données du ministère de l’éducation. Je les remercie pour leur confiance et leur bienveil-lance à chaque étape de mes travaux. Je remercie également Caroline Simonis-Sueur pour son aide précieuse et Olivier Monso pour sa très grande disponibilité. Je dois également beaucoup à Catherine Valette, Edouard Maugendre, Marion Defresne et Yves Dubois qui ont eu la patience de répondre à mes nombreuses sollicitations. Je remercie Daniel Auverlot et Philippe Claus d’avoir pris le temps de me recevoir et de répondre à toutes mes questions.
J’ai eu la chance de passer deux années exceptionnelles au CREST. Les nombreux échanges avec les doctorants et les chercheurs ont été une source constante d’inspiration, de réflexion et d’amélioration. Je tiens en particulier à remercier Francis Kramarz et Xavier d’Haultefoeille qui m’ont accueillie au laboratoire de micro-économétrie du CREST et m’ont fait bénéficier de leurs conseils précieux. Je remercie également l’ensemble des chercheurs du CREST pour leur disponibilité, et tout particulièrement Thomas le Barbanchon, Christian Belzil, Pierre Cahuc, Bruno Crépon, Laurent Davezies, Bertrand Garbinti, Robert Gary-Bobo, Alessandro Iaria, Anett John, Vincent Pons, Anna Simoni et Arne Uhlendorff pour m’avoir apporté leur aide à différents moments de ma thèse. J’ai eu la joie de partager le bureau d’Alicia Marguerie, Arnaud Philippe et Daphné Skandalis qui m’ont énormément apporté et avec qui j’ai passé des moments inoubliables. Je re-mercie également Simon Georges-Kot, Ivan Ouss et Pierre Pora pour leur soutien et leur amitié. Je suis également particulièrement reconnaissante à Aicha Ben Dhia, Antoine Bertheau, Marianne Blehaut, Edouard Chrestien, Jeanne Commault, Emma Duchini, Sandro Favre, Manon Garrouste, Mathilde Godard, Malka Guillot, Yannick Guyonvarch, Clémence Lenoir, Jeremy L’Hour, Victor Lyonnet, Esther Mbih, Julie Pernaudet, Au-drey Rain, Pauline Rossi, Clémence Tricaud, Jérôme Trinh, Benjamin Walter et Meryam Zaiem. Je remercie le personnel administratif du CREST, et tout particulièrement Mar-tine Germond, Arnaud Richet et Murielle Jules pour leur aide précieuse.
Plusieurs personnes rencontrées à PSE ont eu un impact déterminant sur cette thèse. J’ai d’abord eu la chance de partager le bureau de Camille Terrier qui m’a fait découvrir les données du ministère de l’éducation. Son organisation et sa rigueur ont été un exemple pour moi. Ensuite, j’ai eu la chance de travailler avec Thomas Breda. J’ai considérable-ment appris au cours de notre collaboration et grâce à ses nombreux conseils lors de mon comité de thèse. Je le remercie pour son intuition et son audace qui nous ont permis de publier le premier chapitre de cette thèse.
I would like to thank Stephen Ceci for his incredible support from writing to publishing this article. His kindness, comments, availability and responsiveness were extraordinary and played a key role.
Je suis également particulièrement reconnaissante envers Thomas Piketty et Clau-dia Senik pour leurs commentaires précieux lors de mes présentations en séminaire. Je
souhaite remercier les participants de l’Applied Economics seminar et du Labour and Public Economics seminar de PSE, et tout particulièrement Asma Benhenda, Clémen-tine Van Effenterre et Fanny Landaud.
I had the opportunity to visit the IRLE and the University of Berkeley. I am extremely grateful to Jesse Rothstein for his hospitality, availability and for the time he devoted to my research projects. I would also like to thank Patrick Kline for his advice, which influenced my thesis beyond my expectations. C’est au contact de plusieurs chercheurs de l’Université de Berkeley que j’ai entamé une seconde phase de maturité de mon projet de recherche. Je remercie Emmanuel Saez et Gabriel Zucman qui m’ont aidée à prendre du recul et à me poser les bonnes questions. I also had the opportunity to meet and share excellent moments with Stephen Aebischer, Yukiko Asai, Cédric Gorinas, Maxim Massenkof, Claire Montialoux, Tobias Renkin and Michael Siegenthaler. Mon regard sur la recherche en économie n’a plus été le même après ce séjour de quelques mois en Californie.
Je souhaite également remercier Arnaud Maurel qui m’a initiée à la recherche, et Denis Fougère qui m’a encouragée et donné la possibilité d’échanger avec les participants du LIEPP de Sciences Po.
J’ai eu la chance de retrouver à la DARES un environnement de travail stimulant et bienveillant. Je remercie mes collègues pour leur soutien et leur patience, et tout par-ticulièrement Selma Amira, Marilyne Beque, Thomas Coutrot, Cécile Higounenc, Ceren Inan, Amélie Mauroux, Sarah Memmi, Corinne Mette, Maria-Teresa Pignoni, Elodie Rosankis, Aguibou Tall et Nicole Waldren.
J’aimerais remercier mon frère et mes parents, Ronan, Odile et André, qui m’ont toujours soutenue, inspirée et incitée à garder un esprit ouvert et critique.
Je remercie Anis pour sa patience, sa gentillesse, son énergie, son optimisme et sa bonne humeur à toute épreuve. Sa contribution est inestimable.
Merci à tous mes amis pour leurs encouragements et leur compréhension, en particulier lorsque ma disponibilité faisait défaut.
Résumé et mots clés
Résumé
L’organisation de la fonction publique française connait de profondes mutations depuis le début des années 2000. Cette thèse examine la capacité du système de recrutement et de gestion des enseignants à répondre aux enjeux d’attractivité, d’efficacité et de diversité au cœur des projets actuels de modernisation du système éducatif. Le premier chapitre examine la neutralité du processus de recrutement des enseignants du secondaire vis-à-vis du genre. Il révèle que des biais d’évaluation existent et tendent à favoriser le genre minoritaire, contribuant ainsi à renforcer la mixité au sein des disciplines universitaires. Les deuxième et troisième chapitres examinent la capacité des incitations monétaires, de la demande d’enseignants et des exigences en matière de diplômes à attirer davantage et potentiellement de meilleurs candidats aux postes d’enseignant. Une hausse du niveau de diplôme requis pour enseigner (réforme de la "masterisation") ne semble pas améliorer l’efficacité du recrutement en termes d’attractivité, de profils de compétences et de diver-sité. Le quatrième chapitre examine la relation entre absentéisme, mobilité et conditions de travail des enseignants. Il montre que les écoles et les directeurs d’école influencent significativement les absences, les départs et le bien-être psychologique des enseignants. Le manque de soutien hiérarchique, les comportements hostiles et l’intensité du travail semblent jouer un rôle particulièrement important.
Mots clés
Recrutement, Biais de genre, Offre d’enseignants, Exigence de diplôme, Absentéisme, Roulement du personnel, Conditions de travail
Abstract and keywords
Abstract
The organization of the French civil service has undergone profound changes since the early 2000s. This thesis examines the capacity of the teacher recruitment and manage-ment system to meet the challenges of attractiveness, efficiency and diversity at the heart of current projects to modernize the education system. The first chapter examines the gender neutrality of the recruitment process for secondary school teachers. It reveals that evaluation biases tend to favor the minority gender and contribute to strengthening the gender diversity within university disciplines. The second and third chapters examine the ability of monetary incentives, teacher demand and degree requirements to attract more and potentially better candidates for teaching positions. An increase in the level of qualification required to teach (from bachelor’s to master’s level) does not seem to improve the effectiveness of recruitment in terms of attractiveness, skills profiles and di-versity. The fourth chapter examines the relationship between absenteeism, mobility and working conditions of teachers. It shows that schools and school principals significantly influence teacher absences, turnover and psychological well-being. Lack of hierarchical support, hostile behaviors and work intensity seem to play a critical role.
Keywords
Recruitment, Gender bias, Teacher supply, Degree requirement, Absenteeism, Staff turnover, Working conditions
Contents
Remerciements i
Resumé et mots clés iv
Abstract and keywords v
Introduction 1
1 Teaching accreditation exams in France favor women in male-dominated
disciplines and men in female-dominated fields 18
1.1 Introduction . . . 18
1.2 Institutional background . . . 21
1.2.1 Competitive exams to recruit teachers in France . . . 21
1.2.2 Systematic non-anonymous oral and anonymous written tests . . 21
1.2.3 Exams at three different levels . . . 22
1.2.4 Two to three examiners at each test . . . 24
1.3 Data . . . 25
1.4 Method . . . 27
1.4.1 Percentile ranks . . . 27
1.4.2 Variations in percentile ranks between oral and written tests (DD) 28 1.4.3 Odds ratios and relative risks . . . 29
1.4.4 Using total scores on written and oral tests or keeping only one written and one oral test . . . 29
1.4.5 A simple linear model to derive econometric specifications . . . . 29
1.4.6 Statistical models used to assess the gender bias on oral tests in each field and at each level . . . 30
1.4.7 Using initial scores instead of percentile ranks . . . 32
1.4.8 Statistical model to assess how the gender bias on oral test varies from a subject to another one . . . 33
1.4.9 Statistical model to assess how the relationship between subjects’ extent of male-domination and gender bias on oral test varies be-tween the medium- and the high-level exams . . . 33
1.4.10 Clustering standard errors . . . 33
1.5 Results . . . 34
1.5.1 Gender differences between oral and written test scores at exams to recruit secondary school and postsecondary professorial teachers 34 1.5.2 A clear pattern of rebalancing gender asymmetries in academic fields, strongest at the highest-level exam, and invisible at the lower-level exam . . . 36
1.5.3 Implications for the gender composition of recruited teachers and professors in different fields . . . 37
1.5.4 Gender of evaluators . . . 37
1.5.5 Comparison of an oral test that is common across all exams . . . 38
1.6 Discussion . . . 39
1.6.1 Handwriting detection . . . 39
1.6.2 Gender differences in the types of abilities that are required on oral and written tests . . . 40
1.6.3 Results from statistical models DD, S, and S+IV at the medium-and higher-level exams . . . 42
1.6.4 Results from statistical models DD, S, and S+IV at the lower-level exams . . . 43
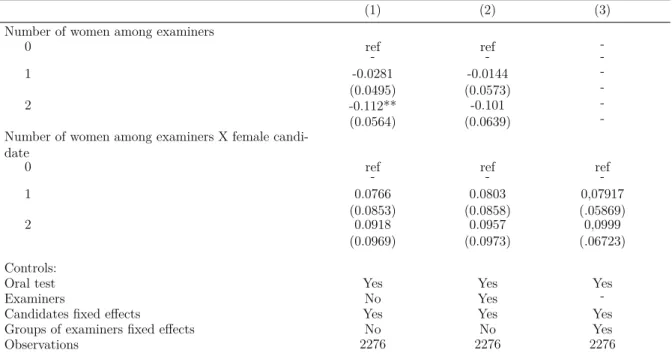
1.6.5 Analysis of the effect of the gender composition of the examiner panels . . . 44
1.7 Conclusion . . . 45
Tables . . . 49
Figures . . . 63
2 Understanding the effect of salary, degree requirements and demand on
2.1 Introduction . . . 70
2.2 Related literature . . . 72
2.3 The effect of wage. . . 76
2.3.1 A simple model . . . 76
2.3.2 Implication for teacher supply . . . 78
2.3.3 Implication for teacher skills . . . 78
2.4 The effect of labor demand . . . 80
2.4.1 Model . . . 80
2.4.2 Implication for teacher supply . . . 84
2.4.3 Implication for teacher skills . . . 86
2.5 The effect of degree requirement . . . 87
2.5.1 Educational and professional choices when teachers are required to have a bachelor’s degree . . . 87
2.5.2 Educational and professional choices when teachers are required to have a masters’ degree . . . 93
2.6 Conclusion . . . 97
Appendix . . . 102
3 How does the increase in teachers’ qualification levels affect their supply and characteristics? 106 3.1 Introduction . . . 106
3.2 How to measure teacher quality? . . . 111
3.3 Institutional background . . . 113
3.3.1 The recruitment of public primary school teachers . . . 113
3.3.2 Reform of teachers’ diploma level . . . 114
3.4 Data and descriptive statistics . . . 116
3.4.1 Teacher qualifications . . . 117
3.4.2 Teacher supply and teacher demand . . . 120
3.4.3 Teacher skills . . . 124
3.4.4 Teacher diversity . . . 126
3.4.5 Teacher salaries . . . 127
3.5 Exploratory analysis when teachers are recruited at the bachelor level (be-fore 2011) . . . 129
3.5.1 Relationship between teacher supply, teacher demand and salary . 129
3.5.2 Relationship between teacher characteristics, teacher demand and
salary . . . 131
3.5.3 Relationship between diploma level and teacher characteristics . . 134
3.6 Model . . . 135
3.7 Results . . . 137
3.7.1 Effect of a higher degree requirement on teacher supply . . . 137
3.7.2 Effect of a higher diploma requirement on teacher characteristics . 140 3.8 A placebo test . . . 146
3.9 Discussion . . . 148
3.9.1 Is there a link between the qualification reform and teacher shortages?148 3.9.2 Short-term or long-term effects? . . . 152
3.10 Conclusion . . . 152
Tables . . . 157
Figures . . . 174
Appendix . . . 188
A Primary school teacher recruitment examinations are not standardized in France . . . 188
B Scope of the analysis . . . 190
C Descriptive statistics . . . 190
D A first method for estimating scoring biases between regions . . . 192
E A second method for estimating scoring biases between regions and years 195 E.1 Descriptive evidence and preliminary analysis . . . 196
E.2 Model . . . 201
E.3 Results. . . 209
F Robustness checks. . . 214
Tables . . . 216
Figures . . . 227
4 How school context and management influence sick leave and teacher departure 233 4.1 Introduction . . . 233
4.3 Context . . . 241
4.3.1 Absences in the French education system . . . 241
4.3.2 Recruitment and wage in (secondary) education . . . 241
4.3.3 Mobility . . . 243
4.3.4 Teachers in deprived areas . . . 245
4.3.5 School principals and vice-principals . . . 245
4.4 Data and descriptive statistics . . . 246
4.4.1 Sources . . . 246 4.4.2 Descriptive statistics . . . 247 4.5 Method . . . 248 4.5.1 Specification . . . 248 4.5.2 Estimation. . . 250 4.6 Results . . . 253
4.6.1 Contribution of teachers, schools and principals to the annual du-ration of teacher absences . . . 255
4.6.2 What is the overall impact of schools and principals on teachers absences? A counterfactual analysis . . . 260
4.6.3 Relationship between the contribution of principals and schools to teacher absences and turnover . . . 263
4.6.4 Who leaves schools that contribute most to absences? . . . 265
4.6.5 Relationship between school effects and school characteristics. . . 266
4.6.6 What are the working conditions and psychosocial risks factors as-sociated with schools’ and principals’ effects on teacher absences? 268 4.6.7 What is the relationship between teacher health and school and principal effects on absenteeism?. . . 272
4.6.8 Has the increase in prevention from 2014 been more intense in schools (and among school principals) that increase teacher absences?275 4.6.9 Are newly recruited teachers assigned to more favourable work en-vironments? . . . 278
4.7 Robustness checks. . . 281
4.7.1 Exogeneous mobility assumption . . . 281
4.7.3 What is the impact of log-linearisation on estimates? . . . 292
4.7.4 Are absences partly explained by peer effects? . . . 293
4.8 Conclusion . . . 298
Tables . . . 306
Figures . . . 322
List of Figures
1 Administrative regions and academic regions (académies) in France . . . 3
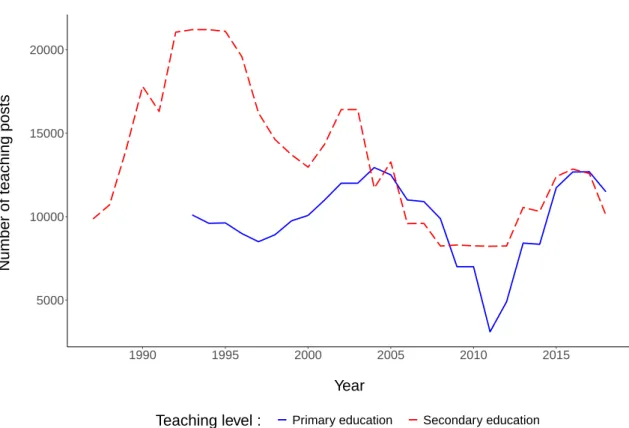
2 Number of primary and secondary teaching posts over the period 1987-2018 5
3 Average net salary (in euros per month) of university graduates according to the proportion of women among university graduates in the field. . . . 8
1.1 Average gender gap between oral and written examinations, by subject, in the recruitment of teachers at the high- and medium-level. . . 63
1.2 Average rank difference between women and men on oral and written tests in each subject-specific exam at the high- and medium-level. . . 64
1.3 Difference between women and men average rank on oral test in the subject "Behave as an ethical and responsible civil servant" in different fields of specialization. . . 65
1.4 Average rank difference between women and men on the oral test "Be-have as an Ethical and Responsible Civil Servant" according to subject feminization.. . . 66
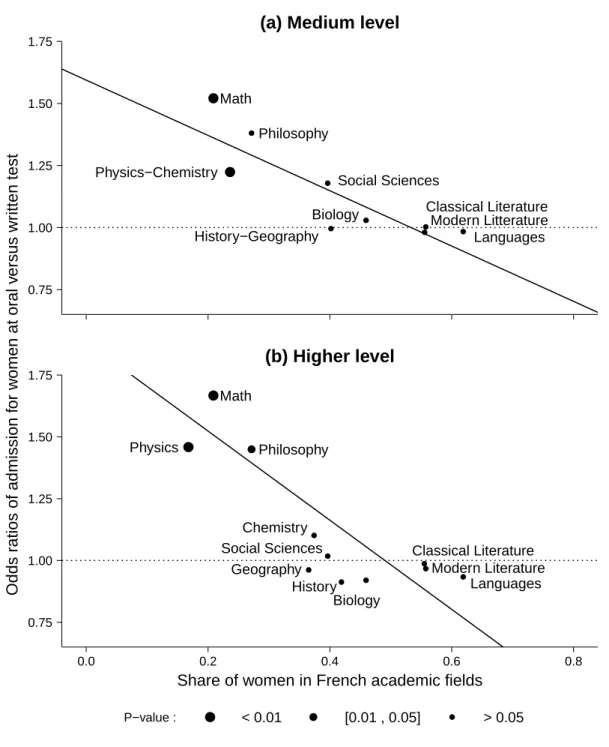
1.5 Odds ratios of admission for women candidates at non-anonymous oral tests versus anonymous written tests. . . 67
1.6 Average gender gap between oral and written examinations, by subject, for candidates taking both medium- and higher-level exams the same year. 68
1.7 Average gender gap in the recruitment of teachers at the high- and medium-level, by subject, considering only one oral and one written test. . . 69
2.1 Professional choices for individuals eligible to teaching positions . . . 77
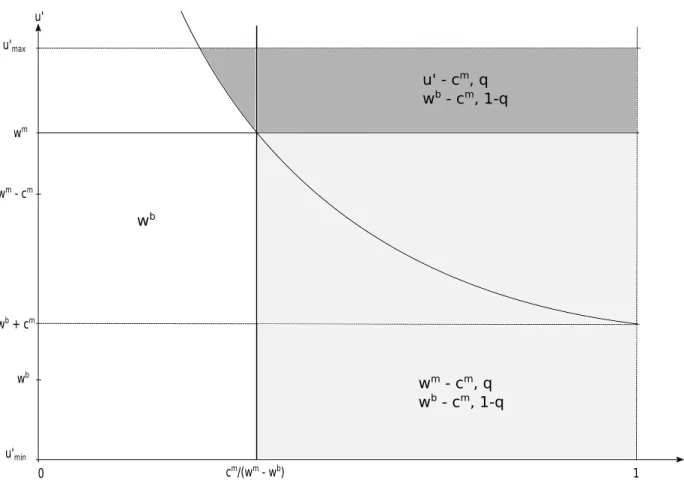
2.2 Professional choices of bachelor’s graduates when a bachelor’s degree is required to teach. . . 91
2.3 Professional choices for bachelor’s graduates when a master’s degree is required to teach. . . 95
3.1 Recruitment and tenure of public primary school teachers for the period 1989-2017 . . . 116
3.2 Number of candidates according to the number of teaching posts during the periods 1996-2009 and 2011-2015 . . . 139
3.3 Annual logarithmic variation in the number of candidates compared to 1996140
3.4 Average score of teachers (corrected for standardization errors) on the re-cruitment examination during the periods 1996-2009 and 2011-2013 . . . 143
3.5 Annual variation in the average examination score (corrected for assess-ment bias, see Appendix) of teachers compared to 2003 . . . 144
3.6 Annual variation in the average classroom observation score (2-3 years after tenure) of teachers recruited over the period 2006-2013 (compared to 2006) . . . 145
3.7 Teacher shortage and market tightness over the period 1996-2017 . . . . 151
3.8 Number of candidates according to the number of teaching posts over the period 1996-2009 . . . 174
3.9 Teacher market tightness according to the number of teaching posts over the periods 1996-2009 and 2011-2015 . . . 175
3.10 Average score of teachers (raw data) on the recruitment examination during the periods 1996-2009 and 2011-2013 . . . 176
3.11 Annual variation in the average exam score (raw data) of teachers com-pared to 2003 . . . 177
3.12 Annual variation in the average examination score (corrected for assess-ment bias, see Appendix) of candidates compared to 2003. . . 178
3.13 Annual variation in the average examination score (raw data) of candidates compared to 2003 . . . 179
3.14 Annual variation in the proportion of men among candidates compared to 2003 . . . 180
3.15 Annual variation in the proportion of men among teachers compared to 2003181
3.16 Annual variation in the median income in the city of residence of candidates compared to 2003 . . . 182
3.17 Annual variation in the median income in the city of residence of teachers compared to 2003 . . . 183
3.18 Annual logarithmic variation in the number of candidates for the Regional Institutes of Administration (IRA) compared to 2008 . . . 184
3.19 Annual variation in the share of men among candidates for the Regional Institutes of Administration (IRA) compared to 2008 . . . 185
3.20 Annual variation in the share of men among recruits for the Regional Institutes of Administration (IRA) compared to 2008 . . . 186
3.21 Evolution of the number of candidates by age group over the period 2003-2015 . . . 187
3.22 Raw and corrected exam score of teachers by academic region in 2003-2004 195
3.23 Variation in candidates’ exam score between the first and second attempts according to the quartile of the region of departure and arrival . . . 198
3.24 Evolution of the average score of candidates between the first and second participation in the competition during the period 2005-2014 . . . 201
3.25 Average score gain between the first two attempts for candidates who par-ticipate in the competition twice in the same region quartile . . . 206
3.26 Raw and corrected exam score of teachers by academic region over the period 2003-2013 . . . 213
3.27 Evolution of teachers’ raw and corrected scores on recruitment examina-tions at national level over the period 2003-2013 . . . 214
3.28 Variation in candidates’ exam score between the first and second attempts according to the quartile of the region of departure and arrival . . . 227
3.29 Relationship between the average level of knowledge of candidates and the generosity of the assessment in the region . . . 228
3.30 Relationship between the average level of knowledge of candidates and the success rate of the competition in the region . . . 229
3.31 Relationship between the success rate of the competition and the generosity of the assessment in the region . . . 230
3.32 Evolution of candidates’ raw and corrected scores on recruitment exami-nations at national level over the period 2003-2013. . . 231
3.33 Evolution of teachers’ raw and corrected exam scores at national level during the period 2003-2013 for different values of the correlation between the level of knowledge and the learning gain between attempts (model 3) 232
4.1 Distribution of the Priority Education Network according to school fixed effects on teachers’ absences (in percentiles) . . . 267
4.2 Distribution of civil servant teachers according to experience and school fixed effects on teachers’ absences (in percentiles) . . . 280
4.3 Absence duration (in logarithm) for teachers transiting between terciles of school fixed effects in year t=0 . . . 285
4.4 Absence duration (in logarithm) for schools transiting between terciles of school principal fixed effects in year t=0 . . . 288
4.5 Teacher turnover in schools transiting between terciles of school principal fixed effects in year t=0 . . . 289
4.6 Correlation between teacher fixed effects and school fixed effects according to the number of "movers" (teachers) per school . . . 322
4.7 Correlation between teacher fixed effects and school principal fixed effects according to the number of "movers" (teachers) per school principal . . . 323
4.8 Correlation between school fixed effects and school principal fixed effects according to the number of "movers" (principals) per school . . . 324
4.9 Distribution of the Priority Education Network according to school fixed effects on teacher turnover (in percentiles) . . . 325
4.10 Distribution of civil servant teachers according to experience and school fixed effects on teacher turnover (in percentiles) . . . 326
4.11 Distribution of contract teachers according to experience and school fixed effects on teachers’ absences (in percentiles) . . . 327
4.12 Distribution of contract teachers according to experience and school fixed effects on teacher turnover (in percentiles) . . . 328
4.13 Absence duration (in days) for teachers transiting between terciles of school fixed effects in year t=0 (model 4) . . . 329
List of Tables
1 Share of women by field among university professors and assistant profes-sors, secondary school teachers and university graduates . . . 7
2 Measures of teacher shortages in primary and secondary education in 2016 9
1.1 Description of teachers’ recruiting exams . . . 49
1.2 General sample statistics for teaching exams 2006-2013 . . . 49
1.3 Sample statistics for the high-level exam (Agrégation) and medium-level exam (CAPES) 2006-2013 . . . 50
1.4 Estimates of the bonus for women on oral tests at the higher-level exam in each field. Linear regression models DD, S, and S+IV. 2006-2013 . . . 51
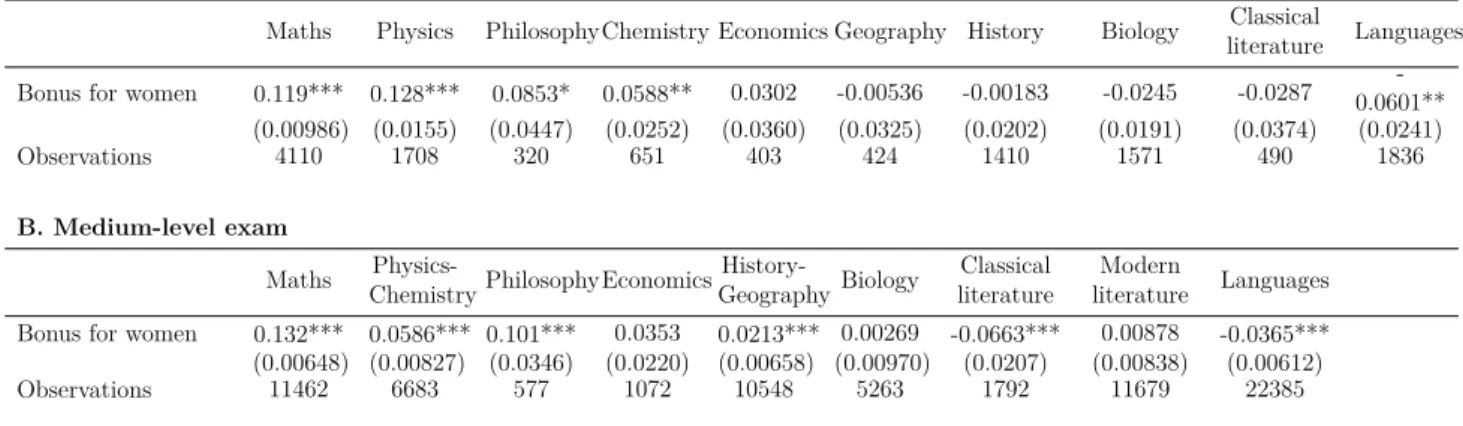
1.5 Estimates of the bonus for women on oral tests at the medium-level exam in each field. Linear regression models DD, S, and S+IV. 2006-2013 . . . 52
1.6 Values taken by Indexes of Feminization . . . 53
1.7 Estimates of the linear relationship b = β + γs between the bias towards females on oral tests b and 3 indexes of fields’ extent of feminization (s). 2006-2013. . . 53
1.8 Probability of success by gender, assuming success is either based only on written tests or only on oral tests. . . 54
1.9 Heterogeneity of the bonus for female candidates at the high-level exams oral tests. Estimates of the DD model on 5 subsamples based on quantiles of the written test scores. 2006-2013 . . . 55
1.10 Heterogeneity of the bonus for female candidates at the medium-level ex-ams oral tests. Estimates of the DD model on 5 subsamples based on quantiles of the written test scores. 2006-2013 . . . 55
1.11 Estimates of the bonus for women on oral tests for women at the math and literature tests in the lower-level exam. Linear regression models DD,
S, and S+IV. 2006-2013 . . . 56
1.12 Heterogeneity of the bonus for female candidates at the lower-level exams math and literature oral tests. Estimates of the DD model on 5 subsamples based on quantiles of the written test scores. 2011-2013 . . . 56
1.13 Effect of the gender composition of the examiners’ panels on oral test scores at the math medium-level exam . . . 57
1.14 Composition of the jury at the Maths medium-level exam in 2014 . . . . 57
1.15 Bonus for women at one oral versus one written test in each field. Linear regression models DD. 2006-2013. . . 58
1.16 Description of all tests at the medium-level examination . . . 59
1.17 Description of all tests at the high-level examination. . . 60
1.18 Female mean rank at all tests at the medium-level examination . . . 61
1.19 Female mean rank at all tests at the high-level examination . . . 62
3.1 Highest level of diploma and principal occupation of candidates for primary school teaching posts over the period 2003-2015 . . . 119
3.2 Orientation of bachelor’s graduates during the periods 2005-2009 and 2012-2017 . . . 120
3.3 Number of teaching posts in primary schools, number of applicants and number of higher education graduates in 2003-2017 . . . 124
3.4 Gender and social composition of candidates and primary school teachers over the 2003-2015 period . . . 127
3.5 Average salaries of bachelor’s graduates, master’s graduates and primary school teachers in the 25 academic regions of metropolitan France over the period 2003-2017 . . . 129
3.6 Relationship between teacher supply, teacher demand and competing em-ployment opportunities over the period 2003-2009 . . . 131
3.7 Relationship between average salaries of bachelor’s and master’s graduates and teachers’ competencies in the period 2003-2009 . . . 133
3.8 Relationship between the average salaries of bachelor’s and master’s grad-uates and the composition of the teaching force during the period 2003-2009134
3.9 Share of local recruitment by academic region . . . 157
3.10 Number of general baccalaureate graduates, candidates and teaching po-sitions by academic region and time interval . . . 158
3.11 Teacher market tightness, teacher demand and teacher supply by academic region and time interval . . . 159
3.12 Raw and corrected exam scores of candidates by academic region and time interval. . . 160
3.13 Raw and corrected exam scores of teachers by academic region and time interval. . . 161
3.14 Classroom observation score of teachers 2-3 after tenure by academic region and time interval . . . 162
3.15 Correlation between diploma level and gender of candidates and teachers over the period 2003-2009 . . . 163
3.16 Correlation between diploma level and median income in the city of resi-dence of candidates and teachers over the period 2003-2009 . . . 163
3.17 Correlation between diploma level and corrected examination score of can-didates and teachers over the period 2003-2009 . . . 164
3.18 Correlation between diploma level and raw examination score of candidates and teachers over the period 2003-2009 . . . 164
3.19 Correlation between diploma level and classroom observation score of teach-ers over the period 2006-2009 . . . 165
3.20 Effect of increasing the degree level required to teach on the number of candidates . . . 166
3.21 Effect of the interaction between the 2011 reform and the demand for teachers on the number of candidates . . . 167
3.22 Effect of increasing the degree level required to teach on the exam score of candidates and teachers . . . 168
3.23 Effect of the interaction between the 2011 reform and the demand for teachers on candidates’ and teachers’ exam score. . . 169
3.24 Effect of increasing the degree level required to teach on the classroom observation score of teachers . . . 170
3.25 Effect of increasing the diploma level required to teach on the number of candidates . . . 171
3.26 Evolution of the number of candidates and the proportion of men among candidates and recruits of the Regional Institutes of Administration (IRA) over the period 2008-2017 . . . 172
3.27 Number of candidates by year and age group . . . 173
3.28 Average score (standardized) and average rank (percentile) of candidates according to the number of times they participated in the competition during the period 2005-2013 . . . 192
3.29 Variance decomposition of the exam score over the period 2003-2013 . . . 210
3.30 Correlation between individual fixed effects, region fixed effects and year fixed effects estimated by models (2) en (3) . . . 212
3.31 Number of candidates, written score and success rate in the primary school teacher recruitment examination over the period 2005-2013, at the national level and by academic region . . . 216
3.32 Average exam score the first and second time candidates participate in the recruitment competition during the period 2005-2014 . . . 217
3.33 Academic regions divided into quartiles according to the generosity of the evaluation standard . . . 217
3.34 Average score of candidates the first and second time they participate in the competition according to the quartile of the region of departure and arrival . . . 218
3.35 Correlation between candidates’ gender, age and exam score on the first attempt over the period 2005-2009 . . . 219
3.36 Correlation between candidates’ gender, age, level of diploma and special-ization of diploma over the period 2005-2009 . . . 220
3.37 Learning gain between the first two attempts depending on the candidate’s level of knowledge . . . 221
3.38 Learning gain between the second and third attempts according to the candidate’s level of knowledge . . . 222
3.39 Region fixed effects estimated using models (2) and (3) . . . 223
3.41 Learning gain between attempts estimated using models (2) and (3) . . . 225
3.42 Comparison of the region fixed effects obtained using different samples and estimation strategies . . . 226
4.1 Socio-demographic characteristics, professional situation and absenteeism of staff in public educational institutions in 2010 . . . 247
4.2 Characteristics of public educational institutions in 2010 . . . 248
4.3 Comparison of the characteristics of the two main study samples over the period 2007-2015 . . . 255
4.4 Contribution of time-varying covariates and fixed effects to the duration of absence of secondary school teachers (Model A) . . . 259
4.5 Variance decomposition of the absence duration of secondary school teach-ers (Model A) . . . 260
4.6 Impact of schools and school principals on teachers’ absence duration ac-cording to their quartile of fixed effects . . . 262
4.7 Average absence duration of secondary school teachers according to differ-ent scenarios . . . 263
4.8 Correlations between the effect of schools (resp. school principals) on ab-sences and the effect of schools (resp. school principals) on teacher turnover264
4.9 Interaction between school (resp. school principal) fixed effects and ab-sence difference between individuals and coworkers. . . 266
4.10 Relationship between working conditions and the effects of schools and principals on absences . . . 272
4.11 Relationship between the effects of schools and principals on absences and teachers’ health status . . . 274
4.12 Relationship between the level of prevention in schools and the effects of schools and principals on absences . . . 278
4.13 Contribution of time-varying covariates, fixed effects and peer effects to the duration of absence of secondary school teachers (Arcidiacono et al. 2012) (Model D) . . . 297
4.14 Variance decomposition of the absence duration of secondary school teach-ers taking into account peteach-ers effects (Arcidiacono et al. 2012) (Model D) 298
4.15 Correlation between the fixed effects estimated by the main specifications (models 3 and 4) and the specification that takes into account peer effects (model 5) . . . 298
4.16 Contribution of time-varying covariates and fixed effects to the duration of absence of secondary school teachers (Model B) . . . 306
4.17 Variance decomposition of the absence duration of secondary school teach-ers (Model B) . . . 307
4.18 Variance decomposition of absence duration for female teachers (Model A) 307
4.19 Variance decomposition of absence duration for male teachers (Model A) 308
4.20 Contribution of time-varying covariates and fixed effects to teacher turnover (Model C) . . . 309
4.21 Relationship between school fixed effects and school characteristics . . . . 310
4.22 Relationship between school fixed effects and school characteristics, taking into account department fixed effects . . . 311
4.23 Share of teachers exposed to major psychosocial risk factors for different teacher samples . . . 312
4.24 Exposure score to major psychosocial risk factors for different teacher samples313
4.25 Percentage of teachers in poor health and percentage of teachers reporting preventive actions in their schools . . . 313
4.26 Absence duration (in logarithm) for individuals transiting between terciles of school fixed effects in year t=0 (Model 3) . . . 314
4.27 Absence duration (in days) for teachers transiting between terciles of es-tablishment fixed effects in year t=0 (Model 4). . . 314
4.28 Absence duration (in logarithm) in schools transiting between terciles of school principal fixed effects in year t=0 (Model 3) . . . 315
4.29 Absence duration (in days) in schools transiting between terciles of school principal fixed effects in year t=0 (Model 4) . . . 315
4.30 Turnover in schools transiting between terciles of school principal fixed effects in year t=0 (model i) . . . 316
4.31 Relationship between the conditional variance of absences and the condi-tional expectation of absences . . . 316
4.34 Variance decomposition of the absence duration of secondary school teach-ers taking into account peteach-ers’ fixed effect and peer’s covariates effects (Ar-cidiacono et al. 2012) (Model E). . . 319
4.35 Contribution of time-varying covariates, fixed effects and peer effects to the duration of absence of secondary school teachers (Ichino & Maggi 2000) (Model F) . . . 320
4.36 Variance decomposition of the absence duration of secondary school teach-ers taking into account peteach-ers effects (Ichino & Maggi 2000) (Model F) . . 321
Introduction
The organization of the French civil service has undergone profound changes since the early 2000s. The Organic Law on Finance Laws (LOLF, 2001), implemented from 2006, and the General Review of Public Policies (RGPP, 2007) intend to modernize government action by moving away from the traditional conception of State organization. These re-forms are inspired by the principles of the New Public Management (Hood,1991), which has been implemented in most OECD countries since the 1990s. The New Public Manage-ment criticizes the functioning of the traditional bureaucratic organization (centralized, hierarchical, impersonal, procedural) that leads to a sub-optimal use of state resources. Based on economic and managerial theories1, proponents of this concept advocate
ap-plying private sector management practices to public administrations. The objective is twofold: to improve the quality of public services and to reduce public spendings. This new paradigm requires that the organization of the State be more oriented towards transparency and performance than towards the resources mobilized, which requires more monitoring and evaluation of results. The New Public Management also advocates the decentralization of state decisions, by giving greater autonomy and responsibilities to managers (Merrien, 1999; Bezes et al., 2011; Kalimullah et al., 2012).
In France, civil service reform has led to the implementation of performance indicators at different levels of execution, the individualization of the evaluation of public employ-ees, and the implementation of a remuneration system partly based on performance. It has also resulted in an increased use of contracts (employees on fixed-term or permanent contracts, public-private partnerships, delegation of services to private companies) and in the reduction of the number of public employees over the period 2007-2012 (Chevallier,
2010). In the interests of performance, neutrality and equity, recent legislation also
en-1Public Choice Theory, Transaction Cost Theory and Principal-Agent Theory initiated by Black (1958) andArrow(1963), and the Scientific Management Movement (Merkle,1980;Hume,1981;Pollitt,
courages the public service to reflect the diversity of citizens, in particular by diversifying recruitment channels.
This thesis focuses on the recruitment and management of teachers who represent 13% of the civil service employees in France2. In 2016, primary and secondary school teachers accounted for 1.3% and 1.7% of the working population3. The majority of them (89% of
primary and 80% of secondary school teachers) worked in public schools. The organization of the education system in France is centralized and placed under the supervision of the Ministries of Education, Higher Education and Research. The State is responsible for educational policy (curricula, diplomas, budgets, evaluations) and for the recruitment, remuneration and career management of all teaching staff. Several government functions are delegated to regional representatives. Since the 19th century, the country has been geographically divided into academies ("academic regions") to which local management of the education system is entrusted. The administrative division corresponding to the academies became closer to that of the administrative regions during the 20th century but they never coincided perfectly. Until 20154, there were 27 administrative regions
and 30 academic regions (see Figure 1). Each academic region is headed by a recteur
appointed by the President of the Republic. The recteurs ensure the application of
national education policy and regulations. They are responsible for the budget and for the management of staff and schools from primary education to university in the academic regions. School principals have administrative (budget proposal and implementation), pedagogical (team coordination and leadership), supervisory (curriculum, school rules, safety), representational (with the municipality and parents) and mediation (problem solving, communication between teachers and parents) responsibilities. They are also responsible for the health and safety of all education employees under their authority. Education inspectors control and evaluate primary and secondary school teachers. They are assigned to an area that includes several schools within the academic region and they organize in-service teacher training.
2There are 5.7 million civil servants and contract workers in the three components - State, territory and hospital - of the French civil service in 2016. Source: L’emploi dans la fonction publique en 2016, Insee Première N◦1691, Mars 2018. Bilan social du ministère de l’Éducation nationale, de l’Enseignement supérieur et de la Recherche - 2015-2016. Authors’ calculations.
3Source: Bilan social du ministère de l’Éducation nationale, de l’Enseignement supérieur et de la Recherche - 2015-2016. Tableaux de l’économie française, Insee Référence, Edition 2018. Authors’ calculations.
4Several administrative regions merged in 2016 but with no consequences for academic regions. In 2018, there are 18 administrative regions.
Administrative regions
Poitou-Charentes
Bourgogne Franche-Comté Alsace Lorraine Champagne-Ardenne Picardie Nord-Pas-de-Calais Haute-Normandie Basse-Normandie Bretagne Pays de la Loire Centre-Val de Loire Limousin Ile-de-France Rhônes-Alpes Aquitaine Midi-Pyrénées Languedoc-Roussillon Provence- Alpes-Côte d'Azur Corse Guadeloupe Martinique Guyane La Réunion Mayotte Auvergne
Academic regions (académies)
Poitiers Lyon Ferrand Dijon Besançon Strasbourg Nancy-Metz Reims Amiens Lille Rouen Caen Rennes Nantes Orléans-Tours Limoges Paris VersaillesCréteil Grenoble Bordeaux Toulouse Montpellier Aix-Marseille Nice Corse Guadeloupe Martinique Guyane La Réunion Mayotte
Clermont-Figure 1 – Administrative regions and academic regions (académies) in France
Note: The map on the left shows the administrative regions in France from 1970 to 2015. The map on the right shows the academic regions (Académies) since 1996.
Most teachers are recruited through competitive examinations (99% in primary education and 92% in secondary education). The recteurs organize teacher competitions in the regions, select the examinations and appoint the members of the juries. Examiners are generally chosen from among teachers and education inspectors for the recruitment of primary school teachers and among teachers and university professors for the recruitment of secondary school teachers. Teachers who pass the competition usually become civil servants after a one year probationary period. Other teachers are hired on the basis of renewable short-term contracts (more rarely on the basis of open-ended contracts) of a maximum duration of one year. Head teachers have little influence on the recruitment and mobility of permanent teachers. However, they are in charge of the recruitment and renewal of non-permanent teachers’ contracts. The remuneration of teachers depends mainly on their status (civil servant or under contract) and seniority. Overtime and bonuses represent 7% of primary school teachers’ salaries and 16% of secondary school teachers’ salaries on average. Evaluations carried out by education inspectors, as well as by school principals in secondary education, have a relatively moderate influence on teachers’ career development and salary prospects.
public service. Successive reforms have led to a new organization of school time, a renewal of school curricula, the implementation of pupil assessments in primary education and the increased autonomy of secondary schools in terms of subject provision. Human resources management has also undergone significant changes. The number of tenured teacher positions has decreased considerably over the period 2007-2011 (see Figure 2). Since 2011, primary and secondary school teachers must hold a master’s degree (a bachelor’s degree was required since 1989). In 2014, the competition tests were modified to give a more important role to the assessment of professional skills (Desbiolles, 2017). An oral interview to assess candidates’ motivation, behavioural qualities and adaptability to the teaching profession was added in 2014. In 2017, the professional evaluation of teachers was modified to introduce more transparency and consistency at the national level. Between 2012 and 2014, and from 2018 onwards, the first day of sick leave is no longer paid in the public service. This measure aims to limit excessive absence behaviour and reduce the costs associated with compensation and replacement of absent employees. Recently, discussions have intensified on the autonomy granted to school principals, particularly in terms of staff recruitment and school budget management. Some actors in the education system are questioning the ability of competitive recruitment to meet the specific needs of students. Others argue that the civil servant status limit the possibility of setting up an individualized management system (Boissinot, 2017).
5000 10000 15000 20000 1990 1995 2000 2005 2010 2015 Year
Number of teaching posts
Teaching level : Primary education Secondary education
Figure 2 – Number of primary and secondary teaching posts over the period 1987-2018
Note: Evolution of the number of teaching positions in the external recruitment competitions for public primary and secondary education over the period 1987-2018. About 85% of tenured teachers are recruited through external competitions. Source: Ministry of Education (DEPP).
The 2010-2016 period is characterized by a stagnation in public sector wages (gel du point d’indice). The increase in teacher qualification levels from 2011 onwards has not led to an increase in teacher salaries5, which remain below the OECD average, particularly in primary education (OECD, 2014). In this context of wage moderation and organiza-tional transformations, this thesis examines the capacity of the teacher recruitment and management system to meet the challenges of attractiveness, efficiency and diversity at the heart of ongoing modernization projects. Particular attention is paid to how recent reforms have contributed to the equal treatment of pupils.
The four chapters that compose this thesis exploit the richness and exhaustiveness of the administrative data of the Ministry of Education. The recruitment and personnel management databases make it possible to monitor the careers of hundreds of thou-5An increase in teacher salaries has began for July 2016. It is reflected in an increase in the fixed salary (end of the gel du point d’indice), an increase in bonuses (subject to the exercise of specific missions in secondary education) and an increase in the salary at the beginning and at the end of teacher career by 2020.
sands of primary and secondary school teachers, from recruitment, through successive assignments, to departure from the education system. They indicate how individuals were recruited (type of competition, results of recruitment tests), provide detailed socio-demographic information (age, sex, level of diploma, specialization of diploma, place of residence, family and professional situation), characteristics of posts occupied (subject taught, number of hours worked, type of establishment, address), career development (status, seniority, evaluation by education inspectors) and provide information on ab-sences (reason, dates, duration). The studies presented in this thesis largely exploit the longitudinal nature of these data. The rules for managing teachers in France (recruit-ment, assignment) also make it possible to implement original identification strategies to address international issues: the lack of gender diversity between professions, the dis-crimination in hiring, the effect of qualification requirements on teacher recruitment, the effects of managerial practices and working conditions on staff health and motivation. This thesis hopes to contribute to the understanding of the challenges of the current education system and shed new light on past and future reforms.
The first chapter focuses on the issue of the gender neutrality of the secondary school teacher recruitment examination. The recruitment of civil servants by competitive examination has gradually become widespread in France since the 19th century. The 1983 law defining the "rights and obligations of civil servants" specifies that the competition must guarantee the neutrality of recruitment (principle of equal treatment of candidates), the efficiency of the civil service (by selecting the most competent candidates) and the independence of civil servants from the political authorities (recruitment is based solely on the "merit" of the candidates). These principles also define the rules governing the re-muneration and career of civil servants, according to their status and seniority. However, the current recruitment of civil servants is far from being meritocratic. Social science research has shown that competitions largely reproduce the gender, ethno-racial, geo-graphical, economic and social inequalities that accumulate throughout the candidates’ academic (and sometimes professional) careers (Duru-Bellat,2003;Versini,2004;Pouget,
2005; DiPrete and Eirich, 2006; Eymeri-Douzans, 2012). This first chapter examines whether competitive recruitment, a standardized process that promises candidates to be assessed under the same conditions and according to the same criteria, is neutral, as required by law, or whether it contributes to increasing (or reducing) inequality among
applicants.
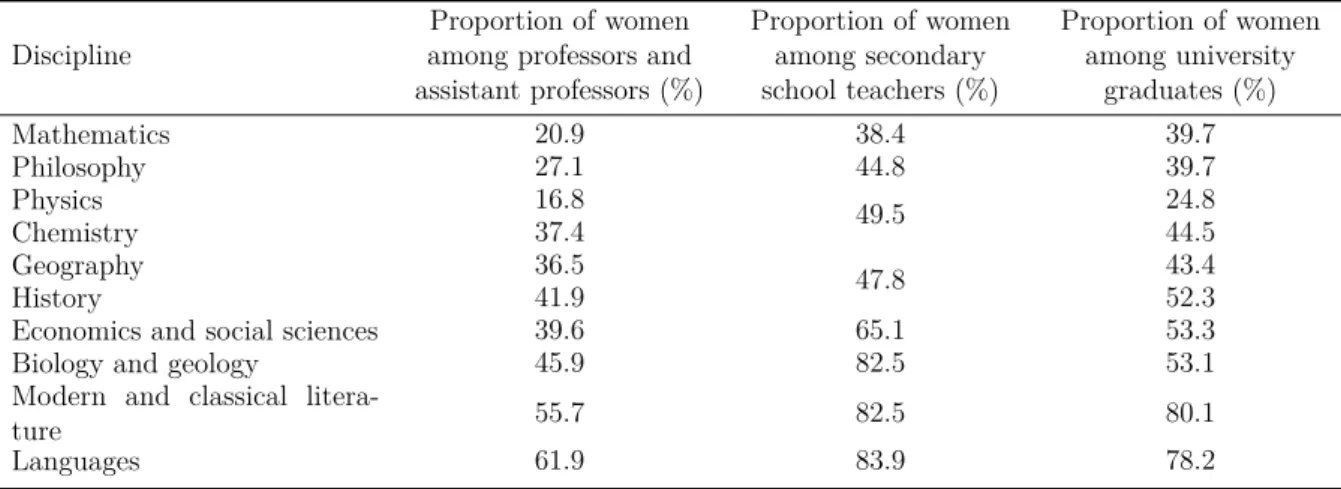
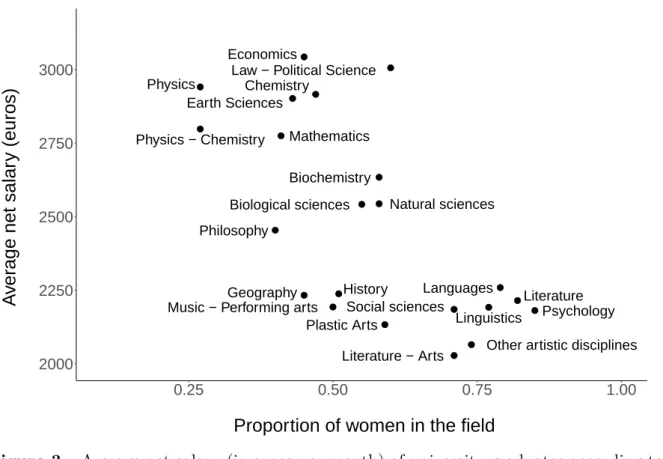
The lack of gender diversity in most academic disciplines is a well-known phenomenon that concerns higher education graduates, secondary school teachers and university pro-fessors (see Table 1). This gender disparity is coupled with a wage disparity since the most feminized specialties generally offer the lowest income prospects (see Figure3). Sev-eral studies also show that a significant share (between 8 and 20%) of the gender pay gap comes from differences in university specialization (Machin and Puhani, 2003). In addition to the issue of equal access to public employment, gender segregation raises the issue of equal treatment of students. Studies in educational sciences have indeed shown that the gender of the teacher can influence the results, orientation and specialization choices of students. Cases of discrimination have been identified in some studies (Dee,
2005), but recent research has mainly highlighted the role model of teachers (Bettinger et al., 2005; Marx et al., 2013; Paredes, 2014; Porter et al., 2017; Breda et al., 2018). These results, consistent with the theory of representative bureaucracy, suggest ensuring diversity of teaching staff in all disciplines.
Table 1 – Share of women by field among university professors and assistant professors,
secondary school teachers and university graduates
Discipline
Proportion of women among professors and assistant professors (%) Proportion of women among secondary school teachers (%) Proportion of women among university graduates (%) Mathematics 20.9 38.4 39.7 Philosophy 27.1 44.8 39.7 Physics 16.8 49.5 24.8 Chemistry 37.4 44.5 Geography 36.5 47.8 43.4 History 41.9 52.3
Economics and social sciences 39.6 65.1 53.3
Biology and geology 45.9 82.5 53.1
Modern and classical
litera-ture 55.7 82.5 80.1
Languages 61.9 83.9 78.2
Notes: 20.9% of mathematics professors and assistant professors (respectively 38.4% of mathematics secondary
school teachers) are women in 2013. 39.7% of university graduates in mathematics are women in 2005-2013.
Source: Ministry of Higher Education and Research (SIES), Ministry of Education (DEPP), Labor Force Survey
● ● ● ● ● ● ● ● ● ● ● ● ● ● ● ● ● ● ● ● ● ● Biochemistry Biological sciences Chemistry Earth Sciences Economics Literature Geography History
Law − Political Science
Linguistics
Literature − Arts Mathematics
Languages Music − Performing arts
Natural sciences
Other artistic disciplines Philosophy Physics Physics − Chemistry Plastic Arts Psychology Social sciences 2000 2250 2500 2750 3000 0.25 0.50 0.75 1.00
Proportion of women in the field
A
v
er
age net salar
y (euros)
Figure 3 – Average net salary (in euros per month) of university graduates according to
the proportion of women among university graduates in the field.
Note: Average net salary (in euros per month) of higher education graduates by academic discipline over the period 2002-2011. Proportion of women among higher education graduates by academic discipline over the period 2002-2011. Source : Labor Force Survey (INSEE). Author’s calculations.
The first chapter reveals that the recruitment of secondary school teachers through competitive examinations is not neutral. Evaluation biases tend to favour the minority gender, and thus contribute to strengthening the diversity of teaching staff in all disci-plines. Although in contradiction with the principle of neutrality established by law, these recruitment biases are likely to reduce differences in students’ specialization in higher ed-ucation, and thus potentially the gender pay gap. The advantage granted to the minority sex when recruiting teachers partly compensates for school and family inequalities, which is reflected in the lack of gender diversity among candidates. The (uncoordinated) atti-tude of recruiters towards greater gender diversity in secondary education could reflect their mobilization on diversity issues.
The second and third chapters examine the capacity of the current management system (recruitment, remuneration, assignment) to attract and motivate the next gener-ation of teachers. For several years, an increasing number of countries have been facing
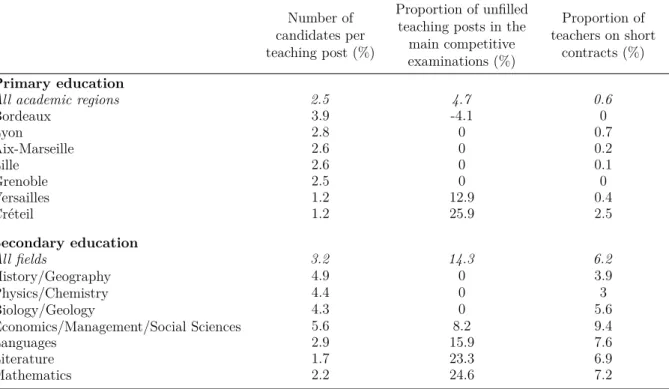
teacher shortages to varying degrees (European Commission 2014). This phenomenon is intensifying on an international scale. It concerns France again after having disap-peared for several years in secondary education and several decades in primary educa-tion. Teacher shortages result in a small number of candidates, difficulties in recruiting appropriate profiles, positions that remain unoccupied for a longer or shorter period, and difficulties in replacing absent teachers. Although difficult to measure, the shortage of teachers in France can be approximated by the number of candidates per post for re-cruitment competitions, the rate of unfilled posts at the end of the usual rere-cruitment procedure and the proportion of teachers on short-term contracts6 In secondary
educa-tion, teacher shortages are concentrated in a few subjects: mathematics, literature and foreign languages in particular. In primary education, where recruitment is decentralized, shortages are concentrated mainly in two regions: Créteil and Versailles (see Table 2).
Table 2 – Measures of teacher shortages in primary and secondary education in 2016
Number of candidates per teaching post (%)
Proportion of unfilled teaching posts in the main competitive examinations (%) Proportion of teachers on short contracts (%) Primary education
All academic regions 2.5 4.7 0.6
Bordeaux 3.9 -4.1 0 Lyon 2.8 0 0.7 Aix-Marseille 2.6 0 0.2 Lille 2.6 0 0.1 Grenoble 2.5 0 0 Versailles 1.2 12.9 0.4 Créteil 1.2 25.9 2.5 Secondary education All fields 3.2 14.3 6.2 History/Geography 4.9 0 3.9 Physics/Chemistry 4.4 0 3 Biology/Geology 4.3 0 5.6 Economics/Management/Social Sciences 5.6 8.2 9.4 Languages 2.9 15.9 7.6 Literature 1.7 23.3 6.9 Mathematics 2.2 24.6 7.2
Notes: Data are presented for academic regions that have recruited more than 14,000 primary school teachers in
2016 and for academic fields that have recruited more than 11,000 secondary school teachers in 2016. In the Créteil region, there are 1.2 candidates for 1 primary school post in 2016. In 2016, 25.9% of primary school positions in the external competition were not filled and 2.5% of primary teachers were on short-term contracts in the Créteil region.
Source: Ministry of Education (DEPP). Author’s calculations.
6Teacher shortages could also be approximated by the number of teacher-free days per student during the school year. Teachers on short-term contracts respond to specific needs (replacing an absent teacher) or fill positions that remain vacant at the end of the tenured teacher assignment process.
The second chapter draws on the theoretical and empirical literature in economics to propose a simple model that provides a better understanding of the effect of salary, the number of positions and the level of qualification required on the supply and skills of teachers. Based on reasonable assumptions, the model demonstrates an increase in the number of candidates as teacher salary increases, a positive (but decreasing) elasticity in the supply of teachers with the number of positions, and a decrease in the number of candidates as the required qualification level increases. This theoretical framework also helps to understand the mechanisms by which diversity in recruitment is likely to be affected. However, more restrictive assumptions would be needed to remove ambiguity about the effect of salary, demand and diploma level on teachers’ competencies. The unexpected increase in teachers’ salaries from 2017 onwards (especially for those working in priority areas of education) will make it possible to estimate the elasticity of teacher supply and characteristics with salary.
The third chapter examines whether the so-called "masterisation" reform, which raised the level of qualification required to teach from a bachelor’s to a master’s degree in 2011 in France, has affected the attractiveness of the profession and the characteristics of the teachers recruited. This reform is quite clearly based on the principles of the new public management. First, it aims to improve the quality of education by extending the duration of teachers’ studies. Second, it aims to reduce public expenditure by no longer remunerating initial training, which is now integrated into a master’s program that must be obtained before recruitment7. Although a dozen OECD countries are now recruiting
teachers at the master level (European Commission 2014), this type of policy has never been evaluated to my knowledge. This chapter shows that the increase in the level of qualification required has led to a sharp drop in the number of candidates for primary teacher posts. The reform also reduced the level of teachers’ knowledge measured by the competitive recruitment examination, but did not affect the pedagogical skills assessed in class by education inspectors. The gender mix of recruitment also decreased after the reform, but the context of stagnating wages may have contributed to the decline in the share of men among candidates. Following the 2011 reform, recruitment inequalities have 7The initial training of civil servant teachers lasts two years. The first year focuses on the acquisition of disciplinary and pedagogical knowledge, while the second year focuses on practical training. Before 2011 and from 2014, the first year of training is optional and precedes recruitment. The second year is open only to successful candidates and includes a significant number of hours of classroom instruction. Trainee teachers are paid full-time during this second year of training.
tended to widen between regions. Teacher shortages have emerged in regions where the number of candidates has declined the most and additional competitive examinations were created from 2015 onwards to fill posts that remained vacant following the usual recruitment procedure. The share of contract teachers and the difficulties in replacing absent teachers remain higher in these regions than in the rest of the country.
The fourth and last chapter of this thesis examines the link between working con-ditions and managerial practices on the one hand, and teacher absences and turnover on the other. In most countries, the implementation of the New Public Management has led to increased school autonomy. This autonomy has taken various forms and intensi-ties depending on the country (Scheerens and Maslowski,2008) but it generally leads to greater margin of decision for the school principal in terms of pedagogy (choice of teach-ing projects and methods, courses and programmes, timetables), personnel management (recruitment, dismissal, remuneration) and budget management (including the search for private funding sources). Supporters of school autonomy argue that giving schools more responsibility and flexibility to achieve the objectives set by the state will improve the performance of the education system as a whole and reduce educational inequalities. By giving more space to individual initiatives, school autonomy fosters innovation and makes the teaching profession more attractive. By giving school principals the freedom to form the most appropriate pedagogical team, school autonomy makes it possible to meet the specific needs of pupils.
Recent literature in economics of education shows that headteachers have a significant influence on the academic performance of students (Coelli and Green,2012;Branch et al.,
2012). However, the managerial practices, pedagogical choices and conditions associated with student success are still largely unknown (Clark et al.,2009). One reason for this is that the effects of the reforms that have led to greater school autonomy around the world have received very little evaluation. Recent empirical studies show that these initiatives have mixed, and overall rather modest, effects on student performance (Clark et al.,2009;
Allen, 2010; Epple et al., 2017). Studies based on international comparisons are more optimistic and generally conclude that school autonomy has a strong positive impact on student achievement. However, the decentralization of responsibilities and decisions is generally accompanied by a strengthening of school monitoring, which can explain a significant part of the estimated gains in school success.
Several actors in the French education system advocate greater autonomy for schools, particularly in the recruitment and evaluation of teachers (Chaix, 2015; Lefèvre, 2015). Many of them agree that the success of such a transformation depends on the manage-rial skills of school principals and, in particular, on the attention they pay to working conditions. Chapter 4 shows that, despite relatively limited decision latitude8, the school
principal has a real influence on sick leaves and voluntary departures of teachers. In addition, teachers faced with increased absenteeism and departures from their schools following the arrival of a new headteacher more often report a lack of hierarchical sup-port. This first result raises the question of the recruitment and training of headteachers, particularly in the area of psychosocial risk prevention. In the United States, where schools enjoy a high degree of autonomy, a recent study shows that intensive training of principals in management practices has a positive impact on student success (Fryer et al., 2017). The effect of training headteachers in prevention could be the subject of future research. This fourth chapter also shows that schools influence teacher absences and turnover. In schools that increase absenteeism and departures, teachers are more of-ten confronted with hostile behaviors and high work inof-tensity. The analysis reveals that teachers working in these schools are more likely to develop depressive symptoms and that young and inexperienced teachers are more likely to be assigned to these schools. These results call for an improvement in working conditions in schools. They also question the effectiveness of seniority-based mobility rules that result in inexperienced teachers being assigned to schools with the least favorable working and learning conditions. This chapter suggests that teacher absenteeism can be significantly reduced by addressing the issue of working conditions and managerial practices. The method proposed in this chapter can contributes to identifying the schools and school heads for whom prevention actions should be carried out as a priority.
In the following paragraphs, I present in more detail the context, the methods and the results obtained in the four chapters that compose this doctoral thesis.
Chapter 1, Teaching accreditation exams in France favor women in male-dominated
8In France, with rare exceptions, school principals are not consulted when recruiting and assigning tenured teachers. In secondary education, principals have authority over teachers and non-teaching staff but are not empowered to take disciplinary action. Moreover, the evaluation of teachers by school principals has practically no impact on their remuneration.
disciplines and men in female-dominated fields, is a joint work with Thomas Breda and investigates whether discrimination against women is a possible cause behind their un-derrepresentation in certain STEM (Science, Technology, Engineering, and Mathematics) subjects, as suggested by some authors. We show that this is not the case at the com-petitive exams used to recruit almost all French secondary and postsecondary teachers. Our method is based on the comparisons of oral non gender-blind tests with written gender-blind tests for about 100,000 individuals observed in 11 different fields over the period 2006-2013. We find that the bias in favor of women (respectively men) is strongly increasing with the extent of a field’s male (respectively female)-domination, as measure by the share of women (respectively men) among the professors and assistant professors in the field. This bias turns from 3 to 5 percentile ranks for men in literature and foreign languages to about 10 percentile ranks for women in math, physics or philosophy. One implication of this study is that active policies aimed at counteracting stereotypes and discrimination should focus more on early ages, before educational choices are made. In the absence of discrimination in hiring, future research should also focus on understanding why women enroll less often than men in science.
Chapter 2, Understanding the effect of salary, degree requirements and demand on
teacher supply and quality: a theoretical approach, examines under which conditions de-gree requirements and financial incentives can help attract more and potentially better candidates for teaching positions. For several years, most developed countries have faced growing problems of teacher shortages in primary and secondary education, and it seems essential to better understand the levers available to stem this phenomenon. After a re-view of the theoretical and empirical literature, this chapter proposes a simple framework based on classical economic theory. The model shows, with reasonable assumptions, that increasing teacher salaries and demand have positive effects on teacher supply, which is consistent with the results of the empirical literature. On the other hand, increasing the level of qualification required to teach is expected to reduce the number of candidates for teaching posts. The effect of salary, demand and qualifications on teacher quality is much more difficult to predict. It depends heavily on the nature of the correlation be-tween teacher on-the-job performance and the competencies measured by the degrees and selection criteria used in recruitment. The effect also depends on the ability of financial and non-financial incentives to attract the best candidates. Empirical evaluations should