HAL Id: hal-01416924
https://hal.archives-ouvertes.fr/hal-01416924
Submitted on 26 May 2020
HAL is a multi-disciplinary open access
archive for the deposit and dissemination of
sci-entific research documents, whether they are
pub-lished or not. The documents may come from
teaching and research institutions in France or
abroad, or from public or private research centers.
L’archive ouverte pluridisciplinaire HAL, est
destinée au dépôt et à la diffusion de documents
scientifiques de niveau recherche, publiés ou non,
émanant des établissements d’enseignement et de
recherche français ou étrangers, des laboratoires
publics ou privés.
Active deformation of the Corinth rift, Greece: Results
from repeated Global Positioning System surveys
between 1990 and 1995
Pierre Briole, Alexis Rigo, H. Lyon-Caen, Jean Claude Ruegg, K. Papazissi,
C. Mitsakaki, A. Balodimou, G. Veis, D. Hatzfeld, Anne Deschamps
To cite this version:
Pierre Briole, Alexis Rigo, H. Lyon-Caen, Jean Claude Ruegg, K. Papazissi, et al.. Active deformation
of the Corinth rift, Greece: Results from repeated Global Positioning System surveys between 1990
and 1995. Journal of Geophysical Research : Solid Earth, American Geophysical Union, 2000, 105
(B11), pp.25605 - 25625. �10.1029/2000JB900148�. �hal-01416924�
JOURNAL OF GEOPHYSICAL RESEARCH, VOL. 105, NO. Bll, PAGES 25,605-25,625, NOVEMBER 10, 2000
Active deformation of the Corinth rift Greece'
Results from repeated Global Positioning
System surveys between 1990 and 1995
P. Briole,
1 A. Rigo,
e H. Lyon-Caen,
3 J. C. Ruegg,
1 K. Papazissi,
4
C. Mitsakaki,
4 A. Balodimou,
4 (3. Veis,
4 D. Hatzfeld,
• and A. Deschamps
•
Abstract. Between 1990 and 1995, we carried out seven Global Positioning
System (GPS) c•mp•igns in the Corinth rift •re• in order to constrain
the spatial
•nd temporal crustal deformation of this •ctive zone. The network, 193 pointsover --10,000 km e, s•mples most of the •ctive f•ults. In order to estimate
the
deformation over • longer period, 159 of those points •re •lso Greek triangulation
pillars previously measured
between 1966 •nd 1972. Two e•rthqu•kes of m•gnitude
6.2 •nd 5.9 h•ve occurred in the network since it w•s inst•lled. The extension
rate deduced
from the analysis of the different GPS data sets is 14 4- 2 mm/yr
oriented N9øE in the west, 13 4- 3 mm/yr oriented S-N in the center, and 10 4- 4
mm/yr oriented N19øW in the east of the gulf. The comparison
between GPS and
triangulation
gives higher rates and less angular divergence
(25 4- 7 mm/yr, N4øE;
22 4- 7 mm/yr, S-N; 20 4- 7 mm/yr, N15øW, respectively).
Both sets of data indicate
that the deforming
zone is very narrow (10-15 kin) in the west, might be wider in the
center (15-20 kin), and is more diffuse
in the east. The analysis
of the displacements
observed after the M•-6.2, June 15, 1995, and the M•=5.9, November 18, 1992, earthquakes, both located in the west of the gulf, together with seismological andtectonic
observations
shows
that these two earthquakes
occurred
on low-angle
(_<
35 ø) north dipping normal faults located between
4.5 and 10 km depth in the inner
part of the rift. Assuming that the deformation is concentrated
in relatively narrow
deforming zones, we use a simple model of a dislocation in an elastic half-space
to study the implication of the localization. Using the geometry of the knownseismogenic
faults, our observations
imply continuous
aseismic
deformation in the
uppermost crust of the inner rift. This model predicts geodetic strain rates close to seismic strain rates in opposition to previous estimates. This is because our model takes into account the activity on low-angle normal faults in the inner rift and an effective seismogenic layer of 6-7 kin, about half that usually assumed.1. Introduction
The Aegean is the most seismically active part of Eu- rope and one of the most rapidly extending provinces of
•D6partement de Sismologie, UMR-CNRS 7580, Institut
de Physique du Globe, Paris, France.
2Groupe de Recherche en G6od•sie Spatiale, Observatoire
Midi Pyrenees, Toulouse, France.
3Laboratoire de G•ologie, Ecole Normale Sup•rieure, Paris,
France.
4Higher Geodesy Laboratory, National Technical Univer-
sity, Athens, Greece.
SLaboratoire de G6ophysique Interne et Tectonophysique,
Observatoire de Grenoble, Grenoble, France.
6Laboratoire de G•odynamique, CNRS Sophia-Antipolis,
Valbonne, France.
Copyright 2000 by the American Geophysical Union.
Paper number 2000JB900148.
0148-0227/00/2000JB900148509.00
the world. [e.g., Mercier et al., 1977; McKenzie, 1978;
Le Pichon and Angelier, 1981; Jackson and McKen-
zie, 1988; Le Pichon et al., 1995]. In northern Greece
the deformation is accommodated across a series of ex-
tending grabens (North Aegean trough, Evvia graben, Corinth rift) delimited by active normal faults oriented
NW-SE to E-W. These grabens connect the western part of the North Anatolian fault to the Hellenic Arc
[Armijo et al., 1996]. The Corinth rift (Figure 1) is
the most active of these grabens and the most acces- sible one to observations because only its central part is presently under sea level. It thus provides a very good opportunity to study in detail crustal deforma- tion processes involved in such active rifting. The work presented in this paper is part of a European multidisci- plinary effort aimed at a better understanding of these processes in that area. Results from seven Global Po-
sitioning System (GPS) campaign measurements of a dense network first installed in 1990 and now covering
the entire gulf are given. Besides providing accurate in-
25,606 BRIOLE ET AL.- DEFORMATION OF THE CORINTH RIFT & Livadia 1981t03/05 1981/03/04
1
ø, . 24
Alklom
'des
• ... 1981 •3/0 1981t0•2 Corinth 22 00' 22 30' 23 00'Figure 1. Seismotectonic map of the Corinth rift showing topography, active faults, and fault plane solutions of earthquakes > Me = 5.5 for the period 1965 to present. Adapted fi'om Armtie
nigo .t
solution parameters are listed in Table 3. Ps, -He, and Xi refer to the Psatopirgos, Hclike, and Xilokastro faults, respectively.
stantaneous extension rates across the rift, the density of observations both in space and time allows us to give new insights on the localization of the deformation, the effective thickness of the brittle crustal layer, and the relation between the continuous part of the deformation
(loading process) and the discontinuous part associated
with earthquakes. For this purpose, we use available geodetic, tectonic, and seismological observations out-
lined below.
The Corinth rift is an asymmetric Quaternary rift.
The most active normal faults are located on the south-
ern coast of the gulf which is subject to uplift [$Sbricr, 1977; Armijo et al., 1996]. The typical length of the E-
W striking en •chelon fault segments along the southern
coast of the gulf (from Xilokastro to Psathopirgos) is 15
+ 5 kin. Tectonic studies based on deformation model-
ing of marine terraces in the footwall of the Xilokastro fault, a major fault on the central part of the south coast
(Figure 1), indicate that the overall long-term morphol-
ogy of the southern coast of the gulf can be explained by the repetition of earthquakes on 400-600 north dipping
faults, slipping at 11 + 3 mm/yr [Armijo et al., 1996].
This would correspond to an extension rate of 6 + 1 mm/yr. The level of historical and instrumental seis-
micity is quite high [Papazachos and Papazachos, 1989;
Ambraseys and Jackson, 1990; Rigo et al., 1996; Am-
braseys and Jackson, 1997]. During the last 40 years
ß the seismicity of the Corinth rift included six events of magnitude ]1.I• _> 6 (Eratini, 1965, M•-6.4; Antikira, 1970, M•=6.2; Corinth 1981, M•=6.7, ;lL=6.4, and M•=6.2; Aigion, 1995, M•=6.2). The focal mechanisms of all these earthquakes represent almost pure normal faulting with a N-S to NNW-SSE extension direction
[e.g., Baker et al., 1997] (Figure 1). Although the two
main events of the 1981 sequence ruptured known 45- 500 north dipping faults outcropping on the southern
coast of the gulf [Jackson et al., 1982; Hubert et al., 1996], the 1995 Aigion earthquake ruptured a fairly low
angle (33 ø) north dipping off shore normal fault not out-
cropping on land [Bernard et al., 1997a]. This earth-
quake, together with the 1992 M,:5.9 Galaxidi earth-
quake [Hatzfeld et al., 1996], demonstrated that inner-
rift normal faults could play an important role in the deformation of the rift and that these faults may have somewhat lower dips than the on shore ones. In addi- tion, a 2-month microseismic study conducted in 1991
in the western part of the gulf [Rigo et al., 1996], and
covering the Aigion 1995 earthquake epicentral area, revealed a strong clustering of micro earthquakes. A significant number of these indicate north dipping, low- angle, normal-faulting focal mechanisms at 7-11 kin depth beneath the northern coast of the gulf. This re- sult suggested that the steeply north dipping normal faults seen at the surface root at these depths on a low-
BRIOLE ET AL.' DEFORMATION OF THE CORINTH RIFT 25,607
40
300
39 ø 38 ø 37 ø 36 ø 20 ø 21 ø 22 ø 23 ø 0 o [] oSLR
points
Aegean sea network
Central Greece network
Corinth & Central networks
24 ø . . 40 ø 39 ø 37 ø 36: 21 ø 22 ø 23 ø 24 ø
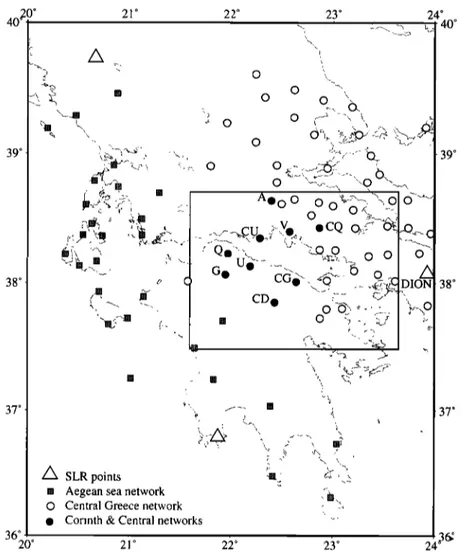
Figure 2. Geodetic
networks
in central
Greece.
Triangles
are the satellite
laser
ranging
(SLR)
points. The SLR pad of Dionysos is used as reference for all GPS campaigns in central Greece.
Shaded
squares
indicate
the Ionian sea network [Kahle et al., 1995]. Circles
are the 6(3 points
of the central Greece network [Den!Is et al., 1994] installed in 1989. The eight solid circles,displayed with their code, are the central Greece points common with the Corinth rift network.
Corresponding
central
Greece
code
can be found in Table A1 (available
as electronic
supporting
material). The box indicates the location of Figure 3.angle dipping (150 4- 10 ø) detachment zone [Rigo et al., 1996; Rietbrock et al., 1996].
Using the comparison between old triangulation ob- servations and a GPS survey, Billiris et al. [1991] gave the first large-scale determination of geodetic deforma-
tion rate (10 mm/yr) and extension
orientation
(N-S)
of the Corinth rift over a 100-year period. Clarke et al.
[1997] give a more detailed picture of the deformation
at the regional scale around the gulf based both on a 100-year comparison and on G PS results between 1991 and 1996. In particular, they show that the velocities
increase
smoothly
from east (6.4 4- 1.0 mm/yr) to west
(12.7 4- 1.0 mm/yr). They found that the geodetic ve- locity in the eastern gulf is in good agreement with that deduced by summing 100 years of energy released byearthquakes. This is not the case in the west, where the rate of seismic moment release predicts extension rates 12 to 3 times smaller than the lowest geodetic extension
rate observed. According to Ambraseys and Jackson
[1997] the frequency of large earthquakes in the eastern
gulf during the period 1690-1890 has been higher than during this century, and they suggest that the deficit of
seismic strain release in the western Corinth rift could
be met by several such earthquakes in the medium term. However, the former comparisons of seismic and geode- tic balances of energy release are strongly dependent on the effective thickness of the seismogenic layer.
On the basis of our dense geodetic data and on the knowledge gained from the 1995 Aigion earthquake,
we will refine the extension rate across the rift and
demonstrate that the deformation is strongly localized. We then study the consequences of this localization by means of simple dislocation models that allow us to dis-
cuss the inner/outer rift repartition of the deformation
as well as the effective thickness of the seismogenic layer
25,608 BRIOLE ET AL.: DEFORMATION OF THE CORINTH RIFT
2. Data
2.1. Geode•ic Networks
During the last 10 years, several groups have installed
and measured GPS networks in continental Greece at
different spatial scales and in different areas (Figure 2).
These networks are well tied together and have been colocated with the SLR pad of Dionysos during most of the GPS campaigns. In 1989 the "central Greece" net-
work (66 points) covering an area of about 150 x 150
km was installed and measured by the National Tech- nical University of Athens; the Universities of Newcas- tle, Nottingham, Oxford, and Cambridge; and the ETH Zurich for the purpose of monitoring the deformation
of Central Greece at a large scale [Denys et al., 1994; Clarke et al., 1998]. Our network was progressively in-
stalled around the Gulf of Corinth starting in 1990, with the purpose of monitoring the deformation associated with the seismic cycle around the main active faults. It includes nine central Greece points. In October 1995 the network included 193 points. Among these, 51
are first-order points (Figure 3) observed during sev- eral long sessions (8 hours typically) in each campaign
and with a precision of localization of a few millimeters, and 142 are second-order points increasing the density
of the first-order network (Figure 3) but observed dur- ing short sessions (1-2 hours). The first-order network
distribution has been established in order to ensure an
accurate and pertinent determination of the deforma- tion around the active faults where both spatial and temporal gradients of deformation are expected. Addi-
tional criteria such as accessibility, safety of the place, and local terrain stability have also been taken into ac- count. This latter criterion has been difficult to satisfy along the southern coast of the gulf where most of the area is covered by young sediments and alluvial deposits
(e.g., points D,T,Y,CI,CQ). In principle, the density of the second-order network (Figure 3) is high enough to
ensure a sufficient number of displaced points for mod- erate earthquakes like the M•=5.9 1992 Galaxidi and M•=6.2 1995 Aigion ones. A network with such a spa- tial density was particularly useful for measuring the ground deformation associated with the June 15, 1995, Aigion earthquake and constraining the fault plane that ruptured during this event, the rupture size, and the
amount of slip [Bernard et al., 1997a]. All second-order
points are pillars of the Hellenic triangulation network
measured between 1966 and 1973. "Old" coordinates of
these points have been recalculated in the Greek Geode-
tic Reference System (GGRS 87) [V els et al., 1992], and
we present here a comparison of these coordinates with the GPS ones in addition to the comparison of GPS
coordinates between 1990 and 1995.
2.2. GPS Campaigns
Overall, seven GPS campaigns took place in 1990, 1991, 1992, 1993, 1994, June 1995, and October 1995.
Table 1 summarizes the characteristics of each cam-
paign. During each campaign, the first-order points
were measured in three or four sessions of 8 to 24 hours.
The measurements were carried out using various types
of Ashtech receivers (LD-XII, MD-XII, P-XII, Z-XII3).
22 ø 23 ø
ß
•ao•
ß ß oo4
-co "a,;
] ß
.
3• ø
22 ø 23 ø
Figure 3. Corinth rift GPS network. The nine large solid points are common with the cen- tral Greece network. %Jangles are the additional first-order points. Small points indicate the location of second-order points. All these points are pillars of the "old" Greek triangulation.
Table A1 (electronic) displays coordinates and details about the first-order points, and Table A2 (electronic) displays coordinates and details about the pillars.
BRIOLE ET AL.' DEFORMATION OF THE CORINTH RIFT 25,609
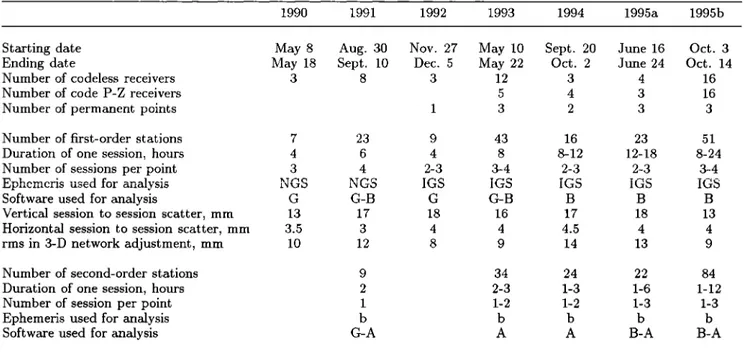
Table 1. Overview of the Seven GPS Campaigns
1990 1991 1992 1993 1994 1995a 1995b
Starting date Ending date
Number of codeless receivers
Number of code P-Z receivers
Number of permanent points
Number of first-order stations
Duration of one session, hours Number of sessions per point Software used for analysis
Vertical session to session scatter, mm Horizontal session to session scatter, mm rms in 3-D network adjustment, mm
Number of second-order stations
Duration of one session, hours Number of session per point Ephemeris used for analysis Software used for analysis
May 8 Aug. 30 May 18 Sept. 10 3 8 7 23 4 6 3 4 •Tf• •T •-• • G G-B 13 17 3.5 3 10 12
Nov. 27 May 10 Sept. 20 June 16 Oct. 3
Dec. 5 May 22 Oct. 2 June 24 Oct. 14
3 12 3 4 16 5 4 3 16 I 3 2 3 3 9 43 16 23 51 4 8 8-12 12-18 8-24 2-3 3-4 2-3 2-3 3-4
iGS iGS iGS 1•
G G-B B B B 18 16 17 18 13 4 4 4.5 4 4 8 9 14 13 9 9 34 24 22 84 2 2-3 1-3 1-6 1-12 1 1-2 1-2 1-3 1-3 b b b b b
G-A A A B-A B-A
G, GAMIT software; B, BERNESE software; A, Ashtech GPPS software; IGS, International GPS Service for Geody-
namics; NGS, National Geodetic Survey (U.S.); b, broadcast orbits.
A few of the 1995 measurements were carried out us-
ing Leica and Trimble receivers. During the first cam-
paigns, especially 1991 and 1993, most of the measure- ments were performed during evenings and nights to
try to minimize both ionospheric and tropospheric ef-
fects. Later, because of the increasing number of re- ceivers and decreasing number of operators, we often left the receivers unattended for longer periods of time, thus with day and night observations in the same data files at the same point. Starting in 1992, at least one station was maintained in permanent recording during the whole campaign. In the 1994 and 1995 campaigns,
there were four permanent recording stations (Dionysos and points T, CH, and CT in the network).
2.3. GPS Data Processing
Processing of the GPS data was performed using
GAMIT and BERNESE software for the first-order
points and Ashtech Geodetic Post Processing Software
(GPPS) software
for the second-order
points. Avail-
able data from the International GPS Service (IGS) sta-tions Matera, Graz, Wettzell, and Madrid were included in the processing for the 1993, 1994, and 1995 cam-
paigns. The coordinates of our network are expressed
within the International Terrestrial Reference Frame
1992 (ITRF92) [Boucher
e! al., 1993] for epoch April
1993. The reference point used for all campaigns was
the main GPS point of Dionysos Observatory (DION) except for the first campaigns (1990 to 1992) in which
DION was not measured. For those campaigns the ref- erence has been arbitrarily fixed at point E. Owing to the small size of the network and the large deforma-
tions measured, this selection of a reference point at each campaign is purely technical, as errors as large
as 20 cm in the absolute coordinates would not affect
significantly the relative positioning. For the same rea- son, using the IGS stations as "fiducial" sites was not mandatory in our study. For the 1994 and 1995 cam- paigns we processed the IGS data together with the others, especially to improve the accuracy of vertical positioning. The relative horizontal coordinates within the network do not depend upon the introduction of IGS stations in the processing. For all campaigns we used
the tropospheric parameters measured in the field (tem- perature, pressure, humidity) to fit the a priori model (the same tropospheric model of Saastamoinen is used by the GPPS, GAMIT, and BERNESE software) and
let the software estimate an additional term of tropo- spheric delay correction in windows of 6 hours. For the second-order points the Ashtech GPPS software does not estimate an additional term of tropospheric delay, and the data were processed by introducing one unique set of tropospheric parameters for the whole session. The data from the later campaigns are fairly good, es- pecially those obtained from Z-code Ashtech receivers. In contrast, some 1990-1991 data were difficult to clean for cycle slips because of the lower signal/noise ratio of the first generations of receivers and the higher level of solar activity in early 1990s inducing high ionospheric perturbations. Because of the moderate size of the net- work we were able to fix almost all phase ambiguities for all campaigns. The accuracy of the solutions is sum- marized in Table 1. For each campaign we tested the quality of our processing according to two criteria:
25,610 BRIOLE ET AL.' DEFORMATION OF THE CORINTH RIFT a 1991 Baseline length b •'2o fi 15 m 10 • 5 : 3 0 ' • o 1993 Baseline length i i i i i i
f
10 20 30 40 50 60 •' 20 • 15 m 10 m 5 3 0 North component 10 20 30 40 5'0 6'0 •' 20 • 15 m 10 c• 5 B: 0' 0 North component •' 20 • 15 m 10 3 0 East component 0 10 20 30 40 5'0 6'0 •' 20 • 15 m 10 m 5 3 0 East component 1'0 2'0 3'0 40 5'0 6'0 • 1oo• 80
m 60• 40
20 •: o Vertical 0 10 20 30 40 Length (km) •' 100 • 80 • 60• 4o
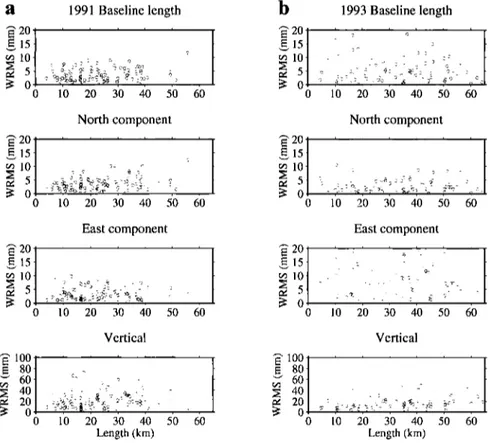
20 • o 50 60 0 Vertical 10 20 30 40 50 Length (km)Figure 4. Session
to session
scatter versus
baseline
length for (a) the 1991 and (b) the 1993
GPS surveys. For each day the data were processed with the GAMIT software using preciseorbits (NGS orbits in 1991 and IGS orbits in 19!13).
Each GPS station
was occupied
during
four
sessions of about 8 hours. Several baselines have been measured two, three, or four times. The plotted circles are the weighted rms deviation from the weighted mean of different components
(length, north, east, and vertical) of these baselines.
The average
rms for all the baselines
are
reported in Table 1. For the baseline length the average rms is 3 mm for the 1991 campaign and4 mm for the 1993 campaign.
1. We checked the day-to-day repeatability of the
baselines
(for the baselines
measured
at least
two times).
In Figure 4 we show for example the root-mean-square
(rms) scatters in east, north, and up components and
in distance versus baseline length for the 1991 and 1993 campaigns. All the campaigns were analyzed in the same manner and the baseline repeatability of each of them is given in Table 1. The horizontal repeatability is •3-4 mm, and the vertical one is between 1 and 2 cm. Also, there is no correlation between the length of the
baseline and the quality of the repeatability (Figure 4),
the repeatability of a given baseline being more depen- dent on the difference in elevation between the points than on the length of the baseline itself. This is related to nonmodeled tropospheric effects.
2. For each campaign the coordinates were adjusted to fit the baselines using a least squares adjustment
technique [Tarantola and Valette, 1982], in a code (AG3D) developed at Institut de Physique du Globe
de Paris (IPGP) [Ruegg
and Bougault,
1992]. The rms
of the residuals after adjustment gave us another esti- mate of the global consistency of the network. For all the campaigns, there is a good agreement between the
average scatter of the individual baselines before ad-
justment and the rms of the global adjustment (Table 1).
3. Results
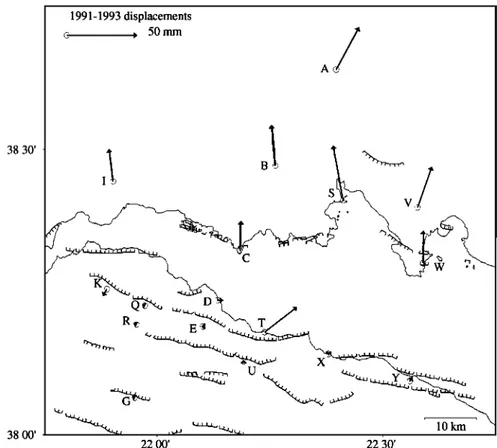
3.1. Basic Results and Their Implications Figure 5 shows the 1991-1993 displacements in the
western Gulf of Corinth where measurements started
in 1990 and 1991. It clearly indicates that, over the 3
years sampled, most of the deformation occurs off shore in the central part of the rift. The extension occurs on
average along an axis oriented N9øE, consistent with
the regional tectonics.
Figure 6 displays the time series of 1990-1995 relative
displacements
(values
in Table 2) of linc A-G, projected
along
the N9øE axis. At the first-order
and according
to the error bars on the coordinates at each epoch of ob-servations, the extension of the rift is a linear function of the elapsed time between 1990 and 1994. The south-
crn side
of the gulf appears
to behave
as an almost
rigid
block. The northern
side of the gulf, between
points
B
and A appears also to behave as a rigid block, whereasBRIOLE
ET AL.' DEFORMATION
OF THE CORINTH
RIFT
25,611
1991-1993 displacements c, • 50 mmA/
38 30' 38 00' 22 00' 22 30'Figure 5. The 1991-1993 displacements in the western part of the Corinth riff; G is fixed.
150 lOO 50
•B
-50 1990 • 1991 • 1992 •_1993•_ 1994 L 1995 , Time (years)Figure 6. N9øE projection
of the displacements
(mm)
of points A,B,C,D,E,F,G as a function of time. Er-
ror bars for each individual campaign are drawn. The
change in the slope of the curves between 1994 and 1995 corresponds to the coseismic displacements associated
with the June 15, 1995, Aigion earthquake. Points A and G are not sensitive to that earthquake.
the extension rate at point C is somewhat lower than at B and A. This trend changes between 1994 and 1995 ow- ing to the M•=6.2, June 15, 1995, earthquake. Between 1993 and 1994 the data suggest that the extension rate
of the northern side might have been lower than during
the previous years, but the change is subtle except at point C. We estimate that the hypothesis of a change of extension rate before the 1995 earthquake is not suf- ficiently supported by our data to be discussed here.
In this paper, we use these raw results to present a more refined analysis.
1. From the results of Figure 6, we argue that at the first order, over short periods of time, the deformation
of the rift is the sum of a linear deformation field and
of the contribution of the earthquakes.
2. We use this argument to separate in our geodetic data the contribution of the 1992 and 1995 earthquakes
from the total observed deformation.
3. We use the relative rigidity of the southern and
northern blocks to scale and rotate coordinates issued
from classical geodetic observations within the GPS co-
ordinates frame.
3.2. Coseismic Deformation
Two significant
earthquakes
occurred
during the pe-
riod of our surveys,
on November
18, 1992 (Ms=5.9,
Galaxidi),
and on June
15, 1995
(M,=6.2, Aigion).
Co-
seismic
displacements
were measured
at six points for
the 1992
earthquake
(C, D, S, T, X, V) (Plate la) and
25,612 BRIOLE ET AL.' DEFORMATION OF THE CORINTH RIFT
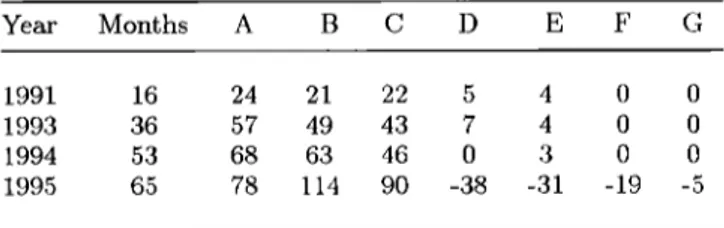
Table 2. Horizontal Displacements of Points A to G
as a Function of Time Year Months A B C D E F G 1991 16 24 21 22 5 4 0 0 1993 36 57 49 43 7 4 0 0 1994 53 68 63 46 0 3 0 0 1995 65 78 114 90 -38 -31 -19 -5
Displacements are in mm. The number of months refers to the date of the first campaign (May 1990).
culated ERS synthetic aperture radar (SAR) interfero-
grams for time intervals covering both earthquakes. We used the velocity field deduced from Figure 5 to cor- rect our measurements for the long-term motion and to properly extract the coseismic contribution. The dis- placements associated with the June 15, 1995, earth-
quake are relatively large (up to 10 cm) and above
the level of noise at more than 20 points. These data
were used together with SAR interferometry (InSAR)
and seismological data to constrain a dislocation model
[Bernard et al., 1997a]. Compared to the model pro- posed by Bernard et al. [1997a], the model presented here (Plate lb and Table 3) takes into account a few ad-
ditional GPS vectors, but there are no significant differ- ences in the parameters of both models. The displace- ments associated with the November 18, 1992, earth-
quake are small (5 20 mm). Plate la displays the co-
seismic data for the 1992 earthquake and a dislocation model assuming a north dipping plane located at the eastern end of the 1995 fault. A preliminary analysis
(based on displacements observed at points C, X, S, T, U, V) proposed that the 600 south dipping plane was the fault plane [Briole et al., 1993] but, further seimolog- ical analysis [Hatzfeld et al., 1996] indicated that a 300
north dipping plane, as for the 1995 Aigion earthquake
[Bernard el al., 1997a], is the lnost probable solution.
Also the InSAR data agree better with this interpreta- tion' the synthetic interferogram calculated assuming a
north dipping plane (Plate lc) exhibits no fringes in the
northern coast of the gulf, as it is the case in the data. In contrast., the synthetic interferogram calculated as-
suming the antithetic south dipping fault plane (Plate ld) exhibits two fringes above the northwestern edge of
the fault. In this case, to obtain a synthetic interfero- gram without fringes, it is necessary to shift the fault plane 3 km to the south, inducing a displacement at point S not compatible with the observations any more. There is no way of fitting both the GPS data and the InSAR data if one assumes a south dipping plane for the 1992 earthquake. The parameters of both the 1992 and 1995 dislocation models are given in Table 3 to- gether with the parameters of the other earthquakes of magnitude Ms >_ 5.5 that occurred since 1965. The co-
seismic contribution of all the earthquakes (except the
1965 event, which occurred before the first triangulation
measurement) has also been calculated and is discussed
in section 3.4.
3.3. Continuous Deformation on the
First-Order Network
Figure 7 displays the velocity vectors in the Corinth rift after removing the coseismic contributions of the
1992 Galaxidi and 1995 Aigion earthquakes. The val- ues are listed in Table A1 in the electronic supporting
material
1. To bring the coordinates
issued
from the pro-
cessing of each campaign into the same reference frame, we have considered the Peloponnisos as a fixed refer- ence. For the period 1990-1994, all Peloponnisos points except points X and T that were affected by the 1992 earthquake have been used to minimize the residual dis- placement vectors between epochs. For the comparison of the 1995 campaigns with the previous ones, points P, Q, R, D, E, F, U, and T close to the 1995 earthquake have been discarded and the Peloponnisos points used for minimization were K, L, G, and all points located
southeast of point X (see Figure 3). No long-term ve-
locity has been calculated for points S and T that are affected by both earthquakes. Figure 7 also displays the velocities obtained over 100 years by comparing re-
cent GPS coordinates with coordinates obtained from
triangulation fieldwork carried out in 1892 [Davies ½t
al., 1997], the velocities obtained by Kahl½ ½t al. [1995]
over the Ionian sea network and the velocities obtained
by Anzid½i et al. [1996] at CHLE point (west Pelopon- nisos). With respect to the deformation located in the
inner Gulf of Corinth, little internal deformation occurs in Peloponnisos, even along its northern coast. This result is consistent with the other geodetic studies car-
ried out at a broader scale [Billiris et al., 1991; Davies
et al., 1997; Clarke et al., 1998; Nahle et al., 1995; V½is ½t al., 1992], and its originality lies in the higher number of points that allows a better constraint on the width of the deforming zone. Most of the deformation
occurs offshore between the southern and the northern
coasts of the gulf. North of the Gulf of Corinth, the vectors are almost parallel to each other in the cen-
tral and western areas but rotate in the northeastern
region from N10øE to N30øW, so they remain almost
perpendicular to the tectonic structures there (Kapar- elli fault zone). In this area, deformation associated
with the progressive change of orientation of the ex- tension is probably occurring. However, the sampling
interval of only 2 years in the east (1993-1995) limits
1Supporting data Tables A1 and A2 are available on diskette or via Anonymous FTP from kosmos.agu.org, di-
rectory APEND (Username=anonymous, Password=guest).
Diskette may be ordered from American Geophysical Union, 2000 Florida Avenue, N.W., Washington, DC 20009 or by phone at 800-966-2481; 15.00. Payment must accompany
BRIOLE ET AL.: DEFORMATION OF THE CORINTH RIFT 25,613 38030 ' 38000 ' 38030 ' 38000 ' 1992 earthquake Data (20 mm) Model (20 ram) o l 22'00' 22030 ' 1995 earthquake Data (50 mm) c -- Model(50 mm) • •A G b ' 10km 22000 , 22030 '
•v
Model A Data (20 mm) c Model (20 mm) Model B Data (20 mm) c -• Model (20 mm) • D x•v
22000 , 22d30 ' 22000 ' 22030 ßPlate 1. (a) Observed and modeled coseismic displacements associated with the November 18,
1992, Galaxidi earthquake. Projection of the fault at the surface is shown with the slip vector. Parameters of the model are given in Table 3. Also plotted is the interferogram obtained using
the pair of images ERS1 5162 (July 11, 1992) and ERS1 10172 (June 26, 1993) with altitude of ambiguity of 603 m. Note that no fringes are visible. (b) Observed and modeled coseismic
displacements associated with the June 15, 1995, Aigion earthquake. Projection of the fault at the surface is shown with the slip vector. Parameters of the model are given in Table 3.
Also plotted is the interferogram obtained using the pair of images ERS1 6164 (September 19, 1992) and ERS1 22039 (October 2, 1995) with altitude of ambiguity of 972 m. Note that this interferogram is almost identical to that shown by Bernard et al. [1997a] that was calculated over a period of 4 months only. (c) Modeling of November 18, 1992, Galaxidi earthquake and
predicted interferogram for a 300 north dipping plane of length 14 km and width 9 km. No fringes
are predicted by this model (model A). (d) Model B corresponds to a 600 south dipping fault
plane of same area as model A and predicts two fringes on the northern coast.
25,614 BRIOLE ET AL.: DEFORMATION OF THE CORINTH RIFT
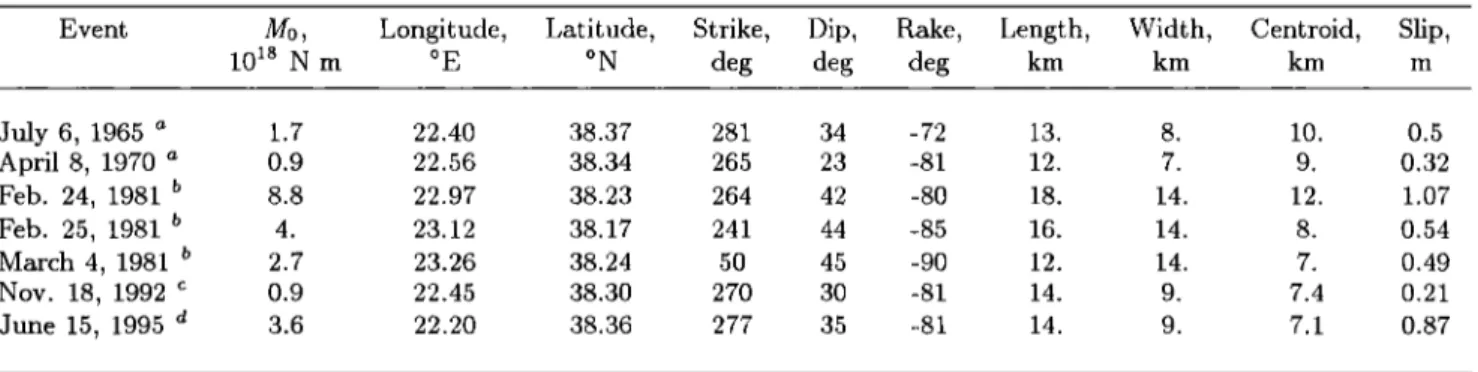
Table 3. Parameters of the Recent Earthquakes in the Gulf of Corinth
Event M0, Longitude, Latitude, Strike, Dip, Rake, Length, Width, Centroid, Slip,
1018 N in øE øN deg deg deg km km km in
July 6, 1965 a 1.7 22.40 38.37 281 34 -72 13. 8. 10. 0.5 April 8, 1970 a 0.9 22.56 38.34 265 23 -81 12. 7. 9. 0.32 Feb. 24, 1981 b 8.8 22.97 38.23 264 42 -80 18. 14. 12. 1.07 Feb. 25, 1981 b 4. 23.12 38.17 241 44 -85 16. 14. 8. 0.54 March 4, 1981 • 2.7 23.26 38.24 50 45 -90 12. 14. 7. 0.49 Nov. 18, 1992 c 0.9 22.45 38.30 270 30 -81 14. 9. 7.4 0.21 June 15, 1995 a 3.6 22.20 38.36 277 35 -81 14. 9. 7.1 0.87
The coordinates refer to the projection at the surface of the center of the upper edge of the fault.
• Baker et al. [1997]. b Taymaz et al. [1991].
CRevised from Hatzfeld et al. [1996] and Briole et al. [1993]. Both studies indicate that the surface of the ruptured plane is rather large for an earthquake of this magnitude. The seismic moment found by the waveform modeling is 0.4 x 10 ls N
m, the Harward centroid moment tensor (CMT) is 0.5 x 10 ls N in and the seismic moment deduced from the inversion of the geodetic data is 0.9 x 10 ls N m.
d Bernard et al. [1997a] modified to take into account a few additional GPS data. The seismic moment for this earthquake is deduced from the modeling of the GPS and SAR data. It is 5% higher than the seismic moment deduced from the
waveform modeling (3.4 x 10 ls N m) and 30% lower than the revised Harward CMT (5.1 x 10 ls N m).
39 ø 38 ø 21 ø 22 ø 23 ø
f/---•-%'•
•
39ø
N
' *
. •'•
DOXa < I 30 km "• . . 21 ø 22 ø 23 øFigure 7. Relative velocities of GPS points across the Corinth rift. The 1990-199,5 velocities
of 41 first-order points of the Corinth rift network are shown, with Peloponnisos fixed (obtained by minimization of the residual of the velocity vectors of all points located south of the gulf).
Points with star have been measured during three or more campaigns. The velocities obtained in
other studies are also plotted: 1989-1993 velocities on the Ionian sea network [Kahle et al., 1995],
of particular interest at points KRPN, Q, SNDO, and DOXA that complete our network to the
west; the thicker arrows are 1892-1992 velocity vectors [Davies et al., 1997] at four locations to the north of the gulf (one between points A and B, one between points CV and CN, and two north of CQ), one location in the east (east of CL), and three locations to the south of the gulf (one south of CK, one at CG, and one between K and L). There is, in general, a good agreement
between the determinations of the other groups and our velocity vectors, except at point Q, where
the result of Kahle et al. [1995] is not consistent with our determination and with the general
observation that the Peloponnisos has not internally deformed over the observed interval. At point CHLE the three vectors show three different determinations of the velocity of the points, with reference to Peloponnisos fixed, two determinations being from the above references, the
last one (thin arrow) given by Anzidei et al. [1996]. Profiles A-G and CS-CD used in the further
BRIOLE ET AL.' DEFORMATION OF THE CORINTH RIFT 25,615 10 A-G profile 1990 to 1995 GPS measurements Gulf 20 10 CF CS-CD profile 1991-1995 GPS measurements Gulf 0 20 40 60 80 0 20 40 60 80 100 Kilometers Kilometers
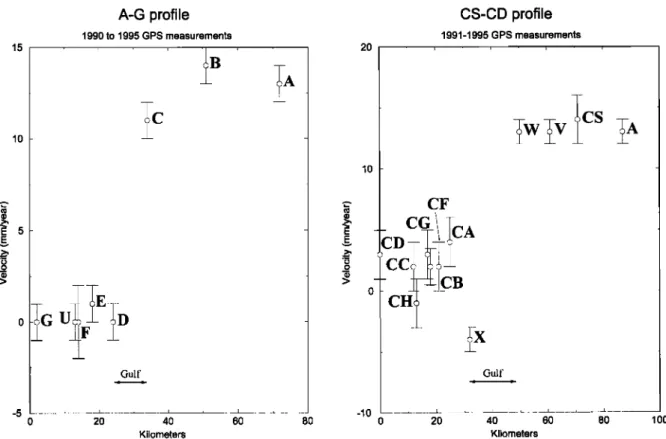
Figure 8. The 1990-1995 GPS velocity along profiles A-G and CS-CD (all points located closest than 12 km to the profile have been included) and error bars. The extension rate is 14 mm/yr along line A-G in a N9øE azimuth and 13 mm/yr along line CS-CD in a north azimuth.
the accuracy. Figure 8 shows the projection of the ve-
locity vectors plotted in Figure 7 along two lines (A-G and CS-CD) crossing the rift at two different locations,
and sampling two of the main structures discussed in
section 5, the Helike fault (line A-G) and the Derveni- Xilokastro fault (line CS-CD). These sections indicate extension rates and azimuths of 14 4- 2 mm/yr along line A-G in a N9øE direction and 13 + 3 mm/yr along
line CS-CD oriented N-S. These values of extension are
in relatively good agreement with the results of Clarke
et al. [1997] but are somewhat lower, in particular in
the western part of the gulf, where we do not measure
extensions higher than 15 mm/yr while Clarke et al. find values up to 20 mm/yr. The only areas where gra-
dients of deformation are observed on land are around
point C (northern side) and to the west of point C as mentioned by Bernard et al. [1997b] and Clarke et al.
[998]
ound points
J
N (southern
side). The
maximum width of the deforming area has thus an up-
per bound equal to the width of the gulf, that is 10 km
on the H-L line, 15 km on the A-G line, and 30 km on
the two eastern lines. Its lower bound seems to be of
the order of 10 km as suggested by the observed off- shore gradients of deformation. Figure 7 suggests that internal deformation is occurring in the eastern part of the northern block, in particular, in the area located
between CR, V (Antikira area), CQ, and CS. Inside
this area (Livadia-Arakhova) the orientation of the ve-
locity vector changes in a relatively narrow band from a N30øW to a N-N30øE direction. Figure 7 also indi- cates that the orientation of the velocity vector at CS is consistent with the orientation of the two velocity vec- tors computed for the time interval of 100 years on the two points located south of the Evvia Gulf. This result has to be confirmed by additional measurements over a longer period.
3.4. Continuous Deformation of the Second-Order Network
The second-order GPS network consists of pillars pre- viously measured by classical means during campaigns
carried out between 1966 and 1973. Because we did
not try to occupy remote points located on the highest mountains, most of these pillars are third- or fourth- order triangulation. The 1966-1973 coordinates of those points were computed as a single epoch network by forc- ing it to conform with the first- and second-order tri- angulation carried out in 1974. The average standard
error (lrr) for the positions of these third- and fourth-
order points were calculated to be of the order of 3
cm [l/•is et al., 1992]. For the entire country of Greece
the 25,000 coordinates calculated for this epoch of mea-
surement (early 1970 on average) constitute the "Greek Geodetic Reference System 1987" (GGRS-87) [Veis et
25,616 BRIOLE ET AL.: DEFORMATION OF THE CORINTH RIFT
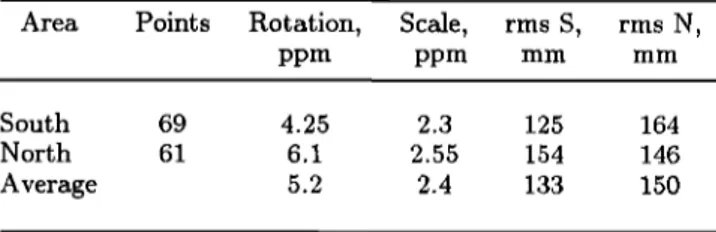
Table 4. Rotation and Scale Correction of the Trian-
gulation Data
Area Points Rotation, Scale, rms S, rms N,
ppm ppm mm mm
South 69 4.25 2.3 125 164
North 61 6.1 2.55 154 146
Average 5.2 2.4 133 150
Rotation and scale adjustment of the triangulation coor-
dinates to the GPS coordinates have been calculated assum- ing no internal deformation of both southern and northern block. The rms scatter between the two sets of coordinates is displayed after correction is applied. Two estimations have
been done: one with the northern side rigid (61 points), and one with the southern side rigid (69 points). Under both as-
sumptions, the rms have been calculated separately for both
sides of the gulf. Rigid north side assumption leads to rms
values slightly higher. Scale correction is almost the same
for both estimations: the difference of 0.25 ppm corresponds
to an error of 25 mm at a distance of 100 km, which is well
below the best residual rms (125 mm). The range of possible rotation parameters (1.85 ppm) leads to maximum changes of 185 mm at 100 km that is comparable with the residual error level. Assuming that the errors in the second epoch of observations (GPS) are negligible and provided that the
uncorrected tectonic motions have no reason to be corre-
lated with the measurement errors, 125 mm is a measure
of the maximum statistic error on the triangulation coordi- nates (including both measurement and processing errors).
Indeed, a detailed analysis of the residual vectors between close points in the southern block shows that the errors in
the triangulation coordinates are more likely to be of the order of 50 mm, that is, roughly consistent with the value of 20-30 mm given by Veis et al. [1992].
al., 1992]. They are given to an accuracy of a few cen- timeters plus one part in 106 , while the scale and ori-
entation are on average
within a few parts of l0 -? of
the internationally accepted reference system ITRF89
[Boucher
and Altamimi, 1989; Boucher
et al., 1993].
We measured a total of 159 triangulation pillars (Ta- ble A2, electronic), 17 belonging also to the first-orderG PS network. We were able to compare the coordi-
nates for 146 of them (in some cases, the comparison
indicated that the pillars had been displaced and in few
cases, the old coordinates were not available). We ne- glected the duration of each series of campaigns (7 years
for the first one that occurred between 1966 and 1973
and 4 years for the G PS campaigns) with respect to
the mean time interval of 24 years between the two se- ries of campaigns. This approximation is justified by the a priori size of the errors associated with the tri- angulation measurements and further validated by the
standard error deduced from our study (Table 4). We divided the pillars into four categories based on their location: 69 in the south of the gulf, 61 in the north, 14
in the east, and 2 in the west. The direct comparison
of the 1991-1995 GPS coordinates and the 1966-1973
coordinates is represented in Figure 9a. Point E, near
Aigion, is arbitrarily kept fixed for the comparison of the two sets of data, although any other point could have been kept fixed. The general trend of the raw dis- placement vectors in the northeast and in the southeast does not agree with the results of the GPS-GPS com-
parisons presented in section 3.3 (Figure 7) and indi-
cates that a correction for orientation and scale should
be applied for the old coordinates. On the basis of the precision of the old data, we limited the correction for
the old coordinates to a two-parameter correction (scale and orientation), an approximation further validated by
the results obtained on the corrected coordinates of pil-
lars. To find the best values for scale and orientation
correction, we minimized the displacement vectors of the 69 points located in Peloponnisos, according to the observation from the repeated GPS surveys that this block is not significantly deforming with respect to the inner gulf zone. The best fit was found with a coun- terclockwise rotation of 4.25 ppm and dilatation of 2.3 ppm. Those values of scale and rotation are somewhat higher than were predicted at the regional scale from
the adjustment of the triangulation data [Veis et al., 1992]. This suggests that there could be locally some
bias higher than the global average, due to nonhomoge-
nous networks (offshore areas) and problems of connec-
tions between networks measured during different field campaigns. Assuming the northern block of the Gulf of
Corinth to be rigid (61 points), the minimization leads
to values of +6.1 ppm for the rotation and +2.5 ppm for the scale. The most important fact is the similarity of the values found for the scale correction, the difference between the two determinations being below the value
of the errors on the determination itself. In Table 4 we summarize the values of the rms found on both sides
of the gulf for the above two sets of rotation and scale
factors and for an intermediate value. As the scatter between both solutions remains below the errors on the
pillar coordinates determination, in the following, we
adopt the values of +4.25 ppm and +2.3 ppm for the orientation and scale correction; these are the values that give the best fit for the 69 points located in Pelo- ponnisos. The amplitude of coseismic displacements es- timated over 24 years from the parameters in Table 3
(Figure 10) is much less than the extension measured
geodetically over the same period, except possibly in the Alkyonides area where a relatively large part of the de- formation could be explained by the 1981 earthquakes
[Rigo, 1994]. Figure 11 shows the projection of the vec-
tors plotted on Figure 9, along the lines A-G and CD-
CS (see Figure 7) used for projecting the GPS velocities
and along an additional line crossing the Thivai area at the eastern end of the gulf. The high rates found from th• comparison GPS triangulation are not compatible
with the GPS-GPS estimation of velocities in the Gulf
of Corinth. On lines A-G and CS-CD, the average over- estimation of the velocities is 80% with respect to the
GPS-GPS ones. This overestimation of the velocities across the Corinth rift could be due to errors in con-
BRIOLE ET AL.' DEFORMATION OF THE CORINTH RIFT 25,617
necting classical geodetic data from one to the other side of the gulf. Indeed, although the old coordinates are correctly scaled at the global scale, as indicated by
Veis et al. [1992], they could present distortions at the
intermediate scale due to the nonhomogeneity of the
network and to the fact that the third- and fourth-order
22 23 •9 39 30 'kin 250n•n
38
i•
• 38
a • 39 39Rotation
= 4.25
ppml
Scale
= 2.3
ppm
Southfixed
•
It
•)"-"1•" 2$0mm IL O• 250nun b o• 2$(hmnnetworks were measured during several field campaigns, implying possible problems of connection between each survey during the •djustment phase.
3.5. Summary of the Observations
The main results of the data analysis are as follows: 1. The extension rate measured over 5 years across the Corinth rift ranges between 15 and 10 mm/yr from west to east. The extension rate measured over 24 years by comparing GPS and triangulation coordinates over- estimates the above values by 50 to 80%, probably due to distortion in the triangulation data at the regional scale due to both spatial inhomogeneity of the data
(presence of the sea) and temporal inhomogeneity of the data (several field campaigns between 1966 and 1973).
2. Both data sets indicate that the southern side of
the gulf behaves like a rigid block. On the northern side, there is a regional east-west compression and lo- cal gradients of deformation at points located near the northern coast, west of point C.
3. In consequence, almost all the deformation is lo- calized offshore, within the inner part of the Corinth
rift. The deformation is particularly localized (,-•10 km width) in the western part of the rift (Aigion- Psathopirgos)o The localization is less well defined in the center of the rift (Derveni, Xilokastro), where the
gulf is wider. The deformation seems to be more dif-
fuse in the eastern part of the rift (Corinth, Thivai). The largest opening rate (14 mm/yr) is measured at
the longitude of Aigion, where the width of the deform- ing zone is apparently the lowest. The implications of such a localization are very important and are discussed
in section 4.
4. No movement is observed across the active faults
bordering the southern coast of the gulf like the Helike and the Xilokastro faults. These faults thus appear to
behave in a locked-seismic mode.
5. The extension direction (Peloponnisos assumed fixed) rot. at, o,• from about N9øE in the west to about
N20øW in the east of the rift, in relatively good agree- ment with the focal mechanisms of earthquakes and the
orientation of the active faults observed in the field.
Figure 9. (a) Comparison of the 1991-1995 GPS coor- dinates of 146 pillars of the Hellenic triangulation net-
work with their 1966-1972 coordinates obtained from
terrestrial measurements. First-order point E is used as common reference for comparison of the two epochs.
(b) Displacement of the 146 pillars after counter clock-
wise rotation of +4.25 ppm and dilatation of +2.3 ppm that minimizes the residuals on the 69 pillars located in the southern part of the gulf. The barycenter of the 69 pillars is used as common reference for comparison of
the two epochs (the sum of the displacement vectors of the 69 points equals 0). (c) Same displacement field as
in Figure 9b but with the barycenter of the 61 pillars located north of the gulf kept fixed.
25,618 BRIOLE ET AL.' DEFORMATION OF THE CORINTH RIFT
38 30'
38 00' -
37 30'
250
mm •,.• •
22 bO' 22 •0' 23 00' 23 •0'Figure 10. Modeled coseismic displacements associated with all earthquakes of magnitude >_ 5.5 that occurred within the network between 1966 and 1995. The parameters of the modeled faults are those of Table 3. The area where displacements could be observed given the accuracy of the
old measurements (50 to 125 ram) is limited. The amplitude of the predicted displacements is
much lower than that of the observed motions.
4. Deformation Modeling
In order to interpret our observations we construct a model based on th• simple assumption of deforma- tion in an elastic half-space. We make the hypothesis that the deformation is localized along active faults or in relatively narrow deforming zones for which a planar fault model is a good approximation to predict defor- mation in the near and far field. This hypothesis has
been discussed by Gilbert et al. [1994] in the case of
the San Andreas fault and is also supported by numer-
ical modeling of extending areas [Hassani and Chary, 1996]. The geometry of the faults that enter our model
is controlled by available tectonic and seismological in- formation. The study of uplifted marine terraces in the Xilokastro as well as the Derveni and Aigion areas
[Rigo, 1994; Armijo et al., 1996] gives estimates of slip
rates on the main faults bordering the southern coast
of the gulf. Armijo et al. [1996] estimated a long-term
slip rate on the Xilokastro fault of 11 + 3 mm/yr on a 500 dipping plane. On the other hand, the analysis
of the June 15, 1995, Aigion earthquake [Bernard et al., 1997a] pointed out the importance of the inner-rift
active low-dipping faults in the process of extension of the Corinth rift. The inner-rift activity is further cor- roborated by the smaller M•=5.9 Galaxidi earthquake
[Hatzfeld et al., 1996] that occurred on a •030 ø north
dipping fault. The 1965 and 1970 earthquakes that oc- curred close to the northern coast of the gulf with simi-
lar mechanisms as the Aigion and Galaxidi events (Fig-
ure 1) are also
good
candidates
for inner-rift
activity
on
a shallow north dipping plane, although no constraintsare available on the rupture plane for these events. In
addition, the observed deformation presented here oc- curs mostly offshore. As we will see below, this ob- servation cannot be explained with faults located only along the southern coast of the gulf. We thus impose
the geometry shown in Figure 12 where the two sys-
tems of faults (F5 for outer and F1 and F2 for inner rift) are assumed to join at depth at the brittle-ductile
transition zone represented as a gently north dipping
decollement surface (F3 and F4) as proposed by Rigo
et al. [1996]
and also supported
by the multiplet anal-
ysis of Rietbrock et al. [1996]. We assume that theextension
is driving creep
on this decollement
(F3) that
we model as continuous slip. F2 and F5 are assumed to be seismic faults, locked during the interseismic period and slipping during earthquakes. Characteristic earth- quakes for F2 and F5 are the M•:6.2 Aigion and the M•=6.6 Helike earthquakes, respectively. Either contin- uous or locked-seismic slipping modes can be assumed
for F1 and F4. At each fault junction (F1-F2 and F4- F5) the amplitude of horizontal motion is assumed to be
continuous. At the F2-F3-F4 triple junction the kine- matic compatibility for horizontal motion is assumed. These conditions allow us to calculate slip rates on each fault, given that v3, the slip rate on F3, is deduced di- rectly from the data and assuming a given partition- ing of the opening between the i_nner and the southern
BRIOLE ET AL.- DEFORMATION OF THE CORINTH RIFT 25,619 lOOO 500 500
1966-1972 to 1991-1995 displacements
A G pr6fil
e
lOOO 500 500 0 20 40 60 80 100CS-CD profile
0 50 100 150 KfimnetresFigure 11. Displacement
profiles
obtained
from the
triangulation
GPS comparison
along
profiles
A-G and
CS-CD over an average
period of 24 years. On A-G
the average
opening
between
the two sides
of the gulf is
600 mm, which
corresponds
to a rate of 25 mm/yr. On
CS-CD the average
opening
is 534 mm or 22 mm/yr.
faults. We use these slip rates to compute the defor- mation induced by the continuous slipping segments as well as the predicted seismic energy release and recur- rence time of earthquakes on the seismic faults. We also tested models where slip is continuous from F1 to F2 and from F4 to F5. This type of model did not yield significantly different results, and here we discuss only models based on the continuity of horizontal motion,
which seems more reMistic.
We first ran a series of tests to demonstrate the im-
possibility for fault F1 to behave in a locked-seismic mode. For this test we assume continuous slip on F3-
F4 only, for three variable depths of these faults (cor- responding to 8, 6, and 4 km for the ES-F4 junction).
The predicted rates of opening are compared to the ob- servations for profile A-G in Figure 13. None of the three models fits the highly localized observed opening zone, and the only way to localize this deformation is to
assume some continuous deformation at shallow level in
the uppercrust beneath the gulf. We choose to confine this continuous deformation to the upper 2.5 krn and to model it as continuous slip on Fl. This does not mean we believe F1 really slips continuously. Rather, we think that the uppermost few kilometers of the crust, which include thick sediments in the gulf, are deforming by creep. This has been suggested for the western United
States [King et al., 1994], partly on the basis of the ab-
sence of seismicity at shallow depths which we find here
also [Rigo et al., 1996; Bernard et al., 1997a]. Whether
this creep is localized on one fault as assumed here, or on a few faults, or is distributed in volume, cannot be
resolved from our data and thus is not relevant for the
modeling presented here.
4.1. Aigion Profile (Line A-G)
The opening rate deduced from the G PS data is 14 mm/yr. Unlike the Xilokastro fault farther east, no re-
10
l0
(km)
20
30
Figure 12. Five-fault model used in the modeling. Location of the five fault segments is dis- cussed in the text and is based on the observed active structures along the A-G profile. Each fault Fi has a slip rate vi.