Contribution to the modeling of industrial processes using Oriented Object Bayesian Networks
138
0
0
Texte intégral
(2) To my former supervisor Prof. Tamrabet Abdellah ( é<Ë@. éÔgP). To my parents To my family To all my friends.
(3) Acknowledgements First of all, my deepest gratitude goes to the almighty ALLAH, the beneficial, the merciful for granting me to materialize this research in the present form. In the memory of my former supervisor Prof. Tamrabet Abdellah, who started this thesis with me and unfortunately he was not able to finished it with me. I hope this will make him proud. I am very thankful to him since he guide me to the path of research. I would like to express my gratitude and respect to my supervisor Dr. Hacene Smadi, who had always been there as a mentor to guide me through all these years. I learned a lot from his vast experience and knowledge. I really appreciate his support. I am also thankful to my advisory committee members Pr. Mebarek Djebabra, Pr. Kamel Serairi, and Dr. Fares Innal for critical comments and constructive suggestions. I would like to thank Dr. Eduardo Patelli, who has invited me to his laboratory in the Institute for Risk and Uncertainty in Liverpool (UK) and support me when I was there. I would like to thank all the professors in the Occupational Health and Safety Institute in Batna 2 University. My deepest thanks goes to my family members; my father, my mother, sisters and brothers for their love and affection during all these years. Thanks to all my friends especially Amine, Khalil, Nadhir, and Abdelkader for their help and support not only in my research but also in my life..
(4) Contents List of Figures. iii. List of Tables. v. Abbreviations. vii. 1 OVERVIEW ON SAFETY AND RISK CONCEPTS 1.1. 1.2. 7. Definition of basic concepts . . . . . . . . . . . . . . . . . . . . . . . . . .. 7. 1.1.1. Risk and Hazard . . . . . . . . . . . . . . . . . . . . . . . . . . . .. 7. 1.1.2. Other concepts associated with risk . . . . . . . . . . . . . . . . . .. 7. Risk analysis, Risk evaluation, Risk assessment, and Risk management . . 11 1.2.1. Risk analysis . . . . . . . . . . . . . . . . . . . . . . . . . . . . . . 11. 1.2.2. Risk evaluation . . . . . . . . . . . . . . . . . . . . . . . . . . . . . 11. 1.2.3. Risk Assessment . . . . . . . . . . . . . . . . . . . . . . . . . . . . 11. 1.2.4. Risk management. . . . . . . . . . . . . . . . . . . . . . . . . . . . 12. 1.3. Development of Process Safety. . . . . . . . . . . . . . . . . . . . . . . . . 12. 1.4. Most catastrophic accidents in the last three decades . . . . . . . . . . . . . . . . . . . . . . . . . . . . . . . . . . . . . 14 1.4.1. The Ocean Ranger tragedy. . . . . . . . . . . . . . . . . . . . . . . 15. 1.4.2. The Bhopal disaster . . . . . . . . . . . . . . . . . . . . . . . . . . 16. 1.4.3. Sayano–Shushenskaya power station accident . . . . . . . . . . . . . 17. 1.4.4. Fukushima Daiichi nuclear disaster . . . . . . . . . . . . . . . . . . 17. 1.4.5. Deep-water Horizon (the Macondo blowout) . . . . . . . . . . . . . 18. 1.5. Accident process model . . . . . . . . . . . . . . . . . . . . . . . . . . . . . 19. 1.6. Safety and risk analysis techniques . . . . . . . . . . . . . . . . . . . . . . 22 1.6.1. Qualitative approaches . . . . . . . . . . . . . . . . . . . . . . . . . 22. 1.6.2. Quantitative approaches . . . . . . . . . . . . . . . . . . . . . . . . 24. i.
(5) CONTENTS 1.7. ii. Conclusion . . . . . . . . . . . . . . . . . . . . . . . . . . . . . . . . . . . . 30. 2 A REVIEW OF BAYESIAN BELIEF NETWORK USED IN PROCESS INDUSTRIES. 35. 2.1. Introduction . . . . . . . . . . . . . . . . . . . . . . . . . . . . . . . . . . . 35. 2.2. Bayesian Networks technique (BNs) . . . . . . . . . . . . . . . . . . . . . . 37. 2.3. Collect of Data . . . . . . . . . . . . . . . . . . . . . . . . . . . . . . . . . 38. 2.4. Overview on the application of BBN in risk analysis and accident modeling in chemical plants . . . . . . . . . . . . . . . . . . . . . . . . . . . . . . . . 39. 2.5. 2.6. 2.4.1. Dynamic Bayesian Networks . . . . . . . . . . . . . . . . . . . . . . 48. 2.4.2. Oriented Object Bayesian Networks . . . . . . . . . . . . . . . . . . 51. Risk Analysis of a Case Study Using Bayesian Belief Networks . . . . . . . 53 2.5.1. Description of the process . . . . . . . . . . . . . . . . . . . . . . . 53. 2.5.2. Application of the methodology . . . . . . . . . . . . . . . . . . . . 55. 2.5.3. Results and discussion . . . . . . . . . . . . . . . . . . . . . . . . . 59. Conclusion . . . . . . . . . . . . . . . . . . . . . . . . . . . . . . . . . . . . 60. 3 RELIABILITY AND SAFETY ANALYSIS USING FAULT TREE AND BAYESIAN NETWORKS. 72. 3.1. Introduction . . . . . . . . . . . . . . . . . . . . . . . . . . . . . . . . . . . 72. 3.2. Analysis Approach . . . . . . . . . . . . . . . . . . . . . . . . . . . . . . . 73. 3.3. 3.2.1. Fault Tree Analysis . . . . . . . . . . . . . . . . . . . . . . . . . . . 73. 3.2.2. Bayesian Network technique . . . . . . . . . . . . . . . . . . . . . . 74. 3.2.3. Mapping FT into BN . . . . . . . . . . . . . . . . . . . . . . . . . . 77. Safety Analysis of Steam Boiler System (SBS) . . . . . . . . . . . . . . . . 78 3.3.1. Description of the steam boiler system . . . . . . . . . . . . . . . . 78. 3.3.2. Fault tree analysis . . . . . . . . . . . . . . . . . . . . . . . . . . . 80. 3.3.3. Bayesian Network Analysis . . . . . . . . . . . . . . . . . . . . . . . 82. 3.3.4. Sequential learning . . . . . . . . . . . . . . . . . . . . . . . . . . . 88. 3.3.5. Conclusion . . . . . . . . . . . . . . . . . . . . . . . . . . . . . . . . 90. 4 RISK ASSESSMENT OF A LIQUEFIED NATURAL GAS PROCESS FACILITY USING BOW-TIE AND BAYESIAN NETWORKS. 94. 4.1. Introduction . . . . . . . . . . . . . . . . . . . . . . . . . . . . . . . . . . . 94. 4.2. Risk analysis methods . . . . . . . . . . . . . . . . . . . . . . . . . . . . . 96 4.2.1. Bow-tie technique (BT) . . . . . . . . . . . . . . . . . . . . . . . . 96.
(6) CONTENTS. iii. 4.2.2. Mapping Bow-Tie into Bayesian Networks . . . . . . . . . . . . . . 99. 4.3. Case study . . . . . . . . . . . . . . . . . . . . . . . . . . . . . . . . . . . . 100 4.3.1. Description of the process . . . . . . . . . . . . . . . . . . . . . . . 100. 4.3.2. Bow-Tie analysis . . . . . . . . . . . . . . . . . . . . . . . . . . . . 102. 4.3.3. Bayesian Networks Analysis . . . . . . . . . . . . . . . . . . . . . . 107. 4.4. Results and discussion . . . . . . . . . . . . . . . . . . . . . . . . . . . . . 108. 4.5. Conclusion . . . . . . . . . . . . . . . . . . . . . . . . . . . . . . . . . . . . 112. General Conclusion. 117. A Appendix. 121. A.1 Hugin history . . . . . . . . . . . . . . . . . . . . . . . . . . . . . . . . . . 121 A.2 AgenaRisk . . . . . . . . . . . . . . . . . . . . . . . . . . . . . . . . . . . . 121 A.2.1 Types of Modeling in AgenaRisk . . . . . . . . . . . . . . . . . . . 122 A.3 Importance of minimal cut-set (IM) . . . . . . . . . . . . . . . . . . . . . . 122 Abstract. 125.
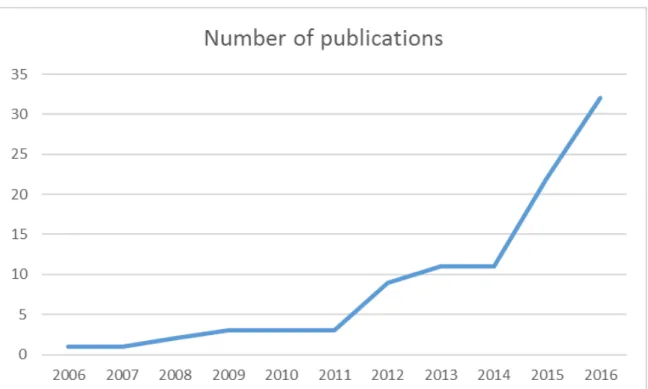
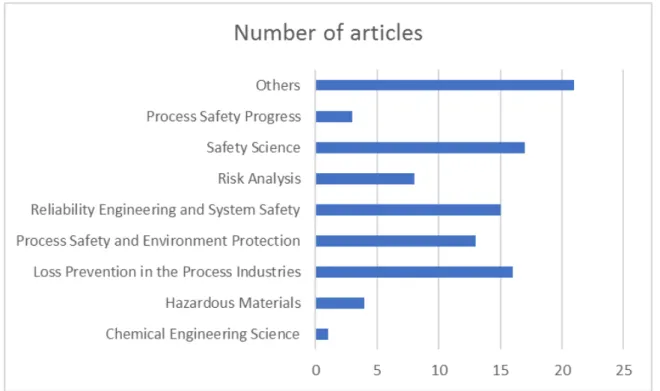
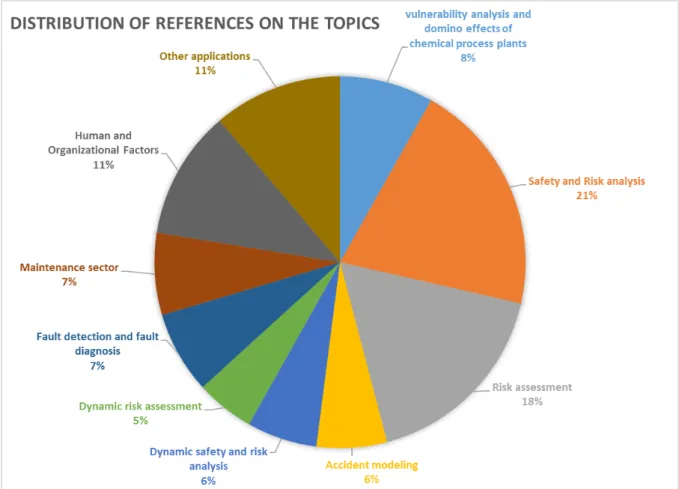
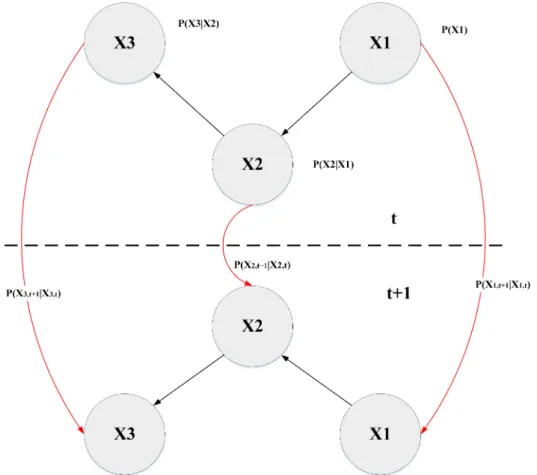
(7) List of Figures 1. World oil demand by main region 2014-2015 (source: Annual Report of OPEC 2015). . . . . . . . . . . . . . . . . . . . . . . . . . . . . . . . . . .. 2. 2. Steps followed to form the review. . . . . . . . . . . . . . . . . . . . . . . .. 4. 1.1. Risk analysis, evaluation, assessment, and management (Rausand 2011). . 12. 1.2. Accident trend analysis from 1988 to 2012 (Khan et al. 2015). . . . . . . . 13. 1.3. Developments in science and engineering relevant to process safety (De Rademaeker et al. 2014). . . . . . . . . . . . . . . . . . . . . . . . . . . . . 14. 1.4. Houston model of the accident process (Houston 1971). . . . . . . . . . . . 20. 1.5. Fault tree accident model (Khan & Abbasi 1999). . . . . . . . . . . . . . . 20. 1.6. MADS model (Bouloiz et al. 2010). . . . . . . . . . . . . . . . . . . . . . . 21. 1.7. Accident model that incorporate human, organizational, and external failure (Adedigba et al. 2016). . . . . . . . . . . . . . . . . . . . . . . . . . . . 21. 1.8. Event tree for LPG release (Ferdous et al. 2009). . . . . . . . . . . . . . . 26. 1.9. Bayesian network for the reduced car start problem . . . . . . . . . . . . . 27. 2.1. Example of BN model. . . . . . . . . . . . . . . . . . . . . . . . . . . . . . 38. 2.2. Time distribution of the publications of BBN used in the chemical plants in the last decade . . . . . . . . . . . . . . . . . . . . . . . . . . . . . . . . 40. 2.3. Journal distribution of the publications of BBN used in the chemical plants in the past ten years . . . . . . . . . . . . . . . . . . . . . . . . . . . . . . 41. 2.4. Distribution of references that used BN in the chemical plants and process industries (2006-2016). . . . . . . . . . . . . . . . . . . . . . . . . . . . . . 47. 2.5. An illustrative example of dynamic Bayesian network for three variables. . 49. 2.6. An ordinary BN in the left side is constructed using hierarchical structures with arbitrary levels of abstraction in the middle and then presented by instance nodes in the right. . . . . . . . . . . . . . . . . . . . . . . . . . . . 52. 2.7. Simplified Process Flow Diagram of the facilities . . . . . . . . . . . . . . . 55 iv.
(8) LIST OF FIGURES. v. 2.8. Event tree for the accident scenarios . . . . . . . . . . . . . . . . . . . . . 57. 2.9. Bayesian network model for the accident scenarios . . . . . . . . . . . . . . 59. 3.1. Example of BN model . . . . . . . . . . . . . . . . . . . . . . . . . . . . . 75. 3.2. Example of BN . . . . . . . . . . . . . . . . . . . . . . . . . . . . . . . . . 76. 3.3. Evidence B = b1 inserted in the BN . . . . . . . . . . . . . . . . . . . . . . 76. 3.4. The representation of AND-gate in FT and BN . . . . . . . . . . . . . . . 77. 3.5. The representation of OR-gate in FT and BN . . . . . . . . . . . . . . . . 78. 3.6. Steam Boiler Schematic (Innal et al. 2014) . . . . . . . . . . . . . . . . . . 79. 3.7. FT for the Steam Boiler System (Innal et al. 2014) . . . . . . . . . . . . . 81. 3.8. Example from Hugin software . . . . . . . . . . . . . . . . . . . . . . . . . 83. 3.9. BN for the Steam Boiler System . . . . . . . . . . . . . . . . . . . . . . . . 84. 3.10 Prior and posterior probabilities the basic events . . . . . . . . . . . . . . . 85 3.11 BN with an Alarm and operator . . . . . . . . . . . . . . . . . . . . . . . . 87 3.12 BN with CPTs . . . . . . . . . . . . . . . . . . . . . . . . . . . . . . . . . 88 3.13 Updated probabilities of the Basic event during 5 years of SBS function. . 90 4.1. Generic example of a bowtie from de Dianous and Fi´evez (2006). . . . . . . 97. 4.2. Example of bow-tie model (C; consequence, IE; intermediate event, BE; basic event, CE; critical event, E; event) . . . . . . . . . . . . . . . . . . . 99. 4.3. Mapping algorithm from BT into BN (Khakzad et al. 2013b) . . . . . . . . 100. 4.4. BN model for the BT example in Fig. 4.2 (C; consequence, IE; intermediate event, BE; basic event, CE; critical event, E; event). . . . . . . . . . . . . . 101. 4.5. Simplified LNG plant block diagram. . . . . . . . . . . . . . . . . . . . . . 102. 4.6. BT for the LNG release accident scenario. . . . . . . . . . . . . . . . . . . 106. 4.7. BN of the BT presented in Fig. 4.6. . . . . . . . . . . . . . . . . . . . . . . 107. 4.8. Prior and posterior probabilities of Safety Barriers. . . . . . . . . . . . . . 110. 4.9. BN considering the failure of RPB, DPB, and IPB and the success of HFB. 111. 4.10 OOBN for Major LNG release . . . . . . . . . . . . . . . . . . . . . . . . . 112 4.11 Collapsed form of the OOBN for Major LNG release . . . . . . . . . . . . 112 4.12 BN with discrete variables and continuous variables . . . . . . . . . . . . . 119.
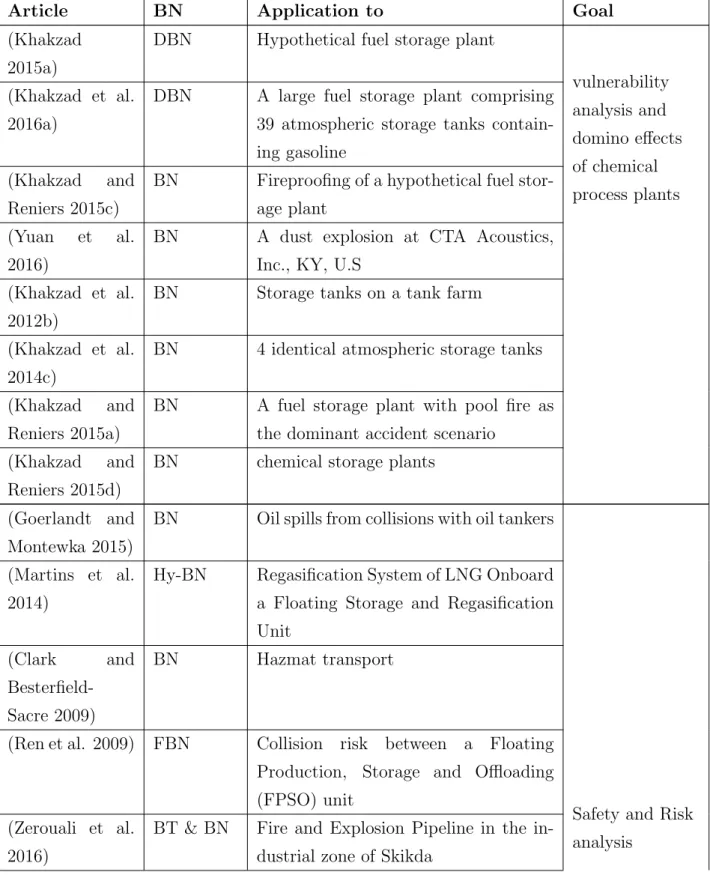
(9) List of Tables 1.1. Some definitions of risk and hazard . . . . . . . . . . . . . . . . . . . . . .. 1.2. Overview of some of the major accidents in worldwide operations, 1980-. 8. 2011 (updated from (Vinnem 2014)). . . . . . . . . . . . . . . . . . . . . . 15 1.3. Guide words and their physical significance (derives from (Khan and Abbasi 1998)) . . . . . . . . . . . . . . . . . . . . . . . . . . . . . . . . . . . . . . 23. 1.4. Unconditional probabilities for the parent nodes. . . . . . . . . . . . . . . . 28. 1.5. Conditional probabilities for the child nodes. . . . . . . . . . . . . . . . . . 28. 1.6. The joint probability table for P (Fu, FM, SP, St = no). . . . . . . . . . . 29. 1.7. The joint probability table for P (Fu, SP, St = no, FM =. 2.1. Different review of Chemical Plants and Bayesian Networks in reliability. 1 2. ). . . . . . . . 29. and safety analysis . . . . . . . . . . . . . . . . . . . . . . . . . . . . . . . 39 2.2. Literature of Bayesian Belief Network (BBN) method (2006-2016) used in chemical plants and process industries . . . . . . . . . . . . . . . . . . . . 42. 2.3. Extracted HAZOP of the accident scenarios related to the process . . . . . 56. 2.4. CPT of the pressure relief valve HXC102 . . . . . . . . . . . . . . . . . . . 58. 2.5. Different components related to the accident scenarios in the process and their occurrence probabilities. . . . . . . . . . . . . . . . . . . . . . . . . . 58. 2.6. Frequencies of the consequences. . . . . . . . . . . . . . . . . . . . . . . . . 59. 3.1. Unconditional probability table of variable A . . . . . . . . . . . . . . . . . 76. 3.2. Conditional probability table of variable B . . . . . . . . . . . . . . . . . . 76. 3.3. Conditional probability table corresponding to AND-gate . . . . . . . . . . 77. 3.4. My caption . . . . . . . . . . . . . . . . . . . . . . . . . . . . . . . . . . . 78. 3.5. Different events related to an accident scenario in the steam boiler system and their occurrence probabilities. . . . . . . . . . . . . . . . . . . . . . . . 80. vi.
(10) LIST OF TABLES 3.6. vii. Events probabilities and improvement factors and improvement index for FT analysis . . . . . . . . . . . . . . . . . . . . . . . . . . . . . . . . . . . 82. 3.7. Minimal cut sets and their importance . . . . . . . . . . . . . . . . . . . . 82. 3.8. Events probabilities and improvement factors and improvement index for BN analysis . . . . . . . . . . . . . . . . . . . . . . . . . . . . . . . . . . . 86. 3.9. Different modeling steps in Bayesian Networks analysis . . . . . . . . . . . 87. 3.10 CPT of Alarm. . . . . . . . . . . . . . . . . . . . . . . . . . . . . . . . . . 88. 3.11 Accident occurrence during 5 years of SBS function. . . . . . . . . . . . . . 89 4.1. A review of bowtie method and its classification according to Ruijter (2015). 98. 4.2. Different components and events related to LNG release and their occurrence probabilities . . . . . . . . . . . . . . . . . . . . . . . . . . . . . . . . 104. 4.3. Failure probability of the safety barriers. . . . . . . . . . . . . . . . . . . . 105. 4.4. Consequences of the Major LNG release accident scenario. . . . . . . . . . 105. 4.5. Accident analysis results from both BT and BN techniques.. 4.6. Diagnostic analysis of the basic events . . . . . . . . . . . . . . . . . . . . 109. 4.7. Diagnostic analysis of the consequences. . . . . . . . . . . . . . . . . . . . 109. 4.8. Diagnostic analysis of Safety barriers. . . . . . . . . . . . . . . . . . . . . . 110. . . . . . . . . 106.
(11) Abbreviations BNs. Bayesian networks. BOP. Blowout Preventer. BT. Bow Tie Analysis. CE. Critical Event. CPT. Conditional Probability Table. DAG. Directed Acyclic Graph. DAP. Detergent Alkylate Plant. DBN. Dynamic Bayesian Network. DOOBN. Dynamic Object Oriented Bayesian Networks. DTBN. Discrete Time Bayesian Network. eBN. Enhanced Bayesian Network. ET. Event tree. FBBN. Fuzzy Bayesian Belief Network. FMEA. Failure Mode Effect Analysis. FRAM. Functional Resonance Analysis Method. FTA. Fault Tree Analysis. HAZOP. Hazard and Operability. HBLF. Hierarchical Bayesian Loss Function. Hi-BN. Hierarchical Bayesian Network. Hy-BN. Hybrid Bayesian Network. IE. Initiating Event. IEC. International Electrotechnical Commission. ISM. Interpretive Structural Modeling. ISO. International Organization for Standardization. LNG. Liquefied Natural Gas. LOPA. Layer Of Protection Analysis. LPG. Liquefied Petroleum Gas viii.
(12) Abbreviations. ix. MCS. Minimal Cut Sets. MPE. Most Probable Explanation. MTBF. Mean Time Between Failures. MTTR. Mean Time To Repair. OECD. Organization for Economic Co-operation and Development. OOBN. Object Oriented Bayesian Networks. OPEC. Organization of the Petroleum Exporting Countries. P&ID. Process and Instrument Drawing. PFD. Process flow diagram. PFT. Pseudo-Fault Tree. QRA. Quantitative Risk Analysis. SIS. safety instrumented system. TE. Top Event.
(13) General Introduction The big development of nowadays industries leads to rises of new risks that if not handled could cause damage to human life, properties, and the environment. The aforementioned development is a two-edged sword, since it facilitates and provide the goods and services for the individual daily life requirements; on the other hand, it can cause catastrophic accidents with enormous losses. One of the most important industries is the chemical and process plants. These plants are classified as the key role in today’s hightech world since it gathers all the discipline (Mechanical engineering, civil engineering and safety engineering) and deals with high pressure/temperature products. Chemical and process industries cover different kind of manufactory such as food industry, detergents industry, and oil and gas industry, which is the subject of our attention. Figure 1 represent the world demand of oil in 2014/2015 and it is obviously notable the huge need of oil from developed and non-developed countries. Algeria is the fifth largest supplier of the gas to Europe and the tenth to the World; also, it is the seventeenth largest supplier of oil to the World (2016). Moreover, the income of the economy in Algeria depends on 98 % of the oil and gas. Knowing these facts, it is necessary to guaranty the well function and the safety of these plants.. 1.
(14) GENERAL INTRODUCTION. 2. Figure 1: World oil demand by main region 2014-2015 (source: Annual Report of OPEC 2015). As a result of the rapid growth of industrialization, particularly chemical plants and process industries, the risk posed by different accidents starts to rise highly. The main problems in these industries that they deal with different products, generally dangerous products (i.e. toxic, flammable, and explosive), and at a high level of pressure and temperature. One of the most dangerous sector in these plants is the petrochemical industry (oil and gas product). Even accidents in such industry have a low frequency occurrence; the consequences are catastrophic and caused enormous losses. We still remember the accident occurred in Skikda, Algeria, on 19 January 2004. A very strong explosion occurred at 18:40 at the LNG Liquefaction Complex GL1/K in Skikda, followed by a fire. Three of the six liquefying units in the Complex were severely damaged, and subjected to intense fire. The losses are very high, 23 deaths and 74 injured, without talking about economic losses and environmental pollution. The need for techniques and methods to analyze the faced risks and to guarantee the required safety within these plants is necessary. The safety engineers along with a group of expert including mechanical engineers, instrumentation engineer and others usually makes this analysis. In the last few decades, several techniques and methods have been proposed and developed for decision-making in safety and risk analysis. Those methods are classified in two main family; Qualitative and Quantitative methods. The qualitative techniques includes method such as Hazard and Operability (HAZOP) analysis, Failure Mode Effect Analysis (FMEA), and What-if analysis. The quantitative ones includes Event tree (ET), Fault Tree (FT), and Bow-Tie Analysis (BT). However, these last methods suffer from some limitations particularly when new information become available about the system studied or when we need to represent the dependencies between different events in the.
(15) GENERAL INTRODUCTION. 3. model. In the last three decades, researchers used Bayesian networks (BNs) to overcome the aforementioned limitations in the previous methods. The results from the coupled methodology between BNs and the other methods present a robust tool for decision making in safety and risk analysis. Nima Khakzad et al. (Khakzad et al. 2011) compared FT and BN for safety analysis in process facilities. The same authors mapped bow-tie into Bayesian network for dynamic safety analysis of process systems (Khakzad et al. 2013). The last work followed by dozens of publications based on the same principle (Abimbola et al. 2014) (Abimbola et al. 2015) (Zerouali et al. 2016) (Zarei et al. 2017). BNs have proven their efficiency to conduct a safety and risk analysis for complex systems and present a good solution to overcome the limitations in the conventional methods. The main objectives of this thesis can be summarized in the following points: • Present a well review on application of Bayesian network in the chemical plants and process industry within the last decade (2006-2016) and present a simple application of Bayesian network in a gas facility; • Briefly discuss the advantages of Bayesian networks to conduct a safety and risk analysis over the well-known methods Fault tree, Event tree, and Bow-tie; • Use Bayesian network in the process of risk assessment with an application of Oriented Object Bayesian Network to make the model more tractable and readable in an LNG facility.. Thesis organization This thesis is organized as follows: In chapter 1, we will give an entrance about some aspects that are widely used in the safety-engineering domain. In addition, the Development of Process Safety concept is discussed. An accident trend analysis and some recent accidents are investigated. Furthermore, some techniques for safety and risk analysis of process industries are examined. A brief statistical review of the use of Bayesian networks in the chemical and process industry within the last decade is presented in chapter 2. The review reveals that Bayesian Networks have been used extensively in various forms of safety and risk assessment. This trend is attributable to the complexity of the installations found in this industry and the ability of Bayesian Belief Network ”BBN” to intuitively represent these complexities,.
(16) GENERAL INTRODUCTION. 4. handle uncertainties, and update event probabilities. Figure 2 shows the steps followed to build this review and summarizes the important highlights. The chapter is concluded with an illustrative example of the use of BBN to investigate the effectiveness of the safety barriers of a gas facility.. Figure 2: Steps followed to form the review. Chapter 3 discusses the advantages of Bayesian networks over Fault tree in reliability and safety analysis. In addition, it shows the ability of BN to update probabilities, represent multi-state variables, and dependent failures. Moreover, we will apply probability updating to dynamically update probabilities of the system’s components. An example taken from the literature is used to illustrate the application and compare the results of both Fault Tree and Bayesian Networks techniques. Finally, we will used the sequential learning or probability adapting to predict the behaviour of the components in the system during a time interval where the accident occurs several times. Risk assessment methodology to identify, analyze, and evaluate the risk associated with different consequences of a Liquefied Natural Gas (LNG) process facility from west Algeria is presented in chapter 4. Firstly, the Bow-tie analysis (BT) is used to identify the possible causes of hazardous events and specify the dangerous outcomes consequences resulting from the failure of the safety barriers. Moreover, the bow-tie is mapped into Bayesian networks (BN) to overcome some limitation of dependencies and updating in the.
(17) GENERAL INTRODUCTION. 5. events. Secondly, diagnosis analysis is used to spicify the dangerous consequences , which is the objective of risk evaluation. Finally, the risk-reducing measures implemented in the process are exanimated using Bayesian networks. This latter used diagnostic (posterior) and predictive (prior) analysis to calculate the probabilities of the components and predict the occurrence frequency of the consequences. In addition to the aforementioned steps, we will construct an object-oriented Bayesian network ”OOBN” based on the previous model. The constructed OOBN summarize and abstract the previous model.. Scientific Contributions Journal papers Zerrouki H, Smadi H (2017) Bayesian Belief Network Used in the Chemical and Process Industry: A Review and Application. J Fail Anal Prev 17:159–165. Zerrouki H, Smadi H (2017) Reliability and safety analysis using Fault Tree and Bayesian Networks. Int J Comput Aided Eng Technol x:1–14.. International Conference Papers H. Zerrouki and A. Tamrabet, “Mapping Fault Tree into Bayesian Network in safety analysis of process system”, 4th International Conference on Electrical Engineering (ICEE), Boumerdes (Algeria), 2015. H. Zerrouki and A. Tamrabet, “Fault tree and Bayesian Network in safety analysis: Comparative study”, International Conference on Applied Automation and Industrial Diagnostics (ICAAID), Djelfa (Algeria), 2015. H. Zerrouki and H. Smadi, “Safety and Risk Analysis in Oil and Gas Industry Using Bayesian Networks”, International Conference on Bayesian Networks and Applications, Sousse (Tunisia), October 14th-16th, 2016. H. Zerrouki and H. Smadi, “Fault diagnosis of a Hydrotreater Reactor by using Fault Tree and Bayesian Network” 6th International Conference on Systems and Control, Batna (Algeria), 2017. H. Zerrouki and H. Smadi, “Risk management of a Liquefied Natural Gas process facility using Bow tie and Bayesian Networks” accepted for oral presentation in the European Safety and Reliability Conference ESREL, Slovenia, 2017..
(18) GENERAL INTRODUCTION. 6. References Abimbola M, Khan F, Khakzad N (2014) Dynamic safety risk analysis of offshore drilling. J Loss Prev Process Ind 30:74–85. doi: 10.1016/j.jlp.2014.05.002 Abimbola M, Khan F, Khakzad N, Butt S (2015) Safety and risk analysis of managed pressure drilling operation using Bayesian network. Saf Sci 76:133–144. doi: 10.1016/j.ssci.2015.01.010 Khakzad N, Khan F, Amyotte P (2011) Safety analysis in process facilities: Comparison of fault tree and Bayesian network approaches. Reliab Eng Syst Saf 96:925–932. doi: 10.1016/j.ress.2011.03.012 Khakzad N, Khan F, Amyotte P (2013) Dynamic safety analysis of process systems by mapping bow-tie into Bayesian network. Process Saf Environ Prot 91:46–53. doi: 10.1016/j.psep.2012.01.005 Zarei E, Azadeh A, Khakzad N, Aliabadi MM, Mohammadfam I (2017) Dynamic safety assessment of natural gas stations using Bayesian network. J Hazard Mater 321:830– 840. doi: 10.1016/j.jhazmat.2016.09.074 Zerouali B, Kara M, Hamaidi B (2016) Bayesian Network and Bow Tie to Analyze the Risk of Fire and Explosion of Pipelines. Process Saf Prog 25:326–330. doi: 10.1002/prs.
(19) Chapter 1 OVERVIEW ON SAFETY AND RISK CONCEPTS 1.1. Definition of basic concepts. In the following, we will try to present a glance about the required concept to go throughout with the rest of chapters. Some of them are axioms, and others are subject to debate. Most of the definitions are quoted from well-known standards and references.. 1.1.1. Risk and Hazard. Many definitions of Risk and Hazard can be found in the literature, in Table 1.1, we will summarize some of these definitions:. 1.1.2. Other concepts associated with risk. • incident An incident can be defined as an ‘Event that gave rise to an accident or had the potential to lead to an accident’(British Standards Institution 2007) or ‘An unplanned and unforeseen event that may or may not result in harm to one or more assets’(Rausand 2011). • Accident An accident is defined in OHSAS 18001 (British Standards Institution 2007) as an ‘Undesired event giving rise to death, ill health, injury damage or loss’. According. 7.
(20) CHAPTER 1. OVERVIEW ON SAFETY AND RISK CONCEPTS. 8. Table 1.1: Some definitions of risk and hazard Term. Definition. Reference. combination of the likelihood of an occurrence. Risk. of a hazard event or exposure and the severity. (British Standards. of injury or ill health that may be caused by. Institution 2007). the event or exposure a combination of hazard and probability. (Khan and Abbasi. of hazard occurrence. 1998). the combined answer to three questions: (1) What can go wrong? (2) What is the likelihood of that happening? and. (Rausand 2011). (3) What are the consequences? Chemical risk. a consequence of the presence of hazards source, situation or act with a potential for harm in terms of human injury or ill health,. Hazard. or a combination of these. the degree of harm to human beings, property, society or environment. (Reniers 2010) (British Standards Institution 2007) (Khan and Abbasi 1998). any real or potential condition that can cause injury, illness, or death to personnel; damage. (MIL-STD-882D. to or loss of a system, equipment or property;. 2000). or damage to the environment. a source of danger that may cause harm to an asset. Chemical hazard. a set of circumstances that may result in harmful consequences. (Rausand 2011) (Reniers 2010).
(21) CHAPTER 1. OVERVIEW ON SAFETY AND RISK CONCEPTS. 9. to (Rausand 2011) an accident is ‘A sudden, unwanted, and unplanned event or event sequence that leads to harm to people, the environment, or other assets’. • Safety Freedom from those conditions that can cause death, injury, occupational illness, damage to or loss of equipment or property, or damage to the environment (MILSTD-882D 2000). • Hazardous material Any substance that, due to its chemical, physical, or biological nature, causes safety, public health, or environmental concerns that would require an elevated level of effort to manage (MIL-STD-882D 2000). • Domino effect The propagation of a primary accidental event to nearby units, causing their damage and further secondary accidental events resulting in an overall scenario more severe than the primary event that triggered the escalation (Antonioni et al. 2009). • Fault A fault is an abnormal condition that may cause a deterioration or loss in the capability of a unit to perform a required function (Isermann 2006). • Fault detection and fault diagnosis These techniques are usually used to detect, evaluate and determine the location and the time of detection of the most possible fault (Isermann 2006). • Reliability This concept is defined by (ISO 1994) as “the ability of item (component, subsystem, or system) to perform a required function, under given environmental and operational conditions and for a stated period of time”. • Quality Defined by (ISO 1994) as “the totality of features and characteristics of a product or service that bear on its ability to satisfy stated or implied needs”. • Availability.
(22) CHAPTER 1. OVERVIEW ON SAFETY AND RISK CONCEPTS. 10. “The ability of item to perform its required function at a stated instant of time or over a stated period of time” (BS 1979). The availability at time t is. A(t)=Pr(item is functioning at time t). (1.1). The average availability Aav is. Aav =. M T BF M T BF + M T T R. (1.2). Where: MTBF (Mean Time Between Failures) is the mean time that the item is functioning, and MTTR (Mean Time To Repair) is the mean downtime after a failure. • System safety The application of engineering and management principles, criteria, and techniques to achieve acceptable mishap risk, within the constraints of operational effectiveness and suitability, time, and cost, throughout all phases of the system life cycle (MILSTD-882D 2000). • System safety engineering An engineering discipline that employs specialized professional knowledge and skills in applying scientific and engineering principles, criteria, and techniques to identify and eliminate hazards, in order to reduce the associated mishap risk (MIL-STD882D 2000). • Risk acceptance criteria Risk acceptance criteria is defined by (Norway 2010) as ‘criteria that are used to express a risk level that is considered as the upper limit for the activity in question to be tolerable’. • Safety risk This aspect is defined by (Arendt & Lorenzo 2000) as ‘a measure of human injury, environmental damage, or economic loss in terms of both the incident likelihood and the magnitude of the loss or injury’..
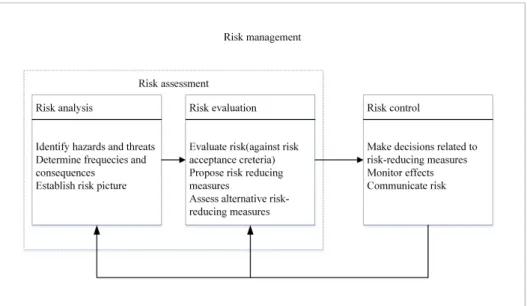
(23) CHAPTER 1. OVERVIEW ON SAFETY AND RISK CONCEPTS. 11. • Security risk Security risk is “the likelihood that a defined threat exploit a specific vulnerability of a particular attractive target or combination of targets to cause a given set of consequences” (American Institute of Chemical Engineers (Miner 2002)).. 1.2. Risk analysis, Risk evaluation, Risk assessment, and Risk management. 1.2.1. Risk analysis. Risk analysis can be defined as a systematic use of available information to identify hazards and to estimate the risk to individuals, property, and the environment (IEC 1995). This proactive approach consist mainly on three steps as shows Figure 1.1. In the first step, the hazards, the threats, and the potential hazardous events are identified. Then, the possible causes of each hazardous events are identified together with the probability (frequency) using experience data and/or expert judgments; this step is classified as a deductive analysis. Finally, the outcomes and their probability of occurrence, induced by a sequence of hazardous events are identified in the consequence analysis (inductive analysis) (Rausand 2011).. 1.2.2. Risk evaluation. In this approach, analyst usually compare the results from the risk analysis and the risk acceptance criteria to define the most dangerous consequence (the one that exceed the risk acceptance criteria are considered the dangerous one). Risk evaluation is defined by (IEC 1995) as the ‘Process in which judgments are made on the tolerability of the risk on the basis of a risk analysis and taking into account factors such as socioeconomic and environmental aspects’.. 1.2.3. Risk Assessment. The combination of the two aforementioned approach (i.e. risk analysis and risk evaluation) is the risk assessment. The latter is defined as ‘Overall process of risk analysis and risk evaluation’ (IEC 1995)..
(24) CHAPTER 1. OVERVIEW ON SAFETY AND RISK CONCEPTS. 1.2.4. 12. Risk management. A continuous management process with the objective to identify, analyze, and assess potential hazards in a system or related to an activity, and to identify and introduce risk control measures to eliminate or reduce potential harms to people, the environment, or other assets (Rausand 2011). Figure 1.1 summarize the three aforementioned approaches (risk analysis, risk evaluation, and risk management) and their main steps.. Figure 1.1: Risk analysis, evaluation, assessment, and management (Rausand 2011).. 1.3. Development of Process Safety. The increasing demand on energy, food and chemical products (e.g. detergents and paints) caused by the social and technological development leads to the complexity of processing plants. This complexity rises the probability of new hazard that threat the neighborhoods of these plants. The hazard in such plants needs to be prevented and mitigated since it can cause catastrophic accidents. Researchers and industrial practitioners develop many methods for safety, risk and reliability analysis trying to avoid the appearance of accidents. Unfortunately, it seems that accidents still occur and the developed methods succeed only to decrease the number and severity of accidents but not to avoid it definitely. Faisal Khan and his collaborators (Khan et al. 2015) reviewed past process accidents that occurred during the last two decades using open-source database such as the United States Chemical Safety Board. The results from the database used are shown in Figure 1.2. It can be noted that the accident occurrences and their consequences show.
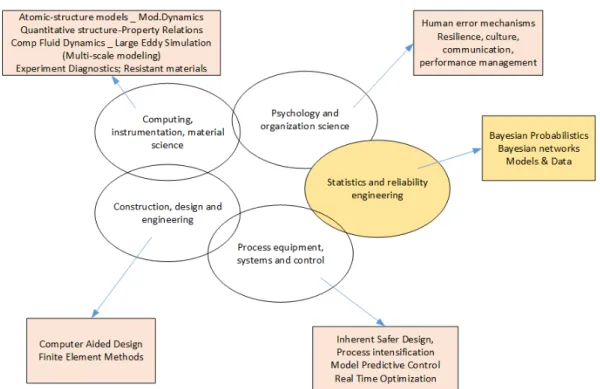
(25) CHAPTER 1. OVERVIEW ON SAFETY AND RISK CONCEPTS. 13. a non-uniform fluctuation which can be explained by the uncertainty and unpredictable behaviour of accidents and their consequences (Khan et al. 2015). Obviously, a robust process safety and risk management is needed to better understand the mechanism of accidents and implement safety barriers to prevent and mitigate their severity. Process safety and risk management consist of different area such as hazard identification, risk assessment and management, accident modeling, and inherent safety. These entire aspects share common goal, which is reducing the risks to a tolerable level. To this end, researchers from different disciplines (particularly science and engineering) tried to develop methods to reach the process safety. Figure 1.3 shows the development in the disciplines relevant to the process safety; in our work we will focus more on Statistics and reliability engineering using Bayesian networks (yellow oval and yellow rectangle) and the intersection between statistics and reliability engineering and process equipment system and control.. Figure 1.2: Accident trend analysis from 1988 to 2012 (Khan et al. 2015)..
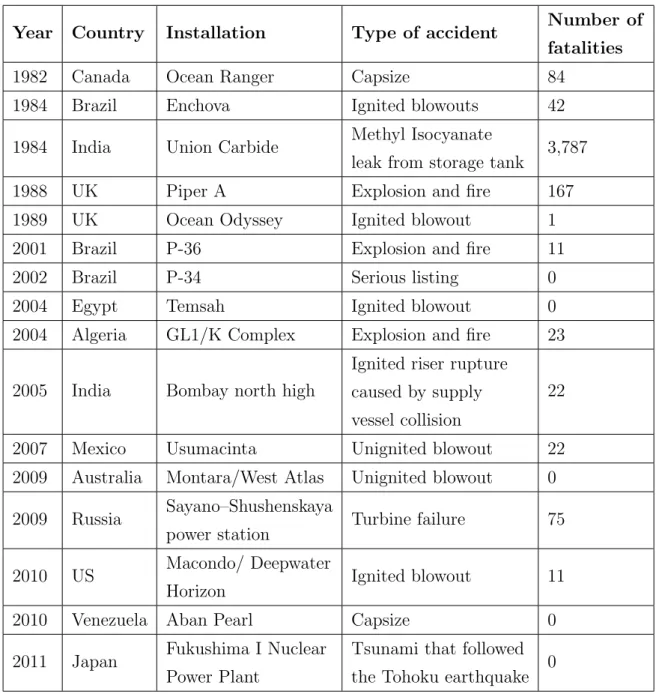
(26) CHAPTER 1. OVERVIEW ON SAFETY AND RISK CONCEPTS. 14. Figure 1.3: Developments in science and engineering relevant to process safety (De Rademaeker et al. 2014).. 1.4. Most catastrophic accidents in the last three decades. Event with the great effort to ensure the safety in the process industry by developing safety measure and enact legislations, accidents still occur. Table 1.2 reviews some of the most catastrophic accidents from 1980 until 2011. In the following, we have chosen few famous accidents that caused valuable losses in human life and economy in the last three decades and describe the cascading event lead to the accident..
(27) CHAPTER 1. OVERVIEW ON SAFETY AND RISK CONCEPTS. 15. Table 1.2: Overview of some of the major accidents in worldwide operations, 1980-2011 (updated from (Vinnem 2014)). Number of. Year. Country. Installation. Type of accident. 1982. Canada. Ocean Ranger. Capsize. 84. 1984. Brazil. Enchova. Ignited blowouts. 42. 1984. India. Union Carbide. 1988. UK. Piper A. Explosion and fire. 167. 1989. UK. Ocean Odyssey. Ignited blowout. 1. 2001. Brazil. P-36. Explosion and fire. 11. 2002. Brazil. P-34. Serious listing. 0. 2004. Egypt. Temsah. Ignited blowout. 0. 2004. Algeria. GL1/K Complex. Explosion and fire. 23. Methyl Isocyanate leak from storage tank. fatalities. 3,787. Ignited riser rupture 2005. India. Bombay north high. caused by supply. 22. vessel collision 2007. Mexico. Usumacinta. Unignited blowout. 22. 2009. Australia. Montara/West Atlas. Unignited blowout. 0. 2009. Russia. Turbine failure. 75. 2010. US. Ignited blowout. 11. 2010. Venezuela. Aban Pearl. Capsize. 0. 2011. Japan. Fukushima I Nuclear. Tsunami that followed. Power Plant. the Tohoku earthquake. 1.4.1. Sayano–Shushenskaya power station Macondo/ Deepwater Horizon. 0. The Ocean Ranger tragedy. Location: Newfoundland and Labrador, Canada. Time: 15 February 1982. Losses: 84 workers died. Description of the accident: The rig in Ocean Ranger designed and built by Offshore Drilling and Exploration.
(28) CHAPTER 1. OVERVIEW ON SAFETY AND RISK CONCEPTS. 16. Company (ODECO) in 1976. It was a self-propelled, semi-submersible offshore drilling rig with the following characteristics: 121 meters long, 80 meters wide, and 103 meters tall. It was a large rig that is need around 80- 100 workers to control and for the drilling operations. The signs of the accident start when the crew of the rig received a weather report stating that a strong winter storm is coming to their location a day before the accident (Sunday 24 February 1982). The Ranger stopped the drilling operations for the safety of the crew and the installations and prepared for the storm to pass. Later, nearby support vessels start to overheard radio chatter that some problems appeared including broken glass and failures in switches and valves (operating by themselves). Two hours after, The Ranger confirmed in the radio that everything is fine and there are no serious problems. Nevertheless, on Monday morning (1:00 am), the Ranger contacted the supply vessel to move in closer to the rig. A half hour later, the crew start to head to lifeboat stations, this was the last message received from the Ranger crew. Two rigs was nearby from the Ranger, they send their standby vessels, the supply vessel “Seaforth Highlander” also headed towards the rig. The storm’s violence makes it very difficult to make headway or searching for survivors. What a tragedy, not a single man survived. Days after the accident, 22 bodies were recovered from the water; they all died of drowning and hypothermia. Almost a month later, the investigation about the causes of the disaster began. The Royal Commission, which is the responsible of this investigation, found that several causes contributing the accident including; design flaws in the rig, inadequate lifesaving equipment, and the most important lacked training of the crew in the case of an emergency (Collier 2010).. 1.4.2. The Bhopal disaster. Location: Bhopal, Madhya Pradesh, India. Time: 2– 3 December 1984. Losses: Deaths, at least 3,787; over 16,000 claimed. Description of the accident: The Bhopal gas tragedy is one of the most catastrophic accident in the world’s history. The tragedy happened on December 3, 1984, where a toxic methyl isocyanate (MIC) was released from a storage tank affiliated to the Union Carbide India Limited (UCIL) pesticide plant in Bhopal. The gas released to the atmosphere cover 40 km2 of area and killed or affected thousands of people. Even today, people of Bhopal are still suffering the aftermath of the accident. Lately, the Indian government state that around 200 000.
(29) CHAPTER 1. OVERVIEW ON SAFETY AND RISK CONCEPTS. 17. citizens in Bhopal was affected and still suffering from serious ill health issues. The main cause of this disaster was a “jumper line” connecting a relief valve header to a pressure vent header, enabling water to enter MIC storage Tank 610 (Yang et al. 2015). Labib and Champaneri (Labib & Champaneri 2012) prepared a good report about the accident and the causes behind it.. 1.4.3. Sayano–Shushenskaya power station accident. Location: Yenisei River, near Sayanogorsk in Khakassia, Russia. Time: 17 August 2009 at 08:13 (00:13 GMT) Losses: 75 people were killed and billions of roubles have losses. Description of the accident: A report from Federal Environmental, Technological and Atomic Supervisory Service on 4 October 2009 states that the origin of the accident starts by a turbine vibration that caused a fatigue damage of the mountings of the turbine 2 and its cover. The latter missed at least six nuts from the bolts securing the turbine cover. After that, 49 bolts from the turbine are investigated; it is found that 41 had fatigue cracks and 8 bolts (from 41) their fatigue area exceeded 90% of the total cross-sectional area. At 1:20 AM, a fire was noticed at the hydroelectric power station of Bratsk, the fire broke the communications and the automatic driving systems in the station. At 8:12 AM, the turbine regulator reduces the output power of turbine 2. After that, the bolts keeping the turbine cover in place broke, and under water pressure of about 20 bars, the spinning turbine with its cover, rotor, and upper parts started to move up and caused the destruction of machinery hall installations. At the same time, pressurized water flooded the rooms and damaged plant constructions. The failure of turbine 2 caused the failure of the automatic shutdown system of the water intake pipes’ gates, more detail can be found in (Wikipedia contributors 2017a).. 1.4.4. Fukushima Daiichi nuclear disaster. Location: Okuma, Fukushima, Japan. Time: 11 March 2011 Losses: Non-fatal, 37 injuries, propagation of radiation. Description of the accident: The International Nuclear Event Scale classifies the accident as level 7 event (Major accident), even there is no fatalities but it is expected the death of hundreds of people due.
(30) CHAPTER 1. OVERVIEW ON SAFETY AND RISK CONCEPTS. 18. to the radiation caused by the accident. The main cause of the accident was reported to be the tsunami that followed the Tohoku earthquake on 11 March 2011. Thereafter, the active reactors shut down their sustained fission reactions automatically. The tsunami disabled the emergency generators that feed power to the pumps responsible for the cool of the reactors. These latter suffer from increasing temperature, and caused three nuclear meltdowns, hydrogen-air chemical explosions, and the release of radioactive material in three units. In addition, loss of cooling in the reactors lead to the overheat of the pool that store spent fuel from reactor 4. After an investigation from the Fukushima Nuclear Accident Independent Investigation Commission (NAIIC) On 5 July 2012, it is found that Tokyo Electric Power Company (TEPCO), which is the plant operator, had failed to implement the required safety requirements such as risk assessment and developing evacuation plans, for more detail see (Wikipedia contributors 2017b).. 1.4.5. Deep-water Horizon (the Macondo blowout). Location: Gulf of Mexico, US. Time: 20 April 2010 Losses: 11 workers died, 17 injured and millions of gallons of oil spilled in the Gulf. Description of the accident: Deep-water Horizon began the drilling operation on the Macondo well in February 2010, in the southeast coast of Louisiana, US. The water depth at the site was around 1500 m, and the well was 5500 m below sea level (Skogdalen & Vinnem 2012). An investigation by BP in September 2010 (Arias et al. 2010) states that the accident starts with the failure of well integrity following by a loss of control of the pressure of the fluid in the well. Also, the failure of the blowout preventer which role is to seal the well in case of loss of control. Hydrocarbons shot up the well at an uncontrollable rate and ignited which lead to fire and explosions on the rig. The human hand has also their share in the accident. In the BP report about the accident, they blamed the rig owners ‘Transocean’ for their failure to maintain the BOP. Nevertheless, in the final report of Deepwater Horizon, they stated: ”This disaster was preventable if existing progressive guidelines and practices been followed”, but BP ”did not possess a functional safety culture”. Functional safety means to take into account the whole property of the system rather than just one component property. They also said, ”as a result of a cascade of deeply flawed failure and signal analysis, decision-making, communication, and organizational - managerial processes, safety was compromised to the point that the.
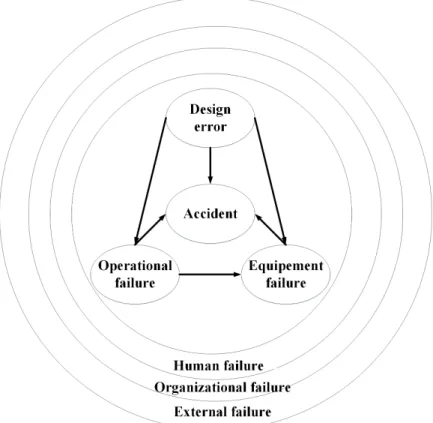
(31) CHAPTER 1. OVERVIEW ON SAFETY AND RISK CONCEPTS. 19. blowout occurred with catastrophic effects.”. 1.5. Accident process model. These models are usually used for incident investigation and prevention. Figure 1.4 depicts the Huston model that discuss the factors that contribute to the incidents and some steps that can be taken to avoid them. The model shows that three major factors (input) are necessary to cause accident: target, driving force, and trigger. The model also represents some action to reduce the severity of the incident. The contact probability may be minimized by preventive action. The contact efficiency and contact effectiveness may be reduced by adaptive reaction (Sam Mannan 2005). However, due to the complexity of nowadays plants, this model cannot give an outstanding picture about the accident. Many models for the accident process can be found in the literature such as: • Fault tree model (Figure 1.5) developed by (Johnson 1980); • Rasmussen model (Rasmussen 1982)(Rasmussen & Lind 1982) that incorporate human factors; • Kletz model (Kletz 1991) which shows the sequence of decisions and actions that lead to the accident and shows the recommendations arising from the investigation for each step; • Industrial risk analysis model based on the systemic approach referred to as Analysis Method of Dysfunctional Systems (MADS). As one can see in figure 1.6, the model is composed of two main systems, target system and danger source. In the latter, many sub-systems (SS) connected can be found, more detail regarding MADS model is presented in (Bouloiz et al. 2010). Recently, many models for accident process have been proposed, most based on the aforementioned models but adding some elements to make the model more flexible. As an example, Adedigba et al. (Adedigba et al. 2016) propose a new model that incorporate external factors such as an earthquake, storm or lightning as potential sources of hazards for process plants. The dependent relationships between different elements in the model such as design error, operational failure and equipment failure is shown in Figure 1.7..
(32) CHAPTER 1. OVERVIEW ON SAFETY AND RISK CONCEPTS. Figure 1.4: Houston model of the accident process (Houston 1971).. Figure 1.5: Fault tree accident model (Khan & Abbasi 1999).. 20.
(33) CHAPTER 1. OVERVIEW ON SAFETY AND RISK CONCEPTS. 21. Figure 1.6: MADS model (Bouloiz et al. 2010).. Figure 1.7: Accident model that incorporate human, organizational, and external failure (Adedigba et al. 2016)..
(34) CHAPTER 1. OVERVIEW ON SAFETY AND RISK CONCEPTS. 1.6. 22. Safety and risk analysis techniques. Different approaches have been developed for safety and risk analysis, a review of such techniques can be found in (Khan & Abbasi 1998). All of these techniques share one objective, which is to identify qualitatively or quantitatively the possible causes and consequences from hazard or threat in the process. We will briefly discus some techniques and methodologies that is used extensively for risk assessment of process industries. As mentioned before, these techniques are divided into qualitative and quantitative methods.. 1.6.1. Qualitative approaches. These techniques depend mostly on the hazard identification using qualitative data resources. It is obviously noted that a quantitative risk analysis (QRA) need both qualitative and quantitative data to give a comprehensive picture of the risk but if no data are available to make inferences from, then a QRA would not be possible (Coleman and Marks 1999). Many techniques are developed in the literature such as HAZOP, FMEA; What-if analysis and Hazard indices; in this section, we will discuss the most used methods based on the review presented by (Khan and Abbasi 1998): HAZOP (Hazard and Operability) HAZOP is one of the most used technique since the seventies, it was standardized in 2001 by international standard IEC 61882 (IEC 61882 2001), to provide a guidance on application of the technique and on the study procedure. It began when a deviation from normal conditions occur. Users and experts depend on design and operation documents such as PI&Ds and PFD to construct HAZOP table. It should be know that this method can only be built by a group of multi-disciplinary expert who have enough information about design, operation and maintenance of the process plant. Table 1.3 shows some of deviations that can occur from a process plant. Some of the outstanding features of HAZOP are that it can be performed in both the design stage and the operational stagee; also, it gives information about the potential hazards of specified deviation as well as their causes, and consequences. Nevertheless, this method is time consuming and can only be conducted by a group of experts..
(35) CHAPTER 1. OVERVIEW ON SAFETY AND RISK CONCEPTS. 23. Table 1.3: Guide words and their physical significance (derives from (Khan and Abbasi 1998)) Guide word. Meaning. None. Negation intention. Less. More. Reverse. Quantitative decrease. Quantitative increase. Logical opposite. Parameter. Deviation. Flow. No flow. Level. Zero level. Flow. Low flow rate. Level. Low level. Temperature. Low temperature. Pressure. Low pressure. Concentration. Low concentration. Flow. High flow rate. Level. High level. Temperature. High temperature. Pressure. High pressure. Concentration. High concentration. Flow. Reverse flow rate. Pressure. Reverse pressure. FMEA (Failure Mode Effect Analysis) FMEA is an inductive method used to identify and eliminate known and/or potential failures, problems, errors from the system, design, process, and/or service. In addition, it provides the designer with the required information about the causes and effects of failures before the system, design, process, or service is finalized. Also, it identifies corrective actions required to prevent failures from reaching the customer. Usually, FMEA examine the individual components such as vessels, pumps and valves that could lead to system failure. One of the most advantage in this method that can be started as soon as some information is known. It does not need all information to be known. It depend of the motto ‘Do the best you can, with what you have’because this is what we deal in the real life tasks (Stamatis, D.H 2003). Some of the information required to stat FMEA includes; system structure, system operation, control and maintenance, system environment and system modeling. An exhaustive guidance is provided from International Standard IEC 60812 (IEC 60812 2006); the latter clarifies the procedural steps necessary to perform an analysis, defines different terms, assumptions, criticality measures, failure modes, and.
(36) CHAPTER 1. OVERVIEW ON SAFETY AND RISK CONCEPTS. 24. gives the basic principles with an examples of the necessary worksheets and tabular forms. An extension of this method referred to as Failure mode, effects, and criticality analysis (FMECA) subject to the same considerations presented for FMEA. What-if analysis This analysis consists of asking series of questions that begin with” what if” aims to identify a hazard in the system, even though, it is not necessary used ‘what if’, also other phrases can be used. Examples of such questions are: • What if the valve does not open? • What if inert gas is omitted? This method performed without need of specialized technique of computational and the questions established used in the entire life of the project. Some of its limits are that the usefulness of this method is measured by the right questions asked and it is more subjective compared with the other methods (HAZOP and FMEA), also only a team of experts can perform what-if analysis. SWIFT (structured what-if technique) The structured what-if technique (SWIFT) is an extension of the abovementioned technique, SWIFT is a systems-based risk identification technique that often required the use of guide words such as timing, amount and prompts (phrases) elicited from participants (phrases begin with “What if. . .” or “How could. . .”) to check risks at systems and investing how the latter will be affected by deviations from normal operations (Card et al., 2012). SWIFT is a flexible technique that can be conducted more quickly and required lower level of detail compared with HAZOP and FMEA methods. A detailed description of SWIFT method is presented in (Card et al. 2012).. 1.6.2. Quantitative approaches. Quantitative techniques consist of identifying the risk or hazard numerically. Probability or likelihood is assigned to each hazard that may occur in the process plant which help to quantify the possible outcomes and make the right decisions when there is uncertainty. Some of these methods are discussed in the following;.
(37) CHAPTER 1. OVERVIEW ON SAFETY AND RISK CONCEPTS. 25. Fault Tree Analysis (FTA) FTA is a deductive method aimed to identify an undesired event (e.g. accident or failure of system), then constructed downwards the tree until reach the root cause of the undesired event. This latter referred to as the Top Event (TE) and the root cause known as the primary event or the basic event. FTA can be applied for wide range of applications such as safety analysis, availability, and maintainability analysis. The international standard IEC 61025 (IEC 61025 2006) addresses two sorts of approaches to FTA, a qualitative approach where the potential causes of the TE are sought out with no interest in their likelihood of occurrence. A probability of occurrence is assigned for each basic event in the quantitative approach, the result of this approach is the probability of occurrence of a TE. This technique is well discussed in chapter 3. Event tree (ET) technique The International Standard IEC 62502 (IEC 62502 2010) specifies the basic principles of Event Tree Analysis (ETA) and represents a map for the use of ETA qualitatively and quantitatively in the context of dependability and risk analysis. Opposite to FTA, ETA is an inductive method that is often used for risk assessment and accident scenario modeling. ET utilizes decision trees to graphically model the possible outcomes (consequences) of an initiating event (IE) (e.g. malfunctioning in the system or process) capable of producing an accidental result by a sequence of events as shown in Figure 1.8, the latter represent an example of Liquefied petroleum gas (LPG) release at a detergent alkylate plant (DAP). The initiating event of ET uses dichotomous conditions (i.e., success/failure, true/false or yes/no) to identify sequenced events, safety barriers and consequences in different branches of the tree (Ferdous et al. 2009). The occurrence probability of a specific outcome event (POE ) can be obtained by multiplying the probabilities of all subsequent events Pi = (P1 , P2 , ..., Pn ) existing in a path (Hong et al. 2009) as shown in equation 1.3. An example of calculation is given in the following; POE =. n Y i=1. Pi. (1.3).
(38) CHAPTER 1. OVERVIEW ON SAFETY AND RISK CONCEPTS. 26. Figure 1.8: Event tree for LPG release (Ferdous et al. 2009). Calculus of the first outcome (consequence 1): F (C1 ) = FIE × P1 × P2 = 0.68 × 10−4 × 0.9 × 0.1 = 6.12 × 10⁻⁶ /Y r. (1.4). Bow-Tie Analysis (BT) The combination of the two aforementioned techniques FT and ET known as Bow-tie analysis (BT); for more detail of this method see chapter 4. Bayesian networks (BNs) BN is a directed acyclic graph (DAG) that consists of a set of variables and a set of directed arcs. A BN is a causal network with a quantitative representation of the causal links. In BN, the variables is represented by nodes, each node is specified by a conditional probability table (CPT) if it is a child node or an unconditional probability table for a parent node (Vileiniskis et al. 2016). These tables are usually built using expert knowledge. The construction of BN model consists of the following (Nielsen & Jensen 2009): • A set of variables and a set of directed edges between variables; • Each variable has a finite set of mutually exclusive states;.
(39) CHAPTER 1. OVERVIEW ON SAFETY AND RISK CONCEPTS. 27. • The variables together with the directed edges form a DAG. A directed graph is acyclic if there is no directed path A1 → ... → An so that A1 = An ; • To each variable with parents, a conditional probability table (CPT) is attached. An example of Bayesian networks To better understand the way of reasoning in Bayesian network, we will use the example of “Car Start Problem” that is proposed by(Jensen & Nielsen 2007): “In the morning, my car will not start. I can hear the starter turn, but nothing happens. There may be several reasons for my problem. I can hear the starter roll, so there must be power from the battery. Therefore, the most probable causes are that the fuel has been stolen overnight or that the spark plugs are dirty. It may also be due to dirt in the carburetor, a loose connection in the ignition system, or something more serious. To find out, I first look at the fuel meter. It shows half full, so I decide to clean the spark plugs.” First, we have to construct a graph that explain the situation and represent the causal relations between chosen events. Using the paragraph above, we choose four main variables: Fuel, Clean Spark Plugs, Fuel Meter standing, and Start. For each variables, we assign different states such as {yes, no} for fuel, clean spark plugs, and start, also {full,. 1 2. ,. empty} for fuel meter event. Thereafter, we construct a model for the situation depending on our perspective, for example, both fuel and clean spark plugs have a causal impact on the start of the car. In addition, fuel has an impact on the Fuel Meter Standing state. BN in Figure 1.9 summarize the relationship between events. Fu, SP, St, and FM are the abbreviations of fuel, clean spark plugs, start, and fuel meter standing, respectively.. Figure 1.9: Bayesian network for the reduced car start problem The first part of BN (Figure 1.9) referred to as the qualitative part. The big advantage of BN that we can perform quantitative modeling by assigning a probability assessment.
(40) CHAPTER 1. OVERVIEW ON SAFETY AND RISK CONCEPTS. 28. for each variables in the graph. The following tables represent the probability of each variable, the first ones called unconditional tables (parents nodes) as shows Table 1.4, and the others are conditional tables (child nodes) as depicted in Table 1.5 Table 1.4: Unconditional probabilities for the parent nodes. Yes. Fu. 0.98. No 0.02 P(Fu) Yes 0.96. SP. No 0.04 P(SP). Table 1.5: Conditional probabilities for the child nodes. Fu FM. Fu SP St. Yes No. Yes. No. Full. 0.39. 0.001. 1 2. 0.6. 0.001. Empty 0.01 P(FM\ Fu) Yes. 0.998 No. Yes. No. Yes. No. 0.99. 0.01. 0. 0. 0.01 0.99 1 P(St\ Fu, SP). 1. The chain rule in Bayesian networks Theorem Let BN be a Bayesian network over U = {A1 , A2 , ..., An }. Then BN specifies a unique joint probability distribution P (U ) given by the product of all conditional probability tables specified in BN: P (U ) =. n Y. pa(Ai )). (1.5). i=1. Where pa(Ai ) is the parents of Ai in BN, and P (U ) reflects the properties of BN. For the proof of the aforementioned equation see (Jensen & Nielsen 2007). Based on the equation above, the joint probability is calculated for the reasoning in Bayesian network of the Car Start Problem:.
(41) CHAPTER 1. OVERVIEW ON SAFETY AND RISK CONCEPTS. 29. P (F u, F M, SP, St) = P (F u)P (SP )P (F M \ F u)P (St \ F u, SP ). (1.6). The no start of the car is the situation handled in the example, so the evidence is St = no. So, what is the cause or better the variable with the high contribution on the no start of the car, is it the need to the fuel? Or the dirty of the spark plug? Table 1.6 is used to answer these two questions. Table 1.6: The joint probability table for P (Fu, FM, SP, St = no). FM Fu SP. 1 2. Full. Empty. Yes. No. Yes. No. Yes. No. Yes. 0.00367. 0.000019. 0.00564. 0.000019. 0.000094. 0.0192. No. 0.01514. 0.0000008. 0.0233. 0.0000008. 0.000388. 0.000798. By summing each row in Table 1.6, we get P (SP, St = no) = (0.02864, 0.03965) and by dividing this equation by P (St = no), we get the conditional probability P ((SP \ St = no). Knowing that P (St = no) = P (SP = yes, St = no) + P (P S = no, St = no) = 0.02864 + 0.03965 = 0.06829. Finally, we get P (SP \ St = no) = (0.42, 0.58). Using the same way as above, we find that P (F u \ St = no) = (0.71, 0.29). We can conclude from the two previous results that dirty of the spark plugs is the closest variable that lead to no start of the car. Now, assuming that we check the fuel meter and we get an information that the fuel meter’s index indicates half (F M = 21 ), the numbers of the situation are given in Table 1.7. Table 1.7: The joint probability table for P (Fu, SP, St = no, FM =. Sp. ). 1 2. FM Fu. 1 2. Yes. No. Yes. 0.00564. 0.000019. No. 0.0233. 0.0000008. Calculating the conditional probability, we get P (F u\St = no, F M = 12 ) = (0.999, 0.001) and P (SP \ St = no, F M = 12 ) = (0.196, 0.804). We can conclude that the probability of SP = yes increased when we observed that F M = chapter 2 and 3). Advantages of BN. 1 2. (for more detail about BN see.
(42) CHAPTER 1. OVERVIEW ON SAFETY AND RISK CONCEPTS. 30. Unlike the aforementioned methods, BN offer an advanced dependencies modeling, dynamic analysis, and more flexible structures. In the dependencies modeling, two ways can be distinguished, a vertical dependency where the relation between the basic nodes, the intermediate nodes, and the leaf node are presented. The other way is the horizontal dependency where the basic nodes are depending on each other. The latter way makes BN more effective from FT and ET, since these methods suppose the basic event independency. The dependencies are all presented in form of conditional probabilities table (CPT) where available data from references and expert knowledge are used to fill these CPTs (Deyab, Taleb-berrouane, Khan, & Yang, 2018). BN can update event probabilities using the Bayesian updating mechanism by incorporating new information from system, a feature that FT and ET are incapable to incorporate, this is what make BN a suitable tool for dynamic analysis (Khan et al., 2016). A comparison of FT and BN in dependability analysis and safety analysis is presented in (Bobbio, Portinale, Minichino, & Ciancamerla, 2001) (Khakzad, Khan, & Amyotte, 2011). These comparisons show the advantages of BN over FT in representing the dependencies of events, updating probabilities, and coping with uncertainties. In addition, BN can incorporate multi-state variables, dependent failures, functional uncertainty, common cause failures, and expert opinion in different domains. Since FT, ET, and BT can be mapped into BN, so the abovementioned features of BN are the same for the three methods. Disdvantages of BN Even with the great capabilities of BN in different modeling, BN have some problems regarding modeling of temporal dependencies, also there is no guide about how to form the appropriate reliability or dependability model (Ondˇrej N´ yvlt, 2015), this is why usually FT used to build reliability or dependability model then the latter is converted to BN. Moreover, BN require a high computational burden to construct conditional probability tables, which make it very difficult to model complex dependencies among variables (Khan et al., 2016).. 1.7. Conclusion. In the current chapter, we tried to give a short review about the concepts related to safety and risk analysis. Several accidents from literature have been addressed, most of them happened in the last decade. In addition, different accident process models are presented and some techniques for safety and risk analysis have been discussed. Further-.
(43) CHAPTER 1. OVERVIEW ON SAFETY AND RISK CONCEPTS. 31. more, the Bayesian networks method is well presented together with its advantages and disadvantages. It is obviously important to establish a risk assessment in the nowadays industries to avoid catastrophic accident that causes heavy losses (i.e. human losses and environmental pollution). In the literature, we can find a quite number of approaches proposed for risk and safety analysis. Nevertheless, accidents still occur, human losses their life, and millions of dollars go in vain. It is important to test the effectiveness of these methods by comparing them with other ones. In the next chapter, we will review the applications of BN in the process industry and chemical plants in the last decade, and give a simple application of BN in the oil and gas sector.. References Adedigba SA, Khan F, Yang M, et al (2016) Process accident model considering dependency among contributory factors. Process Saf Environ Prot 102:633–647. doi: 10.1016/j.psep.2016.05.004 Antonioni G, Spadoni G, Cozzani V (2009) Application of domino effect quantitative risk assessment to an extended industrial area. J Loss Prev Process Ind 22:614–624. doi: 10.1016/j.jlp.2009.02.012 Arendt JS, Lorenzo DK (2000) Evaluating Process Safety in the Chemical Industry. New York, USA: Center for Chemical Process Safety. Am Inst Chem Eng Arias JT, Higuita JC, Castrill´on OD (2010) Deep Water The Gulf oil dissaster and the future of offshore drilling Bobbio A, Portinale L, Minichino M, Ciancamerla E (2001) Improving the analysis of dependable systems by mapping Fault Trees into Bayesian Networks. Reliab Eng Syst Saf 71:249–260. doi: 10.1016/S0951-8320(00)00077-6 Bouloiz H, Garbolino E, Tkiouat M (2010) Contribution of a systemic modeling approach applied to support risk analysis of a storage unit of chemical products in Morocco. J Loss Prev Process Ind. doi: 10.1016/j.jlp.2009.12.001 British Standards Institution (2007) Occupational health and safety management systems - Requirements BS (1979) 4778, Glossary of Terms Used in Quality Assurance (Including Reliability and Maintainability Terms). Br Stand Institution, London Card AJ, Ward JR, Clarkson PJ (2012) Beyond FMEA: the structured what-if tech-.
(44) CHAPTER 1. OVERVIEW ON SAFETY AND RISK CONCEPTS. 32. nique (SWIFT). J. Healthc. Risk Manag. Coleman ME, Marks HM (1999) Qualitative and quantitative risk assessment. Food Control 10:289–297. doi: 10.1016/S0956-7135(99)00052-3 Collier K (2010) The Loss of the Ocean Ranger, 15 February 1982. In: Newfoundl. Labrador Herit. urlhttp://www.heritage.nf.ca/articles/economy/ocean-ranger.php. Accessed 31 Jul 2017 De Rademaeker E, Suter G, Pasman HJ, Fabiano B (2014) A review of the past, present and future of the European loss prevention and safety promotion in the process industries. Process Saf Environ Prot 92:280–291. doi: 10.1016/j.psep.2014.03.007 Deyab SM, Taleb-berrouane M, Khan F, Yang M (2018) Failure analysis of the offshore process component considering causation dependence. Process Saf Environ Prot. doi: 10.1016/j.psep.2017.10.010 Ferdous R, Khan F, Sadiq R, et al (2009) Handling data uncertainties in event tree analysis. Process Saf Environ Prot 87:283–292. doi: 10.1016/j.psep.2009.07.003 Hong E-S, Lee I-M, Shin H-S, et al (2009) Quantitative risk evaluation based on event tree analysis technique: Application to the design of shield TBM. Tunn Undergr Sp Technol 24:269–277. doi: 10.1016/j.tust.2008.09.004 Houston DEL (1971) New approaches to the safety problem. Major Loss Prev Process Ind 210 IEC 60300-3-9 (1995) Dependability Management–Part 3: Application Guide–Section 9: Risk Analysis of Technological Systems IEC 60812 (2006) Analysis techniques for system reliability – Procedure for failure mode and effects analysis (FMEA).[IEC 60812]. Int Electrotech Comm IEC 61025 (2006) Fault tree analysis. [IEC 61025]. Int Electrotech Comm IEC 61882 (2001) Hazard and operability studies (HAZOP studies)-application guide. [IEC 61882]. Int Electrotech Comm IEC 62502 (2010) Analysis techniques for dependability – Event tree analysis (ETA). [IEC 62502]. Int Electrotech Comm Isermann R (2006) Fault-diagnosis systems: An introduction from fault detection to fault tolerance ISO NZS (1994) Australian / New Zealand Standard Quality management and quality assurance — Vocabulary Jensen F V., Nielsen TD (2007) Bayesian Networks and Decision Graphs Johnson WG (1980) MORT safety assurance systems. Marcel Dekker Inc.
(45) CHAPTER 1. OVERVIEW ON SAFETY AND RISK CONCEPTS. 33. Khakzad N, Khan F, Amyotte P (2011) Safety analysis in process facilities: Comparison of fault tree and Bayesian network approaches. Reliab Eng Syst Saf 96:925–932. doi: 10.1016/j.ress.2011.03.012 Khan F, Hashemi SJ, Paltrinieri N, et al (2016) Dynamic risk management: a contemporary approach to process safety management. Curr. Opin. Chem. Eng. Khan F, Rathnayaka S, Ahmed S (2015) Methods and models in process safety and risk management: Past, present and future. Process Saf Environ Prot 98:116–147. doi: 10.1016/j.psep.2015.07.005 Khan FI, Abbasi S. (1998) Techniques and methodologies for risk analysis in chemical process industries. J Loss Prev Process Ind 11:261–277. doi: 10.1016/S0950-4230(97)0005 1-X Khan FI, Abbasi S. (1999) Reply to comments on “Major accidents in process industries and an analysis of causes and consequences.” J Loss Prev Process Ind 14:85. doi: 10.1016/S0950-4230(00)00016-4 Kletz T (1991) Piper alpha: latest chapter in a long story. J Loss Prev Process Ind 4:277–278 Labib A, Champaneri R (2012) The Bhopal Disaster-learning from failures and evaluating risk. Maint Eng 27:41–47 Mannan S (2005) Lees’ loss prevention in the process industries. Butterworth-Heinem– ann MIL-STD-882D (2000) Department of Defense 2000 “MIL-STD-882D System Safety Program Requirements. Stand Pract Syst Safety” Washingt DC USA Miner G (2002) Guidelines for Analyzing and Managing the Security Vulnerabilities of Fixed Chemical Sites. Am Water Work Assoc J 94:126 Nielsen TD, Jensen FV (2009) Bayesian Network and Decision Graph. Springer Science & Business Mediaj Norway S (2010) Risk and emergency preparedness analysis. NOROSK Stand Z-013, Rev 3:16–18 Ondˇrej N´ yvlt (2015) Risk Management Methods for Industrial Systems. Czech Technical University in Prague Perrin L, Mu˜ noz-Giraldo F, Dufaud O, Laurent A (2012) Normative barriers improvement through the MADS/MOSAR methodology. Saf Sci. doi: 10.1016/j.ssci.2012.02.002 Rasmussen J (1982) Human errors. A taxonomy for describing human malfunction in industrial installations. J Occup Accid 4:311–333. doi: 10.1016/0376-6349(82)90041-4.
(46) CHAPTER 1. OVERVIEW ON SAFETY AND RISK CONCEPTS. 34. Rasmussen J, Lind M (1982) A Model of Human Decision Making in Complex Systems and its Use for Design of System Control Strategies. 1982 Am. Control Conf. 270–276 Rausand M (2011) Risk Assessment: Theory, Methods, and Applications. John Wiley & Sons Reniers GLL (2010) Multi-plant Safety and Security Management in the Chemical and Process Industries. WILEY-VCH Verlag GmbH & Co. KGaA, Weinheim Skogdalen JE, Vinnem JE (2012) Quantitative risk analysis of oil and gas drilling, using Deepwater Horizon as case study. Reliab Eng Syst Saf 100:58–66. doi: 10.1016/j.ress.2011. 12.002 Stamatis, D.H (2003) Failure Mode and Effect Analysis: FMEA from Theory to Execution Vileiniskis M, Remenyte-Prescott R, Rama D, Andrews J (2016) Fault detection and diagnostics of a three-phase separator. J Loss Prev Process Ind 41:215–230. doi: 10.1016/j.jlp.2016.03.021 Vinnem JE (2014) Offshore Risk Assessment vol 2 Principles, Modelling and Applications of QRA Studies, Third Edit Wikipedia contributors (2017a) 2009 Sayano–Shushenskaya power station accident. In: Wikipedia, Free Encycl.. http://en.wikipedia.org/wiki/Fukushima_Daiichi_. nuclear_disaster. Accessed 12 Aug 2017 Wikipedia contributors (2017b) Fukushima Daiichi nuclear disaster. In: Wikipedia, Free Encycl. https://en.wikipedia.org/w/index.php?title=Fukushima_Daiichi_nuclear_ disaster&oldid=794134922. Accessed 13 Aug 2017 Yang M, Khan F, Amyotte P (2015) Operational risk assessment: A case of the Bhopal disaster. Process Saf Environ Prot 97:70–79. doi: 10.1016/j.psep.2015.06.001.
Figure

+7
Documents relatifs
