HAL Id: hal-00534915
https://hal-iogs.archives-ouvertes.fr/hal-00534915
Submitted on 15 Nov 2010
HAL is a multi-disciplinary open access
archive for the deposit and dissemination of
sci-entific research documents, whether they are
pub-lished or not. The documents may come from
teaching and research institutions in France or
abroad, or from public or private research centers.
L’archive ouverte pluridisciplinaire HAL, est
destinée au dépôt et à la diffusion de documents
scientifiques de niveau recherche, publiés ou non,
émanant des établissements d’enseignement et de
recherche français ou étrangers, des laboratoires
publics ou privés.
Polarimetric surface plasmon resonance imaging
biosensor
Aurélien Duval, Aude Laisné, Denis Pompon, Sylvain Held, Alain Bellemain,
Julien Moreau, Michael Canva
To cite this version:
Aurélien Duval, Aude Laisné, Denis Pompon, Sylvain Held, Alain Bellemain, et al.. Polarimetric
surface plasmon resonance imaging biosensor. Optics Letters, Optical Society of America - OSA
Publishing, 2009, 34 (23), pp.3634-3636. �hal-00534915�
Polarimetric surface plasmon resonance
imaging biosensor
Aurélien Duval,1,*Aude Laisné,2Denis Pompon,2Sylvain Held,3Alain Bellemain,1 Julien Moreau,1and Michael Canva1
1Laboratoire Charles Fabry de l’Institut d’Optique, CNRS, Université Paris Sud, Campus Polytechnique RD 128,
91127 Palaiseau CEDEX, France
2Centre de Génétique Moléculaire, CNRS, Avenue de la Terrasse, 91190 Gif-sur-Yvette, France 3Institut d’Electronique Fondamentale, CNRS, Université Paris Sud, Bâtiment 220, 91405 Orsay, France
*Corresponding author: [email protected]
Received September 28, 2009; accepted October 13, 2009; posted November 2, 2009 (Doc. ID 117883); published November 19, 2009
We report the realization of a polarimetric surface plasmon resonance imaging system capable of dynami-cally resolving a change in the optical anisotropy of biochemical films. Anisotropies as small as10−3
refrac-tive index unit on nanometer-thick samples can be resolved. As an example, we present here the dynamical anisotropy obtained by the electrical patterning of a film consisting of a self-assembled monolayer deposited on gold, covered with a phospholipid hemimembrane. © 2009 Optical Society of America
OCIS codes: 240.6680, 310.6860, 110.5405. Surface plasmon resonance (SPR) biosensors are be-ing increasbe-ingly used in laboratories as sensitive bio-chemical transducers for several applications such as genetic diagnostics [1], kinetics of interactions analy-sis [2], or food analysis [3], for example. They rely on the coupling between oscillating bound-free electrons present in a metallic thin-film (the surface plasmons) and an incident TM-polarized light wave. A modifica-tion in the refractive index of the surrounding dielec-tric medium will change the coupling between the plasmon waves and the incident light. Monitoring the reflectivity of such a system enables the detection of minute changes in the refractive index of the sur-rounding medium. Surface plasmon resonance imag-ing (SPRI) allows parallel monitorimag-ing of multiple in-teractions dynamically [4].
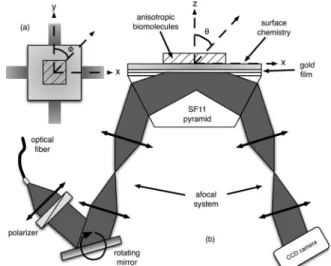
The polarimetric surface plasmon resonance imag-ing (P-SPRI) system demonstrated here is based on the Kretschmann–Raether configuration [5], using two orthogonal SPRI arms both capable of capturing TM-polarized images of the biosensor’s surface, fol-lowing two orthogonal planes of incidence, as shown in Fig.1. Each sensor arm can act as a completely in-dependent SPRI system. Compared to approaches based on coupled plasmon-waveguide resonance spectroscopy [6], or more classical ellipsometric methods [7], the P-SPRI system developed is capable of dynamical measurements on label-free films.
The reflectivity variations in the image measured in each direction (x and y) of the surface of the bio-sensor, shown in Eq. (1), are proportional to the variations in the effective refractive indices (!nxand !ny) probed by the propagating plasmon wave, as well as the thickness !!d" of the biological thin-film (typically 1–50 nm thick) deposited on the biosensor surface,
!Rk" !nk!d, k =#x,y$. !1" Variations in the relative mean anisotropy !n of the covering dielectric medium are measured by sub-tracting the signal of one arm from the other. In
bio-chemical systems consisting of long chains, like the self-assembled monolayer (SAM), the birefringence is given by the intrinsic anisotropy of the molecule and the order parameter of the assembly. The latter can be characterized by its azimuth # and zenith $. An (arbitrary) 1-nm-thick equivalent layer of dense bire-fringent rod-shaped molecules with an intrinsic an-isotropy of !0.1 (niso%1.45 [8]) tethered to gold and oriented parallel to the surface !$=90°", and one of the system’s axes !#=0°" will yield a maximal rela-tive mean effecrela-tive anisotropy of !n% ±0.1 as mea-sured by our system. Taking for reference a layer ori-ented along the surface normal!$=0°", the rotation of the molecules from “up” to “laying flat” will give rise to a simulated maximal reflectivity difference !Raniso=!Rx−!Ry of about %3%. In real applica-tions, the signal measured will be reduced owing to smaller$ variations and an arbitrary azimuth.
For each orthogonal sensor arm, the incident light (an LED at 670 nm, FWHM of 25 nm) is first colli-mated, TM-polarized, and reflected off a motorized rotating mirror before being coupled to the metallic
Fig. 1. Schematic representation of the P-SPRI system. (a) Top view. (b) Side view.
3634 OPTICS LETTERS / Vol. 34, No. 23 / December 1, 2009
sensor layer through the use of an afocal system and the SF11 pyramid. On the opposite face of the pyra-mid, the reflected light passes through a similar afo-cal system and is collected by a CCD camera (Cooke Pixelfly QE). Using an afocal optical system (magni-fication of 1&) and a rotating mirror limits the angles of incidence to a %5° region around the central angle (53° with respect to the base of the pyramid), hence limiting the range of measurable bulk refractive in-dices from 1.294 to 1.386. For dielectric layers !n =1.45" deposited on gold and immersed in water !n =1.33", it restricts the measurements to thin films !'50 nm".
The combined reading of both arms is shot-noise limited as in more traditional SPRI systems. We de-termined that our P-SPRI setup yields a noise of less than 10−2% using spatial averaging !400(m
&400(m", while keeping dynamical capabilities (1 s integration for 16 images averaged).
The anisotropy figure measured for each pixel of the resulting differential SPR images can only make sense if the P-SPRI system is calibrated so that iso-tropic samples do not appear as anisoiso-tropic. To dem-onstrate the normalization technique used, we car-ried out an experiment using a SF11 glass-slide covered with gold squares!1 mm2". The squares were
deposited using lift-off UV lithography and vacuum evaporation techniques. They are composed of a 7-nm-thick Ti adhesion layer and a 47-nm-thick Au sensing layer. Index-matching oil was deposited be-tween the base of the pyramid and the biosensor. The system was finally covered with a flow-cell.
At a fixed incidence angle (the maximum slope of the angular reflectivity curve), a dynamical SPRI measurement was performed simultaneously on nine gold squares (using 400(m&400(m spatial averag-ing) under a constant flow of water. After approxi-mately 2 min, water was replaced with a mixture of 1% volume per volume (v/v) glycerol in water. After 6 min, water was injected and circulated until reaching a steady state. A second mixture of 1.5% (v/v) glycerol was injected after approximately 10 min.
Figures 2(a) and 2(b) show the reflectivity varia-tions (!Rx and !Ry) induced by the injection of glyc-erol, averaged over nine gold squares. They corre-spond to bulk refractive index increases of, respectively, !n=1.4&10−3 refractive index unit
(RIU) for 1% glycerol and !n=2.1&10−3RIU for 1.5%
glycerol. The resulting signal is equivalent to a thin-film deposition as in biosensing applications. Using the extended Rouard method [9], we determined that the response to 1% glycerol would give a signal simi-lar to the deposition of about 2 nm of a dielectric ma-terial!n=1.45" on the gold surface.
To account for small differences in reflectivity slopes between the two arms, reflectivity variations are normalized by the mean 1% glycerol plateau. The dynamical SPR anisotropy signal !!Raniso" can then be determined by subtracting arms x and y signals. The result for our glycerol experiment is depicted in Fig. 2(c). As expected, no artifactual anisotropy is found outside the injection and washing regions (materialized by dashed lines in the figure). In this
particular experiment, the residual noise is mea-sured below !Raniso=10−2%, which would translate
into a minimal detectable bulk anisotropy of !nmin =10−5RIU or into a minimal anisotropy of 10−3RIU
for 1 nm of biomolecules!niso=1.45" tethered onto the gold surface. Using our model of a dense layer of bi-refringent rod-shaped molecules with an intrinsic an-isotropy of !0.1, angular variations as small as 5° of a 1-nm-thick equivalent layer can be discriminated.
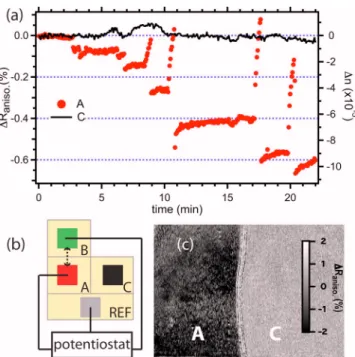
To illustrate applications of such a system, the an-isotropy resulting from the patterning of a surface consisting in a SAM and a phospholipid hemimem-brane was determined dynamically using our P-SPRI setup. The biochip was divided into three different regions depicted in Fig. 3(b). Regions A and B were connected to a potentiostat capable of applying an electrical potential difference between these elec-trodes and the buffer solution. The REF region was acting as a reference for the electric cycles, and re-gion C was used as a control and thus isolated from the surrounding electrodes.
Prior to the experiment, a layer of alkanethiols was allowed to self-assemble on the gold surface, covering all regions of the biochip. A fusion of phospholipid liposomes was then realized on the SAM, resulting in a supported hemimembrane [10]. During the experi-ment, several electrical cycles were realized between the A and B regions. Each cycle consisted into a 1 min square profile, applying a potential of %1.5 V to the region. The mean dynamical SPR anisotropy !!Raniso" signal of the regions was captured using the P-SPRI system and is given in Fig.3(a), showing par-allel measurements on regions A (dots) and C (line). Spatial averaging (area of %400(m&400(m) was used again in order to reduce the noise, and the sig-nal resulting from the REF region was subtracted from the curves.
It can be clearly observed that region C stays iso-tropic throughout the experiment with a residual
av-Fig. 2. Corrected mean dynamical reflectivity variations induced by the injections of 1% and 1.5% glycerol in water. (a) Arm x. (b) Arm x. (c) “Anisotropy” of the bulk liquid. Dashed lines represent fluidic transitions. Right axes, cor-responding bulk !n.
eraged SPR anisotropy of '10−2% (or a bulk
aniso-tropy of less than 10−5), while region A becomes
anisotropic after the first cycle of the electric poten-tial and gains anisotropy as more cycles are applied to the region. The sharp drops observed between steady state anisotropy levels are due to the electri-cal cycles themselves. As the potential applied changes polarity, the change in the orientation of the surface-bound molecules is believed to be maximal. At the end of the experiment, region A exhibits an av-eraged SPR anisotropy of )0.6%, yielding a bulk an-isotropy of !n=−9&10−5RIU or approximately
10−2RIU for 1 nm of a dielectric material !n=1.45"
deposited.
The image of Fig. 3(c) is obtained by subtracting the differential SPR images at t=1.5 and 13.5 min.
We can clearly observe that the region where electric potential cycles were applied gained a pattern, while the control region is still homogeneous at the end of the experiment. We believe that this patterning effect is responsible to some extent for the anisotropic sig-nal observed.
A P-SPRI biosensor capable of resolving the dy-namical anisotropy of biochemical films has been de-veloped. The system is found to be limited by photon noise, while yielding a reading noise of less than 10−2%, enabling the characterization of dynamical
anisotropy of samples with a sensitivity on the order of 10−3RIU on nanometric biological layers. A
dy-namical anisotropy measurement has been carried out on a biochemical film patterned by cycles of ap-plied electrical potential, leading to a SPR signal of )0.6% or 10−2RIU for 1 nm of a dielectric material
!n=1.45" deposited.
The authors acknowledge the support of the Na-tional French Research Agency (ANR) through the National Program for Nanosciences and Nanotech-nologies (PNANO) of the European Network of Excel-lence Photonics4Life (FP7) and the help of A. Aide on the mechanical design.
References
1. J. Hottin, J. Moreau, G. Roger, J. Spadavecchia, M.-C. Millot, and M. Goosens, Plasmonics 2, 201 (2007). 2. B. P. Nelson, T. E. Grimsrud, M. R. Liles, R. M.
Goodmab, and R. M. Corn, Anal. Chem. 73, 1 (2001). 3. D. R. Shankaran, K. V. Gobi, and M. Miura, Sens.
Actuators B 121, 158 (2007).
4. M. Piliarik, H. Vaisocherov, and J. Homola, Biosens. Bioelectron. 20, 2104 (2005).
5. E. Kretschmann and H. Raether, Z. Naturforsch. A
23A, 2135 (1968).
6. Z. Salamon and G. Tollin, Biophys. J. 80, 1557 (2001). 7. M. Schubert, Thin Solid Films 313–314, 323 (1998). 8. R. Naumann, S. M. Schiller, F. Giess, B. Grohe, K. B.
Hartman, I. Kärcher, I. Köper, J. Lübben, K. Vasilev, and W. Knoll, Langmuir 19, 5435 (2003).
9. P. Lecaruyer, E. Maillart, M. Canva, and J. Rolland, Appl. Opt. 45, 8419 (2006).
10. W. Boireau, S. Bombard, M. Sari, and D. Pompon, Biotechnol. Bioeng. 77, 225 (2002).
Fig. 3. (Color online) (a) Dynamical P-SPRI signal of a SAM-supported hemimembrane system. Dots, anisotropic response of electrode A. Line, response of electrode C (con-trol). (b) Diagram of the biochip areas. (c) Image of the dif-ferential SPR anisotropy observed.