Analysis of Exotic Cat Vocalizations and
Middle-Ear Properties
by
Kevin N. O'Connor
Submitted to the Department of Electrical Engineering
and Computer Science in Partial Fulfillment of the
Requirements for the Degree of Master of Engineering in
Electrical Engineering and Computer Science
at the
MASSACHUSETTS INSTITUTE OF TECHNOLOGY
January 10, 2001
© Massachusetts Institute of Technology, 2001. All Rights Reserved.
Author ...
...
Department of Electrical Engineering and Computer Science
January 10, 2001
Certified by .
William T. Peake
Professor of Electrical and Bio-Engineering
Thesis Supervisor
A ccepted by ... ...0... .. ... ...
Arthur C. Smith
Chairman, Department Committee on Graduate Theses
MASSACHUSETTS INSTITUTE
Analysis of Exotic Cat Vocalizations and Middle-Ear Properties
by
Kevin N. O'Connor Submitted to the
Department of Electrical Engineering and Computer Science January 10, 2001
In Partial Fulfillment of the Requirements for the Degree of Master of Engineering in Electrical Engineering and
Computer Science
Abstract
The effects of a peculiar feature of the middle ears in species of the cat family on the reception of intraspecies vocalizations are examined in two species: bobcat and cheetah. Vocalizations of both species are analyzed, and computer-based middle-ear models for each species are generated. The vocalizations often exhibit harmonic structure and the middle ears act as notch filters when transmitting sound from the ear canal to the cochlea. An hypothesis is tested concerning the implications of these features on vocal communi-cation among members of the same species; specifically, does the middle-ear notch have a perceptually salient effect on the vocalizations when it attenuates one of the harmonics? The main finding is that, for the available data, the middle-ear notch does not affect the vocalizations in a manner that could be exploited to enhance vocal communication, and other "adaptive" explanations for the middle-ear structure are more promising.
Thesis Supervisor: William T. Peake
Table of Contents
Introduction ... 10
Part I: Vocalization Descriptions Background ... 18
Chapter 1: Bobcat Vocalizations ... 20
1.1 M ethods ... 20
1.2 Results ... 29
1.3 Sum m ary of Features ... 39
1.4 Discussion and Conclusions ... 42
Chapter 2: Cheetah Vocalizations ... 46
2.1 M ethods ... 46
2.2 Results ... 47
2.3 Sum m ary of Features ... 52
2.4 Discussion and Conclusions ... 54
Part II: Filter Construction and Hypothesis Testing Background ... 58
Chapter 3: Construction of M iddle-Ear Filters ... 62
3.1 Introduction to M odel ... 62
3.2 Theoretical M odel Characteristics ... 65
3.3 Filter Im plem entation ... 69
3.4 Examination of Filters and Comparisons to Theory ... 82
3.5 M odifications of M odels ... 84
Chapter 4: Hypothesized Role of the Middle Ear in Vocal Communication ... 94
4.1 A Model for the Structure, Perception, and Meaning of Vocalizations .... 94
4.2 Hypothesis of the Middle Ear's Role in Felid Vocal Communication . 97 4.3 Proposed Methodology for Testing the Hypothesis ... 100
Chapter 5: Tests of the Perceptual Hypotheses ... 102
5.1 Filtering and Preliminary Listening ... 102
5.2 Quantitative Perceptual Tests ... 117
5.3 Correlations Between Test Results and Vocalization Structure ... 131
5.4 Perception of Filtered or Unfiltered Noise versus Vocalizations ... 144
Chapter 6: O verall Conclusions ... 152
6.1 Sum m ary of R esults ... 152
6.2 A dditional W ork ... 155
6.3 A n A lternate H ypothesis ... 156
Appendix 1: Bobcat Vocalization Summaries and Spectrograms ... 158
Appendix 2: Cheetah Vocalization Summaries and Spectrograms ... 190
Appendix 3: Matlab Code for Chapter 3... 214
Appendix 4: Matlab Code for Chapter 5... 228
List of Figures
Figure 0.1: Vocal Communication Chain ... 11
Figure 0.2: Felid Middle-Ear Structure, Cross-Sectional View...13
Figure 0.3: Measured Middle-Ear Cavity Gain for Domestic Cat and Lion ... 14
Figure 0.4: Cheetah Vocalization, to Illustrate Harmonic Structure ... 15
Figure 1.1: Examples of Observation and Measurement Categories...28
Figure 1.2: Example of Pulsed Amplitude Modulation...29
Figure 2.1: Example of Pulsed Amplitude Modulation in a "Stutter"...48
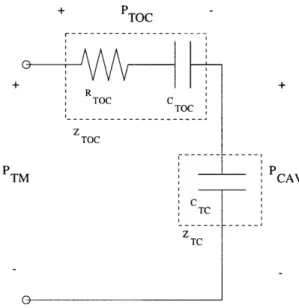
Figure 2.2: Middle-Ear Circuit Model Superimposed Upon the Structure it Represents..59
Figure 3.1: Felid M iddle-Ear M odel... 62
Figure 3.2: Low-Frequency M iddle-Ear M odel... 65
Figure 3.3: Linear Plots of GCAV for Left and Right Bobcat Middle Ears...71
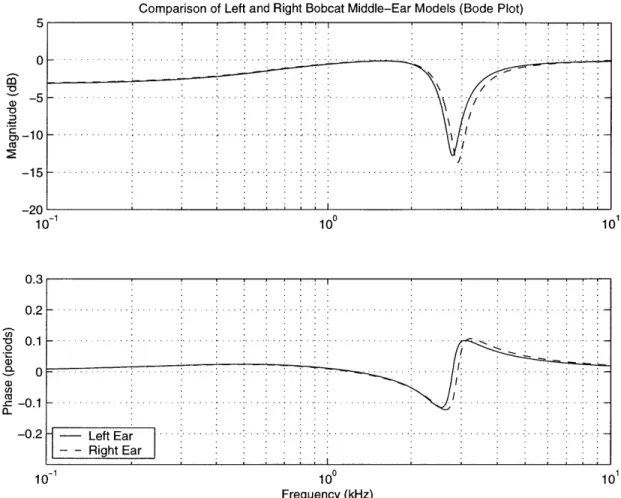
Figure 3.4: Bode Plots of GCAV for Left and Right Bobcat Middle Ears...72
Figure 3.5: Linear Plots of GCAV for Left and Right Cheetah Middle Ears...73
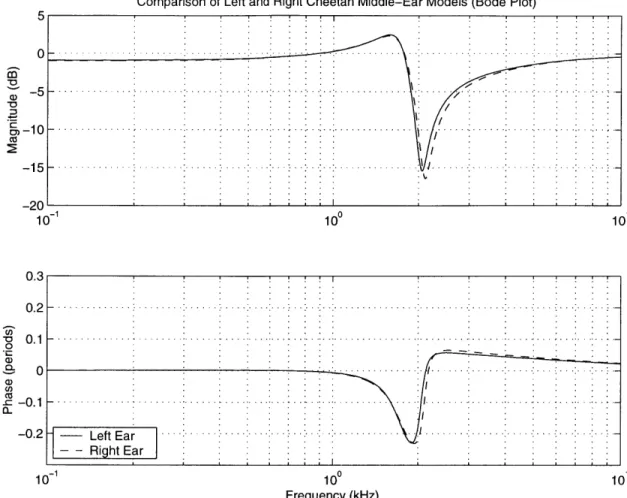
Figure 3.6: Bode Plots of GCAV for Left and Right Cheetah Middle Ears...74
Figure 3.7: Illustration of Mapping from Unit Circle to ifft Vector with N = 8...76
Figure 3.8: First 100 Points of the Bobcat and Cheetah Impulse Responses ... 78
Figure 3.9: Left Bobcat ME: Comparison Betw. Orig. and Truncated Versions ... 81
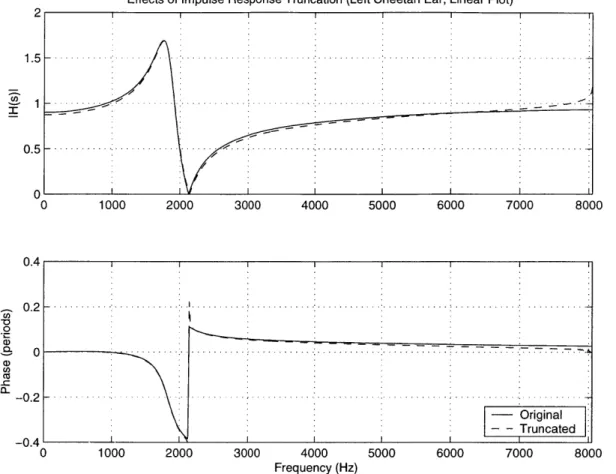
Figure 3.10: Left Cheetah ME: Comparison Betw. Orig. and Truncated Versions...82
Figure 3.11: Middle-Ear Model with a Plugged Foramen...85
Figure 3.12: Middle-Ear Model with Removed Septum ... 86
Figure 3.13: Left Bobcat Ear: Linear Plot Comparison of Original to Plugged Foramen and R em oved Septum ... 87
Figure 3.14: Left Bobcat Ear: Bode Plot Comparison of Original to Plugged Foramen and
Re-m oved SeptuRe-m ... 88
Figure 3.15: Left Cheetah Ear: Linear Plot Comparison of Original to Plugged Foramen and R em oved Septum ... 89
Figure 3.16: Left Cheetah Ear: Linear Plot Comparison of Original to Plugged Foramen and R em oved Septum ... 90
Figure 4.1: A Model of Felid Perception of Vocalizations...97
Figure 4.2: Hypothetical Role of the Middle Ear in Vocal Communication...99
Figure 5.1: Overall Scores of Identification and Discrimination Listening Tests ... 122
Figure 5.2: Test Scores for Individual Tokens...123
Figure 5.3: Scores of Individual Test Subjects ... 124
Figure 5.4: Token 1 H2 and H3 Freqs and Amps Before and After Filtering ... 134
Figure 5.5: Token 2 H2 and H3 Freqs and Amps Before and After Filtering ... 135
Figure 5.6: Token 3 H2 and H3 Freqs and Amps Before and After Filtering ... 136
Figure 5.7: Token 4 H2 and H3 Freqs and Amps Before and After Filtering ... 137
Figure 5.8: Token 5 H2 and H3 Freqs and Amps Before and After Filtering ... 138
Figure 5.9: Token 6 H2 and H3 Freqs and Amps Before and After Filtering ... 139
Figure 5.10: Plots of Test Scores and Structural Measurements on Same Axes ... 141
List of Tables
Table 1.1: Summary of Digitized Vocalization Collections ... 22
Table 1.2: Summary of Bobcat Vocalization Features ... 41
Table 1.3: "Alpha" Significance Levels based on a 2-sided T-test ... 44
Table 2.1: Summary of Cheetah Descriptions (by Collection) ... 52
Table 2.2: Summary of Cheetah Descriptions (by Type) ... 54
Table 3.1: Experimentally Derived Element Values ... 64
Table 3.2: Predicted Low-Frequency Behavior of Middle Ears ... 66
Table 3.3: Calculated Center Frequencies and Bandwidths of the GCAV Dip ... 68
Table 3.4: Comparisons of GCAV Implementation to Theory ... 83
Table 5.1: Summary of Symbols used to Classify Perceived Pre-Post Differences ... 105
Table 5.2: Preliminary Perceptual Judgments for the BC-I Collection ... 107
Table 5.3: Preliminary Perceptual Judgments for the BC-II Collection ... 108
Table 5.4: Preliminary Perceptual Judgments for the BC-III Collection ... 108
Table 5.5: Preliminary Perceptual Judgments for the BC-IV Collection ... 109
Table 5.6: Preliminary Perceptual Judgments for the BC-V Collection ... 109
Table 5.7: Preliminary Perceptual Judgments for the CH-I Collection ... 110
Table 5.8: Preliminary Perceptual Judgments for the CH-II Collection ... 111
Table 5.9: Preliminary Perceptual Judgments for the CH-III Collection ... 112
Table 5.10: Summary of Perceptual Judgments for all 8 Vocalization Collections ... 113
Table 5.11: Listening Test Tokens ... 119
Table 5.12: Identification Test Results ... 120
Table 5.14: Alpha Values for Identification Scores (the Probability that Scores Could be
Equalled or Exceeded by Chance Alone) ... 126
Table 5.15: Alpha Values for Discrimination (ABX) Test Scores (the Probability that Scores Could be Equalled or Exceeded by Chance Alone) ... 127
Table 5.16: Structural Measurements and Correlations to Listening Test Results ... 140
Table 5.17: Noise and Vocalizations Selected for Listening Test ... 147
Introduction
Vocalizations are a common way for mammals to communicate with one another. Researchers studying vocal communication in humans have broken the process down into a series of stages called the "Speech Communication Chain". A vocalization is thought to begin when the sender's brain initiates the elaborate control of the mechanisms in the chest, glottis, and vocal tract necessary to transform it from a thought into a sound. As a sound travelling through the air, a vocalization is subject to environmental factors that may, for instance, affect its amplitude, frequency content, and noisiness. Eventually the vocalization enters the ear of the receiver, passing through the outer ear, middle ear, and the inner ear, where it is transformed into nerve signals that are sent to the receiver's brain to be perceived.
This thesis involves vocal communication in two felid species, the bobcat and the cheetah, and focuses on the transmission of sound through the middle ear. Figure 0.1 shows a rendition of the vocal communication chain for felids, depicting a sender, a receiver, and an enlarged view of the receiver's outer, middle, and inner ear. The middle ear in the figure contains a linkage of small bones (called ossicles) that couple motion of the tympanic membrane to motion at the entrance to the cochlea (called the oval window). In addition to these bones, the middle ear features two air cavities connected by a small opening. The cavity containing the ossicles, called the tympanic cavity, is connected to an empty cavity, called the bullar cavity, by a short and narrow airspace called the foramen. A bony septum serves to separate the two air cavities.
The reason that this thesis focuses on the middle ears of cats is that all 37 felid species feature the characteristic structure described above, and that in many cases this structure has an interesting effect on the transmission of an acoustic signal from the ear canal to the cochlea.
SENDER
RECEIVER
7
Vocali7atifn through airtravekossicles oval win ow pinna ear canal cochlea tympanic membrane
tympanic cavity auditory nerve
(to brain) septum
foramen bullar cavity
OUTER MIDDLE- INNER
EAR EAR EAR
Figure 0.1: Vocal Communication Chain
Stages of vocal communication in felids: a vocalization leaves the mouth of the sender, travels through the air and passes through the ear of the receiver. An enlarged view of the receiver's ear is supplied, showing the basic fea-tures of the outer, middle, and inner ear. The middle ear is the region between the tympanic membrane and the entrance to the cochlea (oval win-dow). In cats it consists of two air spaces (tympanic cavity and bullar cav-ity) separated by a bony septum and connected by a small opening
(foramen). A linkage of small bones (ossicles) connects the tympanic membrane to the oval window, transmitting sound from the outer ear to the
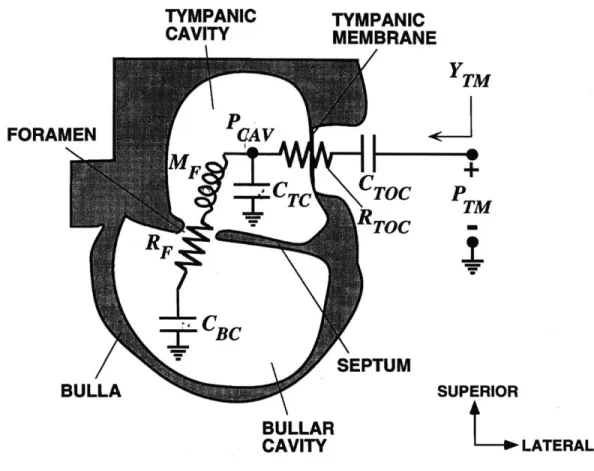
Figure 0.2 depicts an enlarged cross-sectional view of the felid middle ear, without the ossicles or oval window shown. The transfer function from the ear-canal pressure (PTM) to the pressure difference across the tympanic membrane (PTM-PCAV) is called the "cavity gain" (GCAV), and is equal to (PTM-PCAV)IPTM. The cavity gain represents the first stage in the transmission of sound through the middle ear, and in many felid species it acts like a notch filter, attenuating the transmission of a narrow band of frequencies. See Figure 0.3 for a Bode plot showing the notch filter behavior of the middle ears of domestic cat and lion.
The cavity gain is viewed in this thesis as a filter that affects the structure of a vocal-ization on its way from the ear canal to the cochlea in a manner that depends on the mechanical properties of the tympanic membrane, cochlea, and ossicles, as well as the acoustic properties of the air spaces in-between.
The particular range of frequencies attenuated by the middle ear depends on the vol-umes of the cavities and dimensions of the foramen; this fact makes it possible to construct a model of the middle-ear cavity gain based on measurements of these quantities (see Chapter 3). Since the cavity volumes and foramen dimensions vary across species, one would expect the location of the notch to be species-dependent, as is indicated in Figure
TYMPANIC CAVITY FORAMEN TYMPANIC MEMBRANE
I
P
TM SEPTUM SUPERIOR BULLAR CAVITY L LATERALFigure 0.2: Felid Middle-Ear Structure, Cross-Sectional View
Cross-sectional view of the felid middle-ear airspaces. The ear canal would be attached to the right of the tympanic membrane and the oval window to the cochlea would lie somewhere on the left wall of the tympanic cavity. The ossicles have been omitted from the picture. The two pressures, Pa and PCAV represent the pressures in the ear canal adjacent to the tympanic membrane and inside the tympanic cavity respectively. PCAV depends not only on the airspaces, but also on the mechanical properties of the tym-panic membrane, ossicles, and cochlea. These two pressures are used for computing the cavity gain, a quantity that models one step in the transmis-sion of sound through the middle ear (see Chapter 3). [Adapted from Huang, et al., 2000]
G
CAV=(P -P
TM CAV)/P
TM 10 -CATA 1 ... --- -0 0.1 1 10 FREQUENCY (kl-z)Figure 0.3: Measured Middle-Ear Cavity Gain for Domestic Cat and Lion
Bode plots of experimentally determined cavity gains for a domestic cat and lion ear. Sound transmission for low frequencies is not substantially affected by the middle ear, but for a narrow band of frequencies in the midrange the middle ear strongly attenuates sound transmission. The center frequency and bandwidth of the notches is dependent on the structure of the middle ear (see Chapter 3), and is species-dependent. [From Huang et al., 1997b]
A question that this thesis addresses is: does the middle-ear notch play an important role in the communication between members of a given species? To see why this appears worth investigating, refer to the spectrogram of a cheetah vocalization shown in Figure 0.4. Notice the dark horizontal bands, harmonics, present in the spectrogram. The harmon-ics occur with a regular spacing equal to the fundamental frequency, which in this case is the frequency of the lowest harmonic. Thus, if the fundamental frequency changes, the fre-quencies of the higher harmonics will change by an integer multiple of that change.
8 CH-III-12
Vocalization Identifier (see Chapters 1 and 2)
6 5 3 2 Harmonics 2 0 176001770017800 179001800018100 1820018300 184001850018600 1870018800 TIME (ms)
Figure 0.4: Cheetah Vocalization, to Illustrate Harmonic Structure Spectrogram of a vocalization by an adult male cheetah (see Chapters 1 and 2) with four clearly visible harmonics. The horizontal axis is time, the vertical axis is frequency, and the darkness of the image represents magni-tude. Thus, the spectrogram displays the time-varying frequency content of the vocalization. The frequency of the lowest harmonic, called the funda-mental frequency, is also the spacing between adjacent higher harmonics. Consequently, changing the fundamental frequency affects the frequency and spacing of all higher harmonics.
One might imagine a scenario in which two similar-sounding vocalizations, A and B, with regular harmonic structure, vary slightly in fundamental frequency such that A fea-tures a harmonic located at the frequency of the notch, but the analogous harmonic in B lies below the notch. The middle ear would then attenuate a harmonic in A but leave the harmonics in B undiminished. If the version of A with the attenuated harmonic sounds sig-nificantly different from the original version, then (considering that A and B sounded sim-ilar initially) one would expect the middle-ear filtered versions of A and B to be significantly more discernible than the unfiltered versions. In such a scenario the middle-ear notch could be exploited by the sender as a mechanism for creating recognizably dif-ferent-sounding vocalizations through small variations of the fundamental frequency. As
such, the sender could use this mechanism to its advantage, turning on or off the effects of the dip to fit different expressive needs (see Chapter 4).
This thesis seeks to test the hypothesis that the notch found in the middle-ear transmis-sion of many felid species enhances the discriminability of the vocalizations produced by the same species (see Chapters 5 and 6). To go about testing this, one must have record-ings available of vocalizations made by individuals of the species of interest, as well as enough information about the species' middle-ear structure that the filtering effects can be simulated and the results studied. The two felid species studied here, the bobcat and the cheetah, were selected because these necessary pieces of information were available.
Part I of this thesis (Chapters 1 and 2) contains descriptions and summaries of the structure of the available bobcat and cheetah vocalizations, along with information that could be useful to someone interested in the vocalizations. Some of this information will be referred to in later chapters.
Part II (Chapters 3-6) covers the construction of the middle-ear models and filter simu-lation, an elaboration of the communication hypothesis, tests of the hypothesis using the recordings and simulated middle ears, and a discussion of the results.
Part I: Vocalization Descriptions
Background
In a paper from the late 1970's, six types of domestic cat vocalization were each found to result from different behavioral situations (Brown and Buchwald 1978). Quantitative mea-surements and sample spectrograms were included to show structural differences between the vocalization types and efforts were made to discover how vocalizations changed with the age of the cats. According to a summary of papers compiled by Peters and Wozencraft in 1989, of 13 papers written before 1989, two offered a comprehensive treatment of domestic cat vocalizations. Considerably fewer papers have been written on the vocaliza-tions of bobcat (Lynx rufus) and cheetah (Acinonyx jubatus), the two species dealt with in this thesis: I have identified two non-comprehensive papers on bobcat vocalizations, and five non-comprehensive papers on cheetah vocalizations. One of the papers looked care-fully at eurasian lynx vocalizations, but included comparisons to bobcat vocalizations (Peters, 1987). This paper included descriptive names of the vocalization types (such as mew, purr, and yowl) as well as a few quantitative measurements, spectrograms, and sum-maries of the behavioral and functional contexts of the vocalizations to serve as a more objective basis for the categories that were defined. In a more recent paper on the cheetah (Ruiz-Miranda et al, 1998), researchers studied the vocalizations of male cheetahs during separation and reunion experiments, including some quantitative measurements and sam-ple spectrograms (Ruiz-Miranda et al., 1998).
This thesis uses a series of recordings made and supplied by Dr. G. Peters (Bonn, Ger-many) of captive bobcats, which appear to be the same vocalizations he called "mews" in his 1987 paper, as well as a collection of vocalizations of captive cheetahs called "stut-ters", "eeaows", and "chirps" supplied by Stuart Wells (National Zoo, Washington, D. C.).
The recordings of bobcat include some information about the age and sex of the cats mak-ing the vocalizations, though specific information about their behavioral context is not available. Some contextual information was available for the cheetah vocalizations.
The goals of Part I are to present vocalization spectrograms, describe their features, and determine measures of some features in the structure of bobcat and cheetah vocaliza-tions, as well as to familiarize the reader with vocalization structure well enough that aspects of it can be referred to in Part II.
Chapter 1
Bobcat Vocalizations
1.1 Methods
The methods used in studying the bobcat vocalizations are described in Sections
1.1.1-1.1.4 below, and are essentially the same as those used to study the cheetah vocalizations.
Any differences in procedure for cheetah will be noted in Chapter 2. 1.1.1 Digitizing
To allow the vocalizations to be analyzed on a computer, the tape recordings needed to be digitized. Each recorded series of vocalizations was maintained intact in a separate digi-tized file; the boundaries of these series were often easily identified from audible clicks made when the recorder turned on and off. Digitization was accomplished with equip-ment at the Speech Communication Lab at MIT's Research Laboratory for Electronics (RLE), which is normally used for digitizing human speech. The vocalizations were passed through an antialiasing filter with a cutoff frequency of just under 8000 Hz and sampled at a rate of 16,129 samples per second. The digitized recordings were saved in a file format called Klatt .wav which is used often in the Speech Communication Lab. 1.1.2 Cataloging Scheme
The bobcat recordings were supplied by Gustav Peters from the Zoologisches Fors-chungsinstitut und Museum Alexander Koenig in Bonn, Germany. Five vocalization series were digitized from these recordings. These collections were named BC-I, BC-II, BC-III, BC-IV, and BC-V. "BC" denotes bobcat and Roman numeral designations were chosen arbitrarily to denote each collection. Identification of a particular vocalization is accom-plished by appending an Arabic numeral to the collection name. For example, the first vocalization in the BC-I collection is called BC-I-1, and the second, fourth and fifth vocal-izations in the BC-II collection can be referred to at once as BC-II-(2, 4, 5). The same
style of identification is used for the three cheetah collections covered in Chapter 2, with the two letter prefix "CH" used instead of "BC" (CH-I, CH-II, and CH-III).
Table 1.1 summarizes the bobcat and cheetah materials examined in Part I. The table lists the length (in seconds) of each collection, which was determined (approximately) by measuring the number of seconds from the time the recorder was turned on to the time it was turned off, based on the audible clicks in the recordings. The number of vocalizations was determined by counting how many clearly audible vocalizations were present in each collection. Information about the sex and identity of the cats responsible for vocalizations in each collection was based on recorded comments on the bobcat tape and on communi-cations with the source of the cheetah tape (S. Wells). According to the comments on the bobcat tape, the same female is present in BC-I, II, IV, and V. The same male is present in BC-IV and V, but whether the male in BC-III is the same is not known. Additionally, Peters was not able to attribute individual sounds in BC-IV and V to either the female or the male in those collections. See Chapter 2 for discussion of the cheetah collections.
Table 1.1 also supplies statistical summaries of the vocalization durations (which are listed in milliseconds) including the mean, standard deviation, smallest value, and largest value. The "silent interval," the time elapsed the end of one vocalization to the beginning of the next, influences the vocalization rate. The same statistical measures are supplied for the silent interval. For a visual summary of the temporal features of the collections, indi-cating graphically the approximate duration and temporal placement of each vocalization on a timeline, refer to Appendix 1 for bobcat and Appendix 2 for cheetah.
Measures BC-I BC-II BC-III BC-IV BC-V CH-I CH-II CH-II1 1. Length (s) 26 31 16 35 50 39 22 47 2. # of Vocs. 13 9 8 7 7 17 12 30 3. All Vocs 15 17 13 33 42 34 18 47 Within (s) 4. # seconds/ 1.2 1.9 1.6 4.7 6.0 2.0 1.5 1.6 Vocalization Cats Present 1-f 1-f 1-m 1-m, 1-m, 1-m 1-m 1-m
(#-sex) 1-f 1-f (or more)
Mean 453 530 766 2760 3142 569 405 494 Std. Dev. 90 149 407 2055 2242 348 135 81 Min. 246 333 359 441 471 45 240 311 Max. 560 791 1752 5212 6206 1300 711 702 Mean 706 1482 838 2088 3271 1521 1109 1050 Std. Dev. 285 1002 193 2068 2342 1709 487 493 Min. 494 631 527 223 909 58 388 362 Max. 1519 3611 1143 6494 6342 5784 1857 2047
Table 1.1: Summary of Digitized Vocalization Collections
Each of the five bobcat collections (BC-I, II, III, IV, and V) and three cheetah collections (CH-I, II, and III) is summarized in terms of: the overall collection length (in seconds), the number of vocalizations in the collection, the time range within which all vocalizations fall (row 3), the average number of
sec-onds for each vocalization (row 4 = row 1/ row 2), the sex of each cat vocaliz-ing in the collection, descriptive statistics concernvocaliz-ing the vocalization
durations within the collection (all measured in milliseconds), and the same statistical measures on the lengths of the silent intervals found between adja-cent vocalizations on the original recordings.
1.1.3 Analysis Software
Analyses of vocalization structure werc performed with a software package developed for human speech at the RLE Speech Communication Lab, called "xkl". This software dis-plays the waveform, the Fourier transform of a windowed section of the waveform, and spectrograms, and includes audio playback capabilities. It provides a convenient way to navigate through a collection of vocalizations, to listen to any subportion of the collection, to display the frequency behavior over time in the spectrogram, and to focus more pre-cisely on the frequency content of a particular time window in the Fourier transform dis-play.
1.1.4 Methods of Describing Vocalization Structure
The first step taken in studying the structure of vocalizations was to listen to them a few times to get a feel for their durations, pitch, placement relative to one another, timbre, etc. Next I listened to them while looking at spectrograms of each vocalization to see what types of connection could be made between auditory perception and the spectrogram's structure. The analysis methods I ended up using, described below, are an effort to sum-marize a variety of structural features in a way that would make it possible to compare the features for different vocalizations, collections, and species. Appendices 1 and 2 contain a compilation of spectrograms for all vocalizations studied. The remainder of this section contains explanations of the six kinds of measurement and observation that were made on the vocalizations (usually by examining the spectrograms). Summaries of the actual obser-vations and measurements can be found in Section 1.2 for bobcat (2.2 for cheetah), Table 1.2 for bobcat (2.1 for cheetah), as well as Appendix 1 for bobcat (Appendix 2 for chee-tah). In the catalog of spectrograms found in Appendices 1 and 2, the margins contain mis-cellaneous observations and measurements made on individual vocalizations. Figures 1.1 and 1.2 below are intended to indicate the meaning of the measurements and observations
Measurements and Observations made on Bobcat and Cheetah Vocalizations: 1. Length: Number of seconds in a collection.
2. Duration: For each digitized collection, the starting time and ending time of each vocalization was measured (in milliseconds). In cases where the beginning or ending appeared faint in the spectrogram, or unclear in the time waveform, it was estimated. Duration, then, is the difference between the ending time and beginning time of each vocalization. See Figure 1.1 for a visual indication of vocalization duration.
3. Frequency Range: This was judged by looking at the spectrograms of the collection
and roughly noting the lowest and highest frequency between which the spectral content of the vocalizations was visible. See Figure 1.1 for a visual indication of the frequency range of a single vocalization.
4. Pitch Contour: This was a harder concept to define precisely. It refers to the way the frequency of the lowest visible harmonic varies with time. The difficulty came when the lowest harmonic failed to form a continuous line but instead became invisible (or indistin-guishable from noise) over some portion of its length. Because of such cases it was not always possible to describe the pitch contour by looking only at the lowest harmonic, but often its overall trend could be determined by observing the path taken by the higher har-monics. Instead of making a large number of measurements to graphically summarize the pitch contours, a system was devised for notating their general behavior. A "U" is used if a contour moves uipward during a time interval, a "C" is used if it flattens out and becomes constant for some interval, and a "D" is used if it moves downward. With these symbols, pitch contours were reduced to a sequence of the symbols "U", "C", and "D". See Figure
1.1 for a visual indication of a pitch contour. While the "U", "C", "D" notation is neither
Because many pitch contours reached a clear high point, or "peak" at some time along their length, an effort was made to measure the time and frequency of these highpoints using the following notation:
HI [or FO] @ NNN
ms
= MMM Hz [peak]Depending on the harmonic structure of a given vocalization, the lowest visible harmonic may or may not appear to be the fundamental frequency. "H" or "FO" is used accord-ingly. "@ NNN ms" indicates that the measurement was made at the time point of NNN
ms in the digitized collection, and "= MMM Hz" means that the value of the measurement is MMM Hz. When the word "peak" appears at the end, the measurement constitutes the highpoint of the pitch contour. In some cases additional measurements were made at rela-tively flat segments of the pitch contour other than the peak. In such cases the same nota-tion as above is used, omitting the word "peak". Measurements of this kind can be found in the margins of the spectrogram catalog of Appendices 1 and 2. See Figure 1.1 for a visual indication of a peak in a pitch contour.
Often an attempt is made to determine where, relative to the center of a vocalization, the peak of the pitch contour appears to occur. Specifically, I attempt to point out cases when the peak appears to occur earlier, later, or near the center of a vocalization.
5. Frequency Content: This category describes the amplitudes of the frequency com-ponents within a vocalization, as judged by the darkness of the spectrogram images. The amplitude-to-darkness mapping for the spectrograms within a given collection is the same, so regions of equal darkness should correspond to equal sound pressure level. When com-paring vocalizations from different collections, however, equal darkness probably does not correspond to equal sound pressure level, because recording conditions and level settings are likely to be different for each collection. Additionally, the spectrograms only make
vis-vocalization features may not be visible in the spectrograms, but they may still be visible in conventional Fourier transforms of windowed portions of the vocalization. Most obser-vations concerning the frequency content of vocalizations were made by looking at their spectrograms, but on some occasions I referred to a Fourier transform to clarify features that were difficult to see in the spectrogram.
In the spectrograms, it is often possible to see dark horizontal bands, or harmonics, within the vocalizations. Sometimes these harmonics are continuous and smoothly-vary-ing in darkness, suggestsmoothly-vary-ing that their amplitudes do not change quickly over their length. In other cases they feature sudden darkness changes, suggesting that their amplitudes vary abruptly.
Many vocalizations feature regions that lack clear structure and consist of various shades of gray. When the grayness appears only within the vocalization (as opposed to in the background surrounding the vocalization), I refer to it as "vocalized noise". See Figure
1.1 for an example. Sometimes vocalized noise has a high-enough amplitude to obscure
the harmonic structure of a vocalization (see the BC-I collection especially), but other times it does not seriously hinder the visibility of harmonics (see BC-II for example). For vocalizations that appear to contain a large amount of vocalized noise I often comment to that effect in the margin notes of Appendices 1 and 2. Another type of noise present in the spectrograms is background noise. It can be distinguished from vocalized noise in that it is present in portions of the spectrogram where there are no vocalizations. Sometimes the background noise looks like a band of random gray spectral content spread over a pro-longed length of time and sounds as though it is caused by wind, traffic, or the roar of air-planes for example. This type of background noise is present in all of the collections to varying degrees, though especially obvious examples of it can be found in the BC-III col-lection. When the spectrogram image of background noise appears to have a non-random
structure, that may indicate that it was produced by events such as birds singing, objects hitting the microphone, or pieces of metal clanging. An example of this type of back-ground noise is indicated on the right-hand side of Figure 1.1.
6. Additional Features: I use this observation category to point out structural features
of vocalizations that seem worthy of special mention. For instance, I might point out cases in which a vocalization features regular pulsed amplitude modulation and mention the approximate rate, or where some vocalizations sound qualitatively different from the oth-ers in the collection. See Figure 1.2 for a visual indication of pulsed amplitude modulation in a bobcat vocalization (for more elaborate examples in cheetah vocalizations, see the
8 BC-I-8 7 6 2 ~L
11L~ ~
V 1, .J1 J Noise, Noise 4Z 128001290013000131001320( 133 01 0 135001360013700138001390014000 OE s) urionPitch Contour: "U" "C" "D"
H1 peak (13 6 Hz at 13358 ms)
Figure 1.1: Examples of Observation and Measurement Categories
Spectrogram of a bobcat vocalization (BC-I-8) with visual pointers to examples of various observation and measurement categories. The vocal-ization duration is indicated by a double-sided arrow extending from the beginning to the end of the vocalization. The frequency range is indicated
by a double-sided arrow extending from the lowest to the highest frequency
containing the vocalization's image. The pitch contour is indicated by dividing the time scale into regions for which the lowest harmonic is increasing in frequency with time ("U" for upward), remaining roughly constant ("C"), and decreasing with time ("D"). The highpoint of the pitch contour is indicated by the "Hl peak" label. Two examples of background noise are labeled and encircled. The rightmost example sounds like some-thing is hitting the microphone. Finally, an example of vocalized noise is encircled in white near the top of the vocalization. The vocalized noise may be present over a wide frequency range, but it is easier to see by itself in the higher frequency range where the harmonics (dark horizontal bands) are weaker.
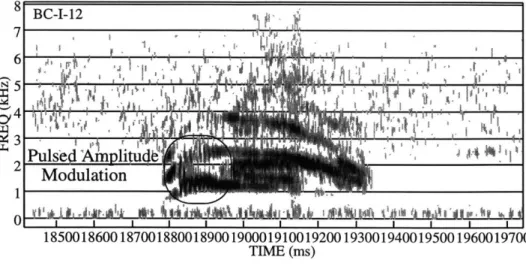
8 BC-I-12 7 5 3 Puls'e m nlitu Modulation 1 0 18500186001870018800189001900019100192001930019400195001960019700 TIME (ms)
Figure 1.2: Example of Pulsed Amplitude Modulation
Spectrogram of a bobcat vocalization (BC-I- 12) with a line surrounding the region containing pulsed amplitude modulation. Approximately 9 pulses occur within a 100 ms interval, for a rate of around 90 pulses per second.
1.2 Results
The comments contained in the margins of Appendices 1 and 2 are not complete descriptions of the vocalizations; they are intended to guide one's examination of the spec-trograms.
At the beginning of each collection in the Appendices is a summary of the observa-tions and measurements made on the vocalizaobserva-tions in that collection (see Section 1.1.4), as well as a graphical rendition of the collection as a timeline with symbols representing vocalizations placed and scaled (within 100 milliseconds) in their approprate time inter-vals within the recording.
1.2.1 BC-I Collection
(see pp 159-164 of Appendix 1)
The 13 vocalizations found in this 26 second collection were produced by an adult female bobcat (the same female represented in BC-II, IV, and V). All 13 vocalizations occur within a 15 second interval (see timeline on page 160 of Appendix 1), with the spac-ing between vocalizations rangspac-ing from 494 to 1449 ms (mean: 706, standard deviation:
285). Vocalization duration ranges from 246 to 560 ms (mean: 453, standard deviation: 90). Spectrograms of four of the vocalizations in this collection (BC-I-(9-12)) can be
found in Figure 2 (p. 321) of Peters, 1987, where the caption referring to vocalizations 9 and 10 reads "medium intensity mews by a female", and for 11 and 12 reads "mews of low and medium intensity by a female. The calls show rhythmical amplitude modulation". In voice comments on the tape, Peters describes the vocalizations in this collection as being recorded at a high level with heavy background noise.
Frequency Content
The spectrograms of this collection (see pp 161-164 of Appendix 1) display frequency content ranging from 0.6 to 7 kHz. Harmonic structure is evident in the presence of dark horizontal bands in the spectrograms, but it is usually obscured by the large amount of vocalized noise present in the vocalizations of this collection. The lowest visible harmonic typically occurs around 1 kHz, and it is often possible to find higher harmonics whose fre-quencies appear to occur at (nearly) integer multiples of this lowest harmonic frequency. However, apparent harmonic content is usually visible between these widely spaced har-monics for at least part of the vocalization, suggesting that the lowest visible harmonic is actually not the fundamental frequency (FO), but probably two times FO. For this reason I refer to the lowest harmonic as HI rather than FO when I make measurements on it. Many of the harmonics, when they are visible, vary irregularly and abruptly in amplitude.
A large amount of "vocalized" noise is present in vocalizations of this collection,
evi-denced by the dark gray content filling the frequency range and the spaces between har-monics. I attribute much of my difficulty in clearly seeing the harmonic structure to the presence of this noise.
Vocalizations BC-I-(1, 2, and 3) are fairly weak, based on the faintness of their spec-trogram images relative to the others in this collection (they sound weaker as well). Vocal-izations BC-I-(4-9) are stronger and appear similar to one another: they have a large frequency range, contain "vocalized" noise, and their harmonic amplitudes are irregular, judging by the splotchiness of their spectrogram images. Vocalizations BC-I-(10-12) have a narrower frequency range, with widely spaced harmonics at the beginning, and in each spectrogram it appears that two narrow-band components just above H1 begin 50 and 150 ms after the beginning. The darkest content in this collection generally appears between 1 and 3 kHz, with the lowest harmonic sometimes, but not always the most prominent.
Pitch Contour
The lowest harmonic in all of these vocalizations rises in frequency at the beginning and falls in frequency at the end. In between it typically rises to peak relatively close to the beginning, flattens momentarily before falling to a lower flat point, or flattens for a good portion of the vocalization before falling at the end. In terms of the pitch contour notation, these vocalizations are called either "UCD" or "UCDCD". The fact that the peak often occurs near the beginning of the vocalizations makes the pitch contours appear skewed toward the beginning of the vocalizations. The audible result of this is that the pitch of the vocalizations rises abruptly near the beginning then decreases a little more gradually afterward. The HI peak frequency measurements ranged from 1040 to 1449 Hz, (mean: 1294, standard deviation: 105).
Additional Features
Vocalizations BC-I-(10, 11, and 12) feature pulsed amplitude modulation near their beginnings, indicated by the periodic amplitude variation visible in the spectrograms. Only around 2 pulses are clearly visible in BC-I-10, around 6 in BC-I-11, and around 9 in BC-I-12. The pulse rate is roughly 90 per second in all three cases.
1.2.2 BC-I Collection
(see pp 165-169 of Appendix 1)
The 9 vocalizations found in this 31 second collection were produced by an adult female bobcat (the same female represented in BC-I, IV, and V). All 9 vocalizations occur within one 17 second interval (see timeline on p. 166 of Appendix 1), with the spacing between vocalizations ranging from 631 to 3611 ms (mean: 1482, standard deviation: 1002). Vocalization duration ranges from 333 to 791 ms (mean: 130, standard deviation: 149). On the tape Peters mentions that the vocalizations in this collection were recorded at a high level with heavy background noise. No spectrograms from this collection are pre-sented in Peters, 1987.
Frequency Content
The spectrograms in this collection (see pp 167-169 of Appendix 1) display frequency content ranging from 0.6 to 7 kHz (as in BC-I). Harmonic structure is evident, perhaps more clearly than in BC-I. As in BC-I the lowest visible harmonic appears to be twice the fundamental frequency. Some harmonics form smooth continuous lines and others appear to cut in and out abruptly. There appears to be vocalized noise present, though perhaps less overall than BC-I. The darkest spectrogram content typically occurs between 1.2 and
Pitch Contour
As in BC-I, the lowest harmonic rises at the beginning and falls at the end, leading to several vocalizations with "UCD" contours. Others follow a more complicated path in between, such as "UCDCUCD" (BC-II-1), or "UCUCDCD" (BC-II-7). The contours also differ from BC-I in that many of the peaks occur near the center (BC-II-(4, 5, 8, and 9)) or to the right of center (BC-II-(2 and 3)) of the vocalizations. The HI peak measurements ranged from 945 to 1166 Hz (mean: 1078 Hz (close to a minor third below BC-I's mean), standard deviation: 78 Hz).
Additional Features
Pulsed amplitude modulation occurs at the beginning of vocalization BC-II-7. Around
6 pulses are visible, with a rate of approximately 85 pulses per second. Vocalization BC-11-9 appears to have around 17 closely spaced pulses in its middle section, for a rate of
around 140 pulses per second. Comparisons to BC-I
The same adult female bobcat was responsible for the vocalizations in BC-I and BC-II. Compared to BC-I, BC-II has the same frequency range, a slightly longer average duration
(77 ms longer on average), and a considerably longer average silent interval (776 ms
longer).
The harmonic amplitudes in both collections tend to vary irregularly, though in BC-II the harmonics are generally easier to see. Both collections feature a fair amount of vocal-ized noise.
The pitch contours in BC-II, like those in BC-I, follow a "UCD" pattern or a variant with more complicated pitch changes in the middle. Unlike BC-I, the HI peaks in BC-II tend to occur closer to the center or end of the vocalization (as opposed to occuring closer
to the beginning). The average peak frequency of HI for BC-II is 216 Hz lower than that of BC-I (comparable to the musical interval of a minor third). Both of these differences are audible when listening to these two collections.
Vocalization BC-II-7 features pulsed amplitude modulation, at a rate comparable to that of vocalizations BC-I-(10, 11, and 12).
See Table 1.2 for comparisons among all 5 bobcat collections. 1.2.3 BC-Ill Collection
(see pp 170-174 of Appendix 1)
The 8 vocalizations found in this 16 second collection were produced by an adult male bobcat. All 8 vocalizations occur within one 13 second interval (see timeline on p. 171 of Appendix 1), with the spacing between vocalizations ranging from 527 to 1143 ms (mean:
838, standard deviation: 193). Vocalization duration ranges from 359 to 1752 ms (mean: 766, standard deviation: 407). BC-III-3 is too weak to analyze, so only 7 vocalizations
were studied. In Table 1 of Peters, 1987 (p. 321), Peters refers to a collection of 7 male bobcat vocalizations, which probably is the same as these 7. The spectrograms of BC-III-(1 and 2) appear in Figure 2 on p. 321 of Peters, 1987. The caption reads: "Mews of low intensity by a male". Peters states on the tape that it was recorded at a high level with very heavy background noise.
Frequency Content
The spectrograms of this collection (see pp 172-174 of Appendix 1) display frequency content ranging from 0.5 to 4 kHz (lower on both ends than BC-I and II), with occasional content reaching as high as 7 kHz. Harmonic structure is clearly evident, although the harmonics are difficult to see at times due to their weak overall amplitudes. Harmonics, when strong enough to be visible, appear smooth and continuous. "Vocalized" noise appears to be minimal, though this is difficult to tell with the very heavy background noise
added to the vocalizations. Harmonic spacing is at integer multiples of the lowest fre-quency, so the lowest harmonic occurs at the fundamental frequency (FO). Often the spec-trogram image is darkest near the end of the vocalization, e.g. BC-III-(2, 3, 5, 6, 7, and 8),
at which point as many as seven harmonics may become visible. The darkest band of the vocalizations usually occurs between 1 and 3 kHz.
Pitch Contour
As in BC-I and 1I the contour rises at the beginning and falls at the end. Most vocal-izations, then, are "UCD", though BC-III-(1 and 4) are more complicated ("UCDCD" and
"UCDCDCD" respectively). As the harmonics were generally weak and hard to see in the
vocalizations, I could not always find definitively where the peaks occur. Since most vocalizations were relatively flat in frequency versus time over their highest range, the measurements I included with the spectrograms in Appendix 1 still give a good feel for the upper limit of the pitch contour. From what I can tell the peaks occur closer to the begin-ning in BC-III-(1, 4, and 5), and near the center in BC-III-(2, 3, 6, 7, and 8). FO measure-ments ranged from 819 to 914 Hz (mean: 869 Hz (a little less than a perfect fifth below the BC-I mean), standard deviation: 29 Hz).
Additional Features
Vocalization 4 is significantly longer and more intense than the others in this collec-tion.
Comparisons to BC-I and BC-II
A single adult male bobcat was responsible for all of the vocalizations in BC-IlI,
whereas the vocalizations in BC-I and II were made by an adult female bobcat. The fre-quency range of BC-III is slightly lower at the lower limit and usually around 3 kHz lower at the upper limit than BC-I and II. Average vocalization duration is considerably longer
than BC-I and 11 (300 and 236 ms longer respectively), and the mean silent interval falls between that of BC-I and II (154 ms longer than BC-I and 644 ms shorter than BC-II).
The harmonic amplitudes in BC-IlI are smoother than those in BC-I and II, but the harmonics are often too weak to see in the spectrograms relative to the background noise. The background noise in this collection is substantially heavier than BC-I and II. There is probably less vocalized noise in BC-III than BC-I and II based on the smoother sound of its vocalizations and the smoother-looking harmonics in the spectrograms.
Unlike BC-I and II, the lowest harmonic in the BC-IlI vocalizations occurs at the fun-damental frequency. Pitch contours follow the same sort of "UCD" pattern in all three col-lections, though the average peak FO frequency in BC-III was lower than both BC-I and II
(by 425 Hz (just under a perfect fifth) and 209 Hz (just under a major third) respectively).
None of the vocalizations in BC-IlI featured pulsed amplitude modulation. See Table 1.2 for further comparisons.
1.2.4 BC-IV Collection
(see pp 175-181 of Appendix 1)
The seven vocalizations found in this 35 second collection were produced by both an adult male bobcat (who is also in BC-V but may or may not be the same male found in BC-III) and an adult female bobcat (the same as found in BC-I, II, and V). All vocaliza-tions occur within a 33 second interval (see timeline on page 176 of Appendix 1), with spacing between vocalizations ranging from 223 to 6494 ms (mean: 2088, standard devia-tion: 2068). Vocalization durations vary from 441 to 5212 ms (mean: 2760, standard devi-ation: 2055). As the recording was made without watching the cats, it was not possible for Peters to attribute individual sounds to individual bobcats. Several different types of vocalization are present in this collection, including growls, hisses, and prolonged calls with varied, complex structures. Peters' comments on the tape recording refer to this and
the following collection as "diverse sounds", and the prolonged, mew-like sounds are referred to as having a "growly superposition of varying degrees; for some it is relatively strong." The background noise is mild.
Frequency Content
The spectrograms of this collection (see pp 177-181 of Appendix 1) display frequency content ranging from 0.1 to over 7 kHz. Harmonic structure is evident in BC-IV-(l, 2, 3, 4, and 7). The harmonic amplitudes are often pulse-modulated over a significant portion of the vocalization duration (e.g. BC-IV-4c and BC-IV-7c). Vocalizations on the whole appear to contain a good amount of "vocalized" noise.
Pitch Contour
No attempt was made to completely summarize the pitch contours of these prolonged vocalizations with the "U", "'C", and "D" symbols. The contours appear on the whole to be flat during the prolonged episodes (e.g. BC-IV-(3, 4, 7b-7d)), and sometimes near the beginning feature a "UCD" type behavior (e.g. BC-IV-7a). Some FO measurements were made over the course of the vocalizations (see spectrograms in Appendix 1) but they were not necessarily of peaks in the pitch contour.
Additional Features
Vocalizations 1, 2, 3, 4, and 7 are heterogeneous mew-like sounds with growly parts. Examples of growly parts are BC-IV-(4b-4d) and BC-IV-(7c-7d). Vocalization 5 sounds like breathing, and 6 sounds like a short growl followed by a "huff'.
Comparisons with BC-I, II, and III
The vocalizations in BC-IV were produced by two bobcats rather than a single individ-ual as in BC-I, II, and III. The range of vocalization duration in BC-IV (441 to 5212 ms) is far greater than that of the other collections, and both the mean and standard deviation are
high (mean: 2760 ms, std. dev: 2055 ms) due to the fact that BC-IV contains three vocal-izations that exceed four seconds in length and four vocalvocal-izations that are under two sec-onds in length. The prolonged vocalizations in BC-IV feature harmonic structure, a growly sound during parts of their duration, the appearance of vocalized noise, and gener-ally a complex, time-varying structure. These vocalizations differ substantigener-ally in structure from those of BC-I, II, and III, as is apparent by comparing the spectrograms in Appendix
1. BC-IV-(5 and 6) are short noisy sounds that differ from any of the other vocalizations
shown so far.
See Table 1.2 for further comparisons among bobcat collections.
1.2.5 BC-V Collection
(see pp 182-188 of Appendix 1)
The seven vocalizations found in this 52 second collection were made by the same adult male as in BC-IV, and the same adult female as in BC-I, II, and IV. All vocalizations occurred within a 42 second interval (see timeline on page 183 of Appendix 1), with spac-ing between vocalizations rangspac-ing from 909 to 6042 ms (mean: 3271, standard deviation: 2342). Vocalization durations varied from 471 to 6206 ms (mean: 3142, standard devia-tion: 2242). As in BC-IV, Peters was not able to attrbute individual sounds to individual cats. Diverse vocalizations are present, including snorts, growls, and mew-like sounds. Background noise is mild.
Frequency Content
The spectrograms of this collection (pp 184-188 of Appendix 1) display frequency content ranging from 0.1 to around 7 kHz, though most content lies below 4 kHz. Har-monics are evident in BC-V-(1, 2, 3, and 6). As in BC-IV, harmonic amplitudes often fea-ture pulsed amplitude modulation over some of their length (e.g. BC-V-2d and BC-V-3c).
Frequency content on the whole appears to have a good amount of "vocalized" noise added in.
Pitch Contour
The harmonic frequencies for the mew-like sounds of this collection, BC-V-(l, 2, 3,
6), appear flat for most of their length, with perhaps a small amount of curvature at times. A small number of FO measurements were made to give an idea of the frequency of the flat
portions (See the right-hand margins of the spectrograms displayed in Appendix 1). Additional Features
BC-V-(1, 2, 3, and 6) have harmonic structure and contain growly parts, 4 is a "snort-like" sound, 5 is a "hissy-growl-like" sound, and 7 is a growl.
Comparisons with BC-I. I, III, and IV
As in BC-IV there are two bobcats responsible for the vocalizations and the collection contains a number of vocalizations that last for several seconds. It also contains three vocalizations that are substantially shorter. As a result, the range of durations (471 to 6206 ms) is large and both the mean and standard deviation are also high (mean: 3142, std. devi-ation: 2242 ms). The prolonged vocalizations in BC-V resemble the prolonged vocaliza-tions in BC-IV, and the short sounds in BC-V are noisy and have unusual structures like the short sounds in BC-IV.
See Table 1.2 for additional comparisons.
1.3 Summary of Features
Table 1.2 below summarizes 15 features described in the Results section above, and facili-tates making comparisons among the five collections. The first column lists abbreviated names of the various features that were measured and described for the vocalizations, and the remaining 5 columns contain the appropriate entries for each of the 5 bobcat
collec-tions.
The first 6 features are reproduced from Table 1.1. Frequency Range (feature 7) indi-cates approximately the lowest and highest frequency reached by the vocalizations in a collection. The number in parenthesis for BC-III indicates the highpoint that best fits most of the vocalizations within the collection. Darkest Range (feature 8) indicates approxi-mately the range of frequencies within which the highest harmonic amplitudes occur. Har-monic Content (feature 9) indicates whether the vocalizations within a collection contain a significant amount of vocalized noise ("noisy") or not ("smooth"), or whether there is sub-stantial variation in the amount of vocalized noise present ("varied"). Fundamental Present? (feature 10) indicates whether the lowest harmonic is the fundamental frequency ("yes") or whether the lowest harmonic does not seem to occur at the fundamental fre-quency ("no"). Peak FO/HI (feature 11) indicates statistics for the measurements of the peak frequency of the lowest harmonic, based on data available in Appendix 1. No peak measurements were made on the vocalizations in BC-IV and V. Pitch Contours (feature 12) summarizes the common pitch contours of the vocalizations in a collection. Most entries are written in "U", "4C'', "D" notation (see Section 1.1.4) and are followed by a number in parenthesis indicating the number of vocalizations with the preceding contour. Mew-Like / Growly / Other (features 13-15) indicate how many vocalizations are similar to "mews" as described by Peters, how many contain a substantial amount of growliness (as heard upon listening), and how many do not fit either of these descriptions.
Feature BC-I BC-II BC-III BC-IV BC-V
1. # Vocalizations 13 9 8 7 7
2. Length (s) 26 31 16 35 50
3a. All Vocs w/in (s) 15 17 13 33 42
3b. # seconds per Voc 1.2 1.9 1.6 4.7 6.0
4. Cats Present 1-f 1-f 1-m 1-f, 1-m 1-f, 1-m
5. Duration: Mean 453 530 766 2760 3142
Standard Dev 90 149 407 2055 2242
Minimum 246 333 359 441 471
Maximum 560 791 1752 5212 6206
6. Silent Int.: Mean 706 1482 838 2088 3271
Standard Dev. 285 1002 193 2068 2342
Minimum 494 631 527 223 909
Maximum 1519 3611 1143 6494 6342
7. Freq. Range (kHz) 0.6-7 0.6-7 0.5-7 (4) 0.1-7 0.1-7
8. Darkest Rng. (kHz) 1-3 1.2-3 1-3 < 4 < 4
9. Harmonic Content noisy noisy smooth varied varied
10. Fund. Present? no no yes yes yes
11. Peak FO/H1: Mean 1294 1078 869 --
--Standard Dev. 105 78 29 --
--Minimum 1040 945 819 --
--Maximum 1449 1166 914 --
--12. Pitch Contours UCD(9) UCD(6) UCD(5) -flat -flat
UCDCD other(3) other(2)
(4)
13. Mew-Like 13 9 8 5 4
14. Growly 0 0 0 5 6
1.4 Discussion and Conclusions
The 5 bobcat collections were produced by at least 2 different bobcats (one male and one female), and they contain a reasonable variety of sounds. BC-I and II were produced by the same adult female, and appear and sound like they have much in common. The vocal-ized noise, irregular harmonic amplitudes, missing fundamental harmonic, identical fre-quency ranges, and UCD (or some variant) pitch contours all make them similar to each other. There are a few noticeable differences, however. The pitch contours in BC-I tend to peak near the beginning of the vocalization (often with a large positive slope at the begin-ning and a smaller negative slope at the end), whereas those of BC-II tend to peak closer to the center or end of the vocalization (often with a positive slope at the beginning that is equal or less than the magnitude of the negative slope at the end), a difference which is audible. The HI peak frequency is higher for BC-I than BC-II, the rate of vocalization is higher in BC-I, and the vocalized noise in BC-II does not appear to be as dense as in BC-I, all three of which are audible differences. Qualitatively, BC-II does not sound as harsh as BC-I.
BC-III was produced by a male bobcat. The vocalizations are lower in frequency than BC-I and II, are weaker (within very heavy background noise), and appear to lack any sig-nificant amount of vocalized noise. The pitch contours do not tend to exhibit large slopes, and generally vary gradually in frequency. Qualitatively, BC-Ill sounds substantially calmer than either BC-I or II.
BC-IV and V were both produced by a male and a female bobcat. Both of these collec-tions differ substantially from BC-I, II, and III in that the (tonal) vocalizacollec-tions are much longer in duration, and far more varied in structure. The short noisy vocalizations present in these 2 collections are also different from anything found in the first 3 collections. Growliness is prevalent in the prolonged vocalizations.