HAL Id: hal-01913509
https://hal.archives-ouvertes.fr/hal-01913509
Submitted on 25 May 2021
HAL is a multi-disciplinary open access
archive for the deposit and dissemination of
sci-entific research documents, whether they are
pub-lished or not. The documents may come from
teaching and research institutions in France or
abroad, or from public or private research centers.
L’archive ouverte pluridisciplinaire HAL, est
destinée au dépôt et à la diffusion de documents
scientifiques de niveau recherche, publiés ou non,
émanant des établissements d’enseignement et de
recherche français ou étrangers, des laboratoires
publics ou privés.
Cochlear Implants
Frédéric Venail, Thibault Mura, Mohamed Akkari, Caroline Mathiolon,
Sophie Menjot de Champfleur, Jean Pierre Piron, Marielle Sicard, Françoise
Sterkers-Artieres, Michel Mondain, Alain Uziel
To cite this version:
Frédéric Venail, Thibault Mura, Mohamed Akkari, Caroline Mathiolon, Sophie Menjot de Champfleur,
et al.. Modeling of Auditory Neuron Response Thresholds with Cochlear Implants. BioMed Research
International , Hindawi Publishing Corporation, 2015, 2015, pp.1 - 10. �10.1155/2015/394687�.
�hal-01913509�
Research Article
Modeling of Auditory Neuron Response Thresholds with
Cochlear Implants
Frederic Venail,
1,2Thibault Mura,
3,4Mohamed Akkari,
1Caroline Mathiolon,
1Sophie Menjot de Champfleur,
5Jean Pierre Piron,
1Marielle Sicard,
1Françoise Sterkers-Artieres,
6Michel Mondain,
1,2and Alain Uziel
1,21ENT Department and University Montpellier 1, University Hospital Gui de Chauliac, 34295 Montpellier, France
2Audiology Department I-PAudioM, INSERM U1051 Unit, Institute for Neurosciences of Montpellier, 34081 Montpellier, France 3Department of Medical Information and Biostatistics, University Hospital of Montpellier, Montpellier, France
4U 1061, CIC 1001, INSERM, 34295 Montpellier, France
5Neuroradiology Department, University Hospital Gui de Chauliac, 34295 Montpellier, France 6Audiophonology and Speech Disorders Department, Institute Saint Pierre, 34250 Palavas, France
Correspondence should be addressed to Frederic Venail; [email protected] Received 14 November 2014; Accepted 21 January 2015
Academic Editor: Chung-Feng Hwang
Copyright © 2015 Frederic Venail et al. This is an open access article distributed under the Creative Commons Attribution License, which permits unrestricted use, distribution, and reproduction in any medium, provided the original work is properly cited. The quality of the prosthetic-neural interface is a critical point for cochlear implant efficiency. It depends not only on technical and anatomical factors such as electrode position into the cochlea (depth and scalar placement), electrode impedance, and distance between the electrode and the stimulated auditory neurons, but also on the number of functional auditory neurons. The efficiency of electrical stimulation can be assessed by the measurement of e-CAP in cochlear implant users. In the present study, we modeled the activation of auditory neurons in cochlear implant recipients (nucleus device). The electrical response, measured using auto-NRT (neural responses telemetry) algorithm, has been analyzed using multivariate regression with cubic splines in order to take into account the variations of insertion depth of electrodes amongst subjects as well as the other technical and anatomical factors listed above. NRT thresholds depend on the electrode squared impedance (𝛽 = −0.11 ± 0.02, 𝑃 < 0.01), the scalar placement of the electrodes (𝛽 = −8.50 ± 1.97, 𝑃 < 0.01), and the depth of insertion calculated as the characteristic frequency of auditory neurons (CNF). Distribution of NRT residues according to CNF could provide a proxy of auditory neurons functioning in implanted cochleas.
1. Introduction
Cochlear implants (CIs) allow the restoration of auditory perception through the direct electrical stimulation of the primary auditory neurons, located within the spiral ganglion of the cochlea. Typically, the outcome of CIs is assessed by evaluating the improvement in speech perception after implantation. However, speech perception is a high level function depending not only on CI functioning, but also on additional factors such as educational and speech therapy support after implantation, as well as the duration and cause of hearing loss, age, and educational level prior to it [1–3]. Thus, limiting the assessment of CI performance strictly to speech perception improvement does not properly evaluate the characteristics of the prosthesis-neural interface.
To study such an interface, electrophysiological testing should provide a more accurate proxy of the interaction between the electrodes of the CI and the auditory neurons. Among the different methods of measurements, electrically evoked compound action potentials (e-CAP) recorded within the CI may reflect this interaction. Indeed, the electrical current required to elicit an e-CAP may be directly correlated to neuronal density and excitability [4].
The use of e-CAP threshold recordings for CI fitting raised the interest of clinicians in the past 2 decades [5–7]. While correlations between psychophysical percepts and e-CAP thresholds with cochlear implant remain controversial, most authors agree that the “shape” of e-CAP thresholds represents a function of electrode position and follows
Volume 2015, Article ID 394687, 10 pages http://dx.doi.org/10.1155/2015/394687
the same distribution than psychophysical thresholds and comfort levels (T- and C-levels, [5,6]).
Therefore, measuring e-CAP thresholds may provide a more accurate evaluation of residual auditory neuron popula-tion than speech perceppopula-tion testing. However, while literature is sparse regarding the impact of additional cues on e-CAPs, it is reasonable to assume that unknown factors could influence e-CAP thresholds. Indeed, if we refer to general principles of other electrically stimulating devices, electrode impedance and the distance between the electrode and the neurons should affect e-CAP thresholds. Other cochlear specific factors like the size of the cochlea, the depth of insertion, scalar placement of the electrodes, and obviously the number of residual functional auditory neurons, eventually associated with age and the duration of profound hearing loss, may also influence e-CAP thresholds [8–13].
In the present study, we propose a statistical model to describe the interactions between the cochlear neural response elicited by electrical pulses and biophysical, clinical, as well as cochlear specific factors in cochlear implanted subjects.
2. Methods
2.1. Population Study. This study, conducted under IRB
approval, included data from 536 active electrodes in 31 subjects implanted between 2006 and 2012 (14 males, 17 females, mean age 32.3 yrs ± 10.5, min 17 yrs, max 63 yrs). Hearing loss etiology was progressive sensorineural deafness in 11 cases, genetic deafness in 8 cases, autoimmune disease in 4 cases, ototoxic medication in 4 cases, otosclerosis in 3 cases, and viral meningitis in 1 case.
The age and duration of profound hearing loss were respectively 40.26± 23.20 yrs (min 0, max 80 yrs) and 5.30 ± 5.32 (min 1 yr, max 30 yrs). Mean age at cochlear implantation was 45.56± 23.35 (min 4 yrs, max 84 yrs).
The CIs used were Nucleus (Cochlear) devices: CI24 RE CA with contour advanced (perimodiolar curved electrode array, PMA) in 27 patients (462 electrodes, 86.2%); CI24 RE ST with straight electrode array (SA) in 2 patients (31 electrodes, 5.8%); and CI422 with slim straight electrode array (SSA) in the remaining 2 patients (43 electrodes, 8%).
Full insertion of the electrode array through a round window approach was performed in all cases. Patients requir-ing cochlear reimplantation were excluded in order to avoid any additional factors that could potentially alter the CAP threshold.
2.2. Electrophysiological Recordings. All recordings were
per-formed at least 6 months following implantation to ensure the stabilization of impedance levels. Electrophysiological recordings were performed on each active electrode at the time of referral.
Impedance of the recording electrodes and CAP (neural response telemetry NRT) thresholds were recorded with Cus-tom Sound 4.0 software (Cochlear). All subjects were stimu-lated using the advanced combinational encoder (ACE) strat-egy at stimulation rates ranging between 900 and 1200 Hz. The impedances (kOhms) were recorded in MP1+2 and NRT
thresholds (current level, C.L.) determined by the auto-NRT function on each active electrode [14]. Biphasic pulses were used at 80 pps rate with pulse duration of 25𝜇s per phase and with an interpulse gap of 8𝜇s. The stimulation started at relatively low intensity (100 C.L.) to avoid overstimulation in awake subjects. The thresholds were confirmed by the Auto-NRT algorithm using an optimization loop with ascending and descending series of stimulation to refine the threshold assessments.
2.3. Imaging Study. Cone beam computed tomography was
performed for every subject to evaluate the position of the electrode array in the cochlea (Newton 5G, 125 ∗ 125 ∗ 125𝜇m voxel size for reconstructions). Axial and midmodio-lar reconstructions were performed to evaluate the size of the cochlea, the angle of electrode array insertion, the distance between each electrode and the modiolus and the scalar placement of the electrodes. On the axial reconstruction, the large diameter of the cochlea was calculated to estimate the length of the cochlea as described by Escud´e et al. [15] (Figure 1(a)). The depth of insertion was estimated using the angle of insertion from the round window to the most apical electrode (Figure 1(b)). The distance between each electrode and the modiolus was calculated as the shortest distance (perpendicular) between the center of the electrode and the inner wall of the cochlea (Figures1(c)and1(d)). Midmodiolar reconstructions enabled the localization of the scalar position for each electrode, that is, within the scala tympani (ST) or the scala vestibuli (SV) (Figures2(a)and2(b)).
The theoretical characteristic frequency of the neurons stimulated by each electrode contact was calculated using the Greenwood function modified by Stakhovskaya et al. [16], with the following parameters: cochlear duct length (CDL), insertion depth, electrode array length, and distance between electrode contacts for every electrode array subtype.
The CDL was calculated as described by Escud´e et al. [15] by applying the following formula CDL = 2.62𝐴 ∗ ln(1 + 𝜃/235) = 4.3259𝐴; with 𝐴 equal to the length in mm of the large diameter of the cochlea (Figure 1(a)) and𝜃 equal to the angle of a cochlea coiled on 2.75 turns (990∘).
The relative position of each electrode was calculated as follows: 𝑋𝑒1= (2.62𝐴 ∗ log (1 + 𝜃𝑒1/235)) CDL , 𝑋𝑒𝑛= [(2.62𝐴 ∗ log (1 + 𝜃𝑒1/235)) − 𝑌𝑛] CDL (1)
𝑋𝑒1= relative position of electrode 1 according to CDL,𝑋𝑒𝑛= relative position of electrode𝑛 according to CDL, 𝜃𝑒1= angle of insertion of electrode 1,𝑌𝑛= distance between electrode 1 and electrode𝑛 (in mm, according to manufacturer’s data).
Then the cochlear place-frequency map for 𝑛 was cal-culated according to Greenwood’s function [17] for each electrode as follows:
(a) (b)
(c) (d)
Figure 1: Calculation of the depth of insertion and distance between electrodes and the inner wall of the cochlea. (a) On an axial reconstruction, the large diameter of the cochlea was calculated to estimate the length of the cochlea as described by Escud´e et al. (b) On an axial reconstruction, the angle of electrode array insertion was defined as that between the tangeant lines touching the most apical and the most basal electrodes. (c) On the same reconstruction, the distance between each electrode and the inner wall of the cochlea (outlined in blue) was calculated as the shortest orthogonal distance. (d) This calculation was repeated on several reconstructions to evaluate the whole electrode array. SV ST SV ST SV ST (a) ∗ # (b)
Figure 2: Midmodiolar reconstruction of cochlea implanted with contour advanced electrode array. (a) Several reconstructions were performed around the midmodiolar axis to evaluate the position of each electrode. After segmentation, each turn of the cochlea was separated into scala tympani (ST) or scala vestibuli (SV) compartments. (b) On this reconstruction we can see a scala vestibuli mislocation of the
electrode array. Indeed the basal electrode (∗) is clearly located in the SV at the level of the first turn of the cochlea, whereas the apical one
with CFneur(𝑛)= characteristic neuron frequency at the
posi-tion of the electrode𝑛, 𝑍𝑒𝑛= relative position of the neurons connected to the hair cells at the position𝑋𝑒𝑛.
𝑍𝑒𝑛was calculated using Stakhovskaya’s formula [16].
𝑍𝑒𝑛= 100
[1 + (23/𝑥𝑒𝑛− 𝑥𝑒𝑛/0.0099 + 0.76)2]. (3)
2.4. Statistical Analysis. The characteristics of patients
included in the present study are described with proportions for categorical variables and with mean and Standard Deviation (SD) values for continuous variables. When several measurements were made for a same subject, the mean of the average value for each subject was computed along with a within-subject SD (as described by Bland and Altman [18]) and between subject SD (on the average value of each subject). Interactions between NRT thresholds and neuron frequency per electrode were described graphically with mean and standard error of the mean (SEM).
Interactions between NRT threshold and demograph-ical, clindemograph-ical, and technical (of the CI) parameters were analyzed using a univariate linear mixed model to account for correlation between the repeated measurements of each subject (measurements of 22 different electrodes in the same subject, causing within-subject SD). For quantitative parameters, different types of relations were tested: linear, quadratic, cubic and polynomial. The type of association that maximized the Bayesian Index Criteria (BIC) was chosen to analyze the NRT threshold as a function of auditory neuron characteristic frequency. In order to model the complexity of the relation between NRT threshold and the characteristic neural frequency, we used a piecewise polynomial regression mixed model with cubic basis with two knots at 5000 and 10000 Hz using SAS PROC MIXED [19]. To analyze independent relations between NRT threshold and these parameters we used a multivariate linear mixed model, which included all the parameters. All the mixed models included a subject-specific random intercept. Significance of fixed effects was tested using the Wald Test. The relation between NRT threshold and the characteristic neural frequency is represented graphically with 95% confidence intervals. All statistical analyses were performed at the conventional two-tailed𝛼 level of 0.05 using the SAS statistical software (SAS Enterprise Guide 4.1, SAS Institute, Cary, N.C.).
3. Results
3.1. Analysis of Inter and Intra-Individual Variations of NRT Thresholds. In our population study, the mean impedance
value was 8.71 kOhms (within subject SD 1.60, between subject SD 2.05, min 2.86, max 19.07 kOhms). Raw data from NRT thresholds spanned from 105 to 244 current levels (C.L., mean 169.68, within subject SD 13.66, between subject SD 18.60). The analysis of NRT thresholds electrode by electrode could not be summarized in a linear, quadratic, cubic, logarithmic or exponential relationship as shown in
Figure 3.
We then evaluated the inter-individual variations of electrode arrays’ insertion depth to determine if they could
Number of the electrode
NR T t h re sho lds (c ur re n t le ve ls) 120 140 160 180 200 220 2 4 6 8 10 12 14 16 18 20 22 Present study Wesarg et al. Pedley et al.
van Dijk et al.
Figure 3: Mean NRT thresholds (±Standard Deviation) as a func-tion of electrode number. Large interindividual variafunc-tions of NRT threshold levels may be observed on the same electrode. No linear relationship is observed between NRT and electrode number as previously published.
affect NRT thresholds. The average length of cochleae was 35.05± 4.68 mm (mean ± Standard Deviation consistently used throughout the text, min 26.38, max 43.42 mm). The mean depth of insertion of the electrode array was 343± 24 degrees (min 275, max 360∘). According to the type of electrode array, mean insertion was 346± 22∘with the PMA, 312± 46∘with the SA, and 335± 35∘with the SSA. All patients implanted with either an SA (CI24 ST) or an SSA (CI422) displayed the entire electrode array within the scala tympani, whereas 35.48% of patients with a PMA (CI24 CA) displayed a translocation of the electrode array within the scala vestibuli (Figure 2).
Considering that the observed inter-individual variations in depth of insertion may account for variations in NRT threshold, we plotted the NRT thresholds as a function of depth of insertion, calculated as the characteristic frequency of auditory neurons in the spiral ganglion (Figure 4). We transformed the variable depth of insertion (%) into charac-teristic frequency of auditory neurons (Hz) in order to use this variable for the modeling of the NRT thresholds using different types of regression models. Additionally, utilizing the report of characteristic frequency of auditory neurons instead of percentage of insertion depth allowed the use of a semi-logarithmic scale, which is more relevant for clinical application than relative depth of insertion.
As shown inFigure 4, the position of the electrode array within the cochlea may vary across subjects with a mean audi-tory neuron frequency ranging from a third to a full octave for the same electrode. Plotting NRT thresholds against char-acteristic neuron frequency for each electrode (Figure 5(a)) revealed the large variability of both NRT threshold and frequency for the same electrode, arguing against the use of electrode number as an independent variable. We therefore decided to use characteristic neuron frequency instead of
Cha rac te ri stic neur o n f req uenc y (H z) 1000 2000 4000 8000 1500 3000 6000 12000 10000 16000
Number of the electrodes
2 4 6 8 10 12 14 16 18 20 22
Figure 4: Mean characteristic auditory neuron frequency (±Standard Deviation) as a function of electrode number. Mean auditory frequency follows a linear relationship with electrode number, with a frequency increasing along with the number of the electrode. However, standard deviation bars show that the same frequency may be stimulated by up to 5 adjacent electrodes depending on the subject, thus arguing against the use of the electrode number to accurately evaluate insertion depth.
electrode number in this study to provide a more accurate idea of electrode positioning within the cochlea (Figure 5(b)).
3.2. Statistical Analyses and Modeling of NRT Thresholds.
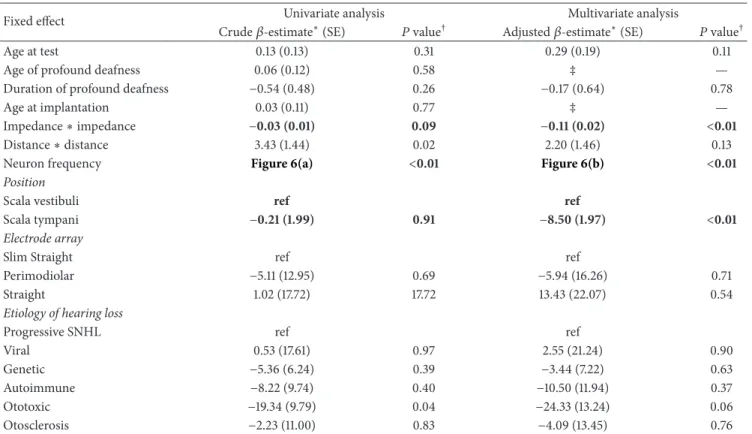
First, a univariate linear mixed model was used to measure the effect of numerical variables (age at test, age of profound deafness, duration of profound deafness, age at implan-tation, impedance, distance electrode-lamina spiralis) and categorical variables (electrode position: ST/SV, type of elec-trode array: Slim Straight/Perimodiolar/Straight etiology of hearing loss: Progressive SNHL/Viral/Genetic/Autoimmune/ Ototoxic/Otosclerosis) on NRT thresholds.
Univariate analysis showed a significant association of NRT thresholds with squared distance (𝑃 = 0.02) and a substantial although not significant association with squared impedance (𝑃 = 0.09). A significant (𝑃 = 0.04) negative association was found in subjects with ototoxic exposure. No association was found with age at evaluation, implantation or profound deafness, duration of the profound deafness, scalar position, and the type of electrode array (Table 1).
In order to model the complex relation between NRT threshold and the characteristic neural frequency, we used a piecewise polynomial regression mixed model with cubic basis with two knots at 5000 and 10000 Hz. Results of univariate regression are shown inFigure 6(a). After a steep increase of NRT between 500 and 3000 Hz, NRT thresholds dropped in the 4000–5000 Hz region before displaying a dome-like shape curve with a peak around 10000 Hz.
Using the same model, a multivariate analysis was per-formed to take into account the combined effects of numeri-cal (including characteristic neural frequency) and categori-cal variables altogether. The multivariate model showed that
Characteristic neuron frequency (Hz)
NR T t h re sho lds (c ur re n t le ve ls) 120 130 140 150 160 170 180 190 200 210 22 21 20 19 18 17 16 15 14 13 12 11 10 1000 1500 2000 3000 4000 6000 8000 10000 12000 16000 1 2 3 4 5 6 7 8 9 Electrode number (a) NR T t h re sho lds (c ur re n t le ve ls) 100 120 140 160 180 200 220 240 260 44.4 39.0 35.1 29.7 25.8 20.2 16.1 12.7 9.8 4.8 0.7 Insertion depth (%)
Characteristic neuron frequency (Hz)
1000 1500 2000 3000 4000 6000 8000 10000 12000 16000 20000
(b)
Figure 5: Mean NRT thresholds (±Standard Deviation) and mean characteristic auditory neuron frequency (±Standard Deviation) as a function of electrode number. Displaying NRT thresholds as a function of auditory neuron frequency for each electrode (a) clearly reveals the large variation of both NRT and frequency for the same electrode. Thus, a precise assessment requires the consideration of each electrode individually as a single point of coordinates (frequency, NRT), rather than the use of the electrode number (b).
NRT thresholds were negatively correlated (NRT threshold decreasing with an increasing variable value) with the scalar placement in the scala tympani (𝑃 < 0.01), and with the impedance of the electrodes (𝑃 < 0.01). This reveals that scala tympani placement of the electrode array led to a mean decrease of 8.50 ± 1.97 C.L. in NRT thresholds by comparison with scala vestibuli placement (Table 1). Every 1 kOhm elevation of electrode impedance resulted in a mean NRT threshold decrease of 0.11± 0.02 C.L. (Table 1).
Table 1: Parameter estimates of the linear mixed model evaluating the relation between neural response thresholds and demographical, clinical, and technical factors.
Fixed effect Univariate analysis Multivariate analysis
Crude𝛽-estimate∗(SE) 𝑃 value† Adjusted𝛽-estimate∗(SE) 𝑃 value†
Age at test 0.13 (0.13) 0.31 0.29 (0.19) 0.11
Age of profound deafness 0.06 (0.12) 0.58 ‡ —
Duration of profound deafness −0.54 (0.48) 0.26 −0.17 (0.64) 0.78
Age at implantation 0.03 (0.11) 0.77 ‡ —
Impedance∗ impedance −0.03 (0.01) 0.09 −0.11 (0.02) <0.01
Distance∗ distance 3.43 (1.44) 0.02 2.20 (1.46) 0.13
Neuron frequency Figure 6(a) <0.01 Figure 6(b) <0.01
Position
Scala vestibuli ref ref
Scala tympani −0.21 (1.99) 0.91 −8.50 (1.97) <0.01
Electrode array
Slim Straight ref ref
Perimodiolar −5.11 (12.95) 0.69 −5.94 (16.26) 0.71
Straight 1.02 (17.72) 17.72 13.43 (22.07) 0.54
Etiology of hearing loss
Progressive SNHL ref ref
Viral 0.53 (17.61) 0.97 2.55 (21.24) 0.90
Genetic −5.36 (6.24) 0.39 −3.44 (7.22) 0.63
Autoimmune −8.22 (9.74) 0.40 −10.50 (11.94) 0.37
Ototoxic −19.34 (9.79) 0.04 −24.33 (13.24) 0.06
Otosclerosis −2.23 (11.00) 0.83 −4.09 (13.45) 0.76
SE: standard error.
∗𝛽-estimate: mean increase in NRT threshold according to the increase of one unit of the considered quantitative explanatory variable. For qualitative
explanatory variables, the𝛽-estimate is the mean difference in NRT compared to the reference category (ref).
†𝛽-estimates were compared to the value 0; a corresponding 𝑃 value <0.05 indicates a significant association between NRT and the explanatory variable. ‡“Age of profound deafness” and “Age at implantation” were not entered into the multivariate model because of their high colinearity with “Age at test.”
In this multivariate analysis, no significant effect was found for the etiology of the hearing loss, the type of elec-trode array, the age at evaluation, implantation or profound deafness, or the duration of profound deafness. Although a close to significance, multivariate analysis did not support the significant difference found either for the ototoxic exposure (𝑃 = 0.06) in univariate analysis, or for the distance between each electrode and the inner wall of the cochlea (𝑃 = 0.13) (Table 1).
The relation between NRT thresholds and characteristic neuron frequency after adjustment on significant variables (squared impedance and scalar position) is represented in
Figure 6(b). In addition to a similar “double bump” aspect of the univariate regression curve described above, a trend to an elevated threshold along with the characteristic neuron frequency was observed.
4. Discussion
Previous studies have failed in their attempts to correlate speech perception thresholds with most of the electro-physiological measurements performed with a CI [20, 21]. Indeed, speech perception not only relies on the efficacy of the electrical stimulation, but also involves central auditory pathways in addition to brain language areas and networks
[1–3]. However, it is reasonable to assume that more specific psychoacoustical perceptions, like enhanced loudness growth or pitch perception [11, 12, 22] are directly linked to the activation of the residual auditory neurons by the electrical stimulation delivered by the electrode array. Indeed Cohen [12] and Kirby et al. [23] clearly showed that loudness growth function was proportional to e-CAP growth function, meaning that a stimulation with an increased current level causes an enhanced activation of auditory neurons, either directly by a recruitment of more neurons in the same region of the spiral ganglion, or indirectly by the spread of excitation of the electrical stimulation. However, e-CAP amplitude does not directly predict loudness, since it depends on additional factors discussed hereafter.
The relation between the electrodes and the neurons depends not only on the electrode array itself, but also on its insertion into the cochlea. Some authors recommend the use of perimodiolar arrays instead of straight arrays to favor a reduced NRT threshold. However, previous studies showed that perimodiolar placement of electrodes has no effect on NRT thresholds [24,25], an observation consistent with our study.
On the other hand, perimodiolar arrays were associated with increased scala vestibuli mislocation in the present study and in several others [26,27]. This type of mislocation does
150 160 170 180 190 P redic te d NR T (c ur re n t le ve l) 53.8
Univariate analysis with cubic splines
Predicted NRT 95% confidence Interval curves 1000 500 1500 2000 3000 4000 6000 8000 10000 12000 16000
Characteristic neuron frequency (Hz)
44.4 39.0 35.1 29.7 25.8 20.2 16.1 12.7 9.8 4.8 Insertion depth (%) (a) 150 160 170 180 190 200 P redic te d NR T (c ur re n t le ve l) Predicted NRT 95% confidence Interval curves
Multivariate analysis with cubic splines
1000
500 1500 2000 3000 4000 6000 8000
10000 12000 16000
Characteristic neuron frequency (Hz)
53.8 44.4 39.0 35.1 29.7 25.8 20.2 16.1 12.7 9.8 4.8
Insertion depth (%)
(b)
Figure 6: Modeling of NRT threshold as a function of characteristic auditory neuron frequency ((a): univariate regression, (b): multivariate regression including other variables). As can be seen, the prediction of NRT threshold level (black line) with 95% confidence interval (dashed lines), either univariate (a) or adjusted (b) for impedance and scalar placement (variables significantly associated with NRT threshold) shows an aspect of “double bump” curve with a trend to thresholds elevation along with the increase of characteristic frequency of auditory neurons.
jeopardize the preservation of residual hearing and yet the use of perimodiolar arrays remains appealing in cases where no residual hearing needs to be preserved. Thus, it is also important to determine whether the scalar placement (scala tympani or vestibuli) alone impacts NRT thresholds. In the present study, we found a negative effect of scala vestibuli positioning of the electrodes on NRT thresholds. Therefore, in addition to favoring cochlear structure preservation, scala tympani insertion appears to be an important factor to reduce NRT thresholds. Furthermore, we suggest that preservation of such cochlear structure is also beneficial for speech perception performances with CI [2].
In this present study, the insertions of electrode arrays (perimodiolar and straight) were performed using a round window approach. However, the perimodiolar contour advanced arrays were initially designed to be inserted through a cochleostomy. The insertion of perimodiolar arrays through the round window is responsible of a deeper inser-tion and of a shortest distance between the basal electrodes and the modiolus [28], but may result in even more damages of cochlear structures [29,30]. Thus the surgical approach, in addition to the electrode array subtype, has to be taken into consideration for NRT thresholds variability.
Increase in electrode impedance has been suggested to reflect the degree of cochlear fibrosis [31]. Indeed, changes in impedance in the postoperative period, followed by sta-bilization between 3 and 12 months postoperatively support this fact [32]. Fibrotic scars can reduce the performance of CIs by raising the threshold stimulation levels and energy
consumption of the implant. Surprisingly, we found that electrodes with higher impedance had a moderate but sig-nificant reduction of NRT thresholds (average reduction of 0.11 C.L. per kOhm), regardless of the type of array or depth of insertion. Thus, it is conceivable that the fibrotic tissues surrounding the electrode array may contribute to focus the electrical current to the nearest wall of the cochlea and that the excitation does not spread into the spaces filled with perilymph. This reduction of NRT threshold could also be explained by a measurement artifact. Indeed, high impedance electrodes require more voltage to deliver the same current intensity. In this NRT recording paradigm, one cannot eliminate the effect of voltage in addition to current on either the generation of e-CAP measurements or on the recording by the automatic threshold detection algorithm. Similar variations of algorithm detection sensitivity have already been noticed by van Dijk et al. [14] and Wesarg et al. [33] when changing the pulse rate (80 versus 250 pps) and by consequences the charges per second.
Interestingly, we found a non-, but nearly, significant effect of the distance between the electrodes and the medial wall of the cochlea (where the spiral ganglion neurons are located) on NRT thresholds. The lack of statistical signifi-cance could reflect a limitation of our study, such as a lack of sensitivity of the CT cone beam reconstruction measure-ments to accurately evaluate this distance. In accordance with the role of electrode modiolus-distance, Holden et al. [2] found that a reduced distance between the electrodes and the modiolus, evaluated with cone beam imaging, could
increase speech perception. Additional histological studies on implanted temporal bone specimens need to be conducted to further address this point.
Unlike speech perception results [1, 3], age at implan-tation, duration, and age of profound hearing loss had no significant effect on NRT thresholds. This observation supports the fact that these variables may act directly on the central auditory pathways and language areas with little or no effect on the peripheral auditory system.
In the present study, we found no impact of hearing loss etiology on NRT thresholds, despite a nearly significant effect of ototoxic exposure (drugs). This is consistent with the fact that aminoglycosides affect preferentially hair cells and stria vascularis and have minimal effects on auditory neuron survival (reviewed in [34]). Other deafness etiologies like otosclerosis, age-related hearing loss, genetic mutation, or noise may affect hair cells, the stria vascularis and neurons. Consequently, a more specific phenotyping would be neces-sary to identify specific cases in which auditory neurons are less damaged.
Only few studies have reported that speech perception outcomes may be related to etiology of hearing loss (reviewed in [3]). More particularly, some etiologies that affect cochlear anatomy, such as meningitis causing fibrosis, lead to poorer scores than Meni`ere’s disease, in which loss of neurons occurs later on [35]. This observation fits with our model, in which we studied separately the impact of etiology and the number of residual neurons through NRT thresholds. Our findings suggest that differences in speech perception outcome may be more connected to residual neurons than to the etiology of the loss of hearing itself.
In this study, we showed that NRT thresholds depend on the electrode depth of insertion into the cochlea.
While some studies report that NRT thresholds follow a base-apex gradient [36, 37], with basal electrodes near to the high frequency neurons displaying higher thresholds than apical electrodes placed closer to low-medium frequency neurons, others found no linear distribution of NRT thresh-olds [6,14,33,38,39] (see examples inFigure 3).
These differences could be explained by the number of electrodes used, instead of characteristic neuron frequency, resulting in an inaccurate localization of the electrode in the cochlea, in addition to a large variation of electrode positioning amongst subjects. As we have demonstrated, the depth of insertion of the electrode array, as well as the size of the cochlea, may vary between subjects and thus, estimation of the electrode depth of insertion using electrode number is insufficiently accurate.
In the present study, we noticed a “double bump” aspect of the relation between NRT thresholds and insertion depth, in addition to a moderate decrease of thresholds from the base to the apex of the cochlea. This report is to date, the first one using a multivariate analysis to describe separately the contribution of electrode insertion depth in addition to other factors on NRT thresholds values.
Assuming that the predicted NRT thresholds, calculated as a residual value of multivariate analysis, reflect indirectly the excitability level of the remaining auditory nerve fibers, one should expect that those values are a proxy of the
functional auditory neuron population in the spiral ganglion neuron of implanted patients [4]. However, it is unclear why the obtained curve displays a “double bump” aspect with an elevation of thresholds at 10000 Hz (12.7% or 126∘of cochlear length) and 3000 Hz (29.7% or 294∘ of cochlear length). Using perimodiolar arrays, Marx et al. [27] showed that a traumatism causing vestibular translocation of the electrode array may occur around 90–270∘of insertion in 30% of cases. Thus, elevation of NRT thresholds may be caused by the traumatism of insertion, but does not explain the “double bump” ascending aspect of the curve, with a drop of NRT threshold at 4000 Hz.
Interestingly, the hearing sensitivity curve (ISO 226-2003 norm) of normal hearing individuals also displays a “double bump” ascending aspect of the curve by 500 Hz, with an increased sensitivity at 4000 Hz. Even if the hearing sensitivity of normal hearing individuals cannot be compared to the hearing sensitivity of implanted patients, it can be proposed that the increased sensitivity observed around 4000 Hz in normal hearing people relies, at least partially, on an increased capacity to recruit auditory neurons at this frequency, a hypothesis supported by our data in cochlear implant recipients.
Therefore, comparing the NRT threshold profiles of patients using our modeling might help in detecting subjects with abnormal neuron activation, and identify instances of auditory neuropathies or severe auditory neuron loss. This neuronal loss, in addition to personal or environmental factors (such as the duration of hearing loss, age of deafness, educational level, and speech therapy suppor) independent of cochlear implant characteristics, might explain cases of poor speech perception outcomes. Nevertheless, further histologi-cal studies will be needed to confirm this hypothesis.
5. Conclusion
With CIs, NRT thresholds vary according to the scalar placement of electrodes and their impedance. Scala tympani insertion is required not only to preserve residual hearing and cochlear structures, but also to improve the sensitivity of cochlear neurons.
Perimodiolar arrays did not display any advantage over straight arrays with regards to NRT thresholds and are associated with more frequent misplacement into the scala vestibuli. NRT thresholds, adjusted for scalar placement and impedance, may reflect auditory neuron sensitivity across the cochlea.
Ultimately, analyses of NRT thresholds might provide further information on the number of residual auditory neu-rons in each part of the cochlea and enable the evaluation of prosthetic-neural interface quality and consequential efficacy.
Conflict of Interests
The authors declare that there is not conflict of interests.
References
[1] P. Blamey, F. Artieres, D. Bas¸kent et al., “actors affecting auditory performance of postlinguistically deaf adults using
cochlear implants: an update with 2251 patient,” Audiology &
Neurotology, vol. 18, no. 1, pp. 36–47, 2013.
[2] L. K. Holden, C. C. Finley, J. B. Firszt et al., “Factors affecting open-set word recognition in adults with cochlear implants,”
Ear and Hearing, vol. 34, no. 3, pp. 342–360, 2013.
[3] D. S. Lazard, C. Vincent, F. Venail et al., “Pre-, per- and postop-erative factors affecting performance of postlinguistically deaf adults using cochlear implants: a new conceptual model over time,” PLoS ONE, vol. 7, no. 11, Article ID e48739, 2012. [4] W. Lai and N. Dillier, “Neural adaptation and the ECAP
response threshold: a Pilot Study,” Cochlear Implants
Interna-tional, vol. 10, supplement 1, pp. 63–67, 2009.
[5] R. Kaplan-Neeman, Y. Henkin, Z. Yakir et al., “NRT-based versus behavioral-based map: a comparison of parameters and speech perception in young children,” Journal of Basic and
Clinical Physiology and Pharmacology, vol. 15, no. 1-2, pp. 57–69,
2004.
[6] K. Pedley, C. Psarros, K. Gardner-Berry et al., “Evaluation of NRT and behavioral measures for MAPping elderly cochlear implant users,” International Journal of Audiology, vol. 46, no. 5, pp. 254–262, 2007.
[7] L. G. Potts, M. W. Skinner, B. D. Gotter, M. J. Strube, and C. A. Brenner, “Relation between neural response telemetry thresholds, T- and C-levels, and loudness judgments in 12 adult nucleus 24 cochlear implant recipients,” Ear and Hearing, vol. 28, no. 4, pp. 495–511, 2007.
[8] A. Botros and C. Psarros, “Neural response telemetry reconsid-ered: II. The influence of neural population on the ecap recovery function and refractoriness,” Ear and Hearing, vol. 31, no. 3, pp. 380–391, 2010.
[9] S. Brill, J. M¨uller, R. Hagen et al., “Site of cochlear stimulation and its effect on electrically evoked compound action potentials using the MED-EL standard electrode array,” BioMedical
Engi-neering Online, vol. 8, article 40, 2009.
[10] K. M. S. Clay and C. J. Brown, “Adaptation of the electrically evoked compound action potential (ECAP) recorded from nucleus CI24 cochlear implant users,” Ear and Hearing, vol. 28, no. 6, pp. 850–861, 2007.
[11] L. T. Cohen, “Practical model description of peripheral neural excitation in cochlear implant recipients: 3. ECAP during bursts and loudness as function of burst duration,” Hearing Research, vol. 247, no. 2, pp. 112–121, 2009.
[12] L. T. Cohen, “Practical model description of peripheral neural excitation in cochlear implant recipients: 1. Growth of loudness and ECAP amplitude with current,” Hearing Research, vol. 247, no. 2, pp. 87–99, 2009.
[13] M. K. Cosetti, W. H. Shapiro, J. E. Green et al., “Intraoperative neural response telemetry as a predictor of performance,”
Otology & Neurotology, vol. 31, no. 7, pp. 1095–1099, 2010.
[14] B. van Dijk, A. M. Botros, R.-D. Battmer et al., “Clinical results of AutoNRT, a completely automatic ECAP recording system for cochlear implants,” Ear and Hearing, vol. 28, no. 4, pp. 558– 570, 2007.
[15] B. Escud´e, C. James, O. Deguine, N. Cochard, E. Eter, and B. Fraysse, “The size of the cochlea and predictions of insertion depth angles for cochlear implant electrodes,” Audiology and
Neurotology, vol. 11, supplement 1, pp. 27–33, 2006.
[16] O. Stakhovskaya, D. Sridhar, B. H. Bonham, and P. A. Leake, “Frequency map for the human cochlear spiral ganglion: impli-cations for cochlear implants,” Journal of the Association for
Research in Otolaryngology, vol. 8, no. 2, pp. 220–233, 2007.
[17] D. D. Greenwood, “A cochlear frequency-position function for several species—29 years later,” Journal of the Acoustical Society
of America, vol. 87, no. 6, pp. 2592–2605, 1990.
[18] J. M. Bland and D. G. Altman, “Measurement error,” British
Medical Journal, vol. 313, no. 7059, p. 744, 1996.
[19] A. Edan, “Smoothing with SAS PROC MIXED,” in Proceedings
of the 28th SAS User Group International, p. 268, Washington,
DC, USA, 2003.
[20] K. Seyle and C. J. Brown, “Speech perception using maps based on neural response telemetry measures,” Ear and Hearing, vol. 23, no. 1, supplement, pp. 72S–79S, 2002.
[21] S. Vlahovi´c, B. ˇSindija, I. Aras, M. Glunˇci´c, and R. Troti´c, “Differences between electrically evoked compound action potential (ECAP) and behavioral measures in children with cochlear implants operated in the school age vs. operated in the first years of life,” International Journal of Pediatric
Otorhinolaryngology, vol. 76, no. 5, pp. 731–739, 2012.
[22] M. L. Hughes and P. J. Abbas, “The relation between electro-physiologic channel interaction and electrode pitch ranking in cochlear implant recipients,” The Journal of the Acoustical
Society of America, vol. 119, no. 3, pp. 1527–1537, 2006.
[23] B. Kirby, C. Brown, P. Abbas, C. Etler, and S. O’Brien, “Rela-tionships between electrically evoked potentials and loudness growth in bilateral cochlear implant users,” Ear and Hearing, vol. 33, no. 3, pp. 389–398, 2012.
[24] S. van Weert, R. J. Stokroos, M. M. J. G. Rikers, and P. van Dijk, “Effect of peri-modiolar cochlear implant positioning on auditory nerve responses: a neural response telemetry study,”
Acta Oto-Laryngologica, vol. 125, no. 7, pp. 725–731, 2005.
[25] X. Xi, F. Ji, D. Han, M. Hong, and A. Chen, “Electrode interac-tion in cochlear implant recipients: comparison of straight and contour electrode arrays,” ORL, vol. 71, no. 4, pp. 228–237, 2009. [26] A. Aschendorff, J. Kromeier, T. Klenzner, and R. Laszig, “Qual-ity control after insertion of the nucleus contour and contour advance electrode in adults,” Ear and Hearing, vol. 28, no. 2, supplement, pp. 75S–79S, 2007.
[27] M. Marx, F. Risi, B. Escud´e et al., “Reliability of cone beam computed tomography in scalar localization of the electrode array: a radio histological study,” European Archives of
Oto-Rhino-Laryngology, vol. 271, no. 4, pp. 673–679, 2014.
[28] O. F. Adunka, H. C. Pillsbury, and J. Kiefer, “Combining perimodiolar electrode placement and atraumatic insertion properties in cochlear implantation—Fact or fantasy?” Acta
Oto-Laryngologica, vol. 126, no. 5, pp. 475–482, 2006.
[29] R. J. Briggs, M. Tykocinski, E. Saunders et al., “Surgical implications of perimodiolar cochlear implant electrode design: avoiding intracochlear damage and scala vestibuli insertion,”
Cochlear Implants International, vol. 2, no. 2, pp. 135–149, 2001.
[30] M. A. Souter, R. J. S. Briggs, C. G. Wright, and P. S. Roland, “Round window insertion of precurved perimodiolar electrode arrays: how successful is it?” Otology & Neurotology, vol. 32, no. 1, pp. 58–63, 2011.
[31] G. M. Clark, S. A. Shute, R. K. Shepherd, and T. D. Carter, “Cochlear implantation: osteoneogenesis, electrode-tissue impedance, and residual hearing,” The Annals of Otology,
Rhinology & Laryngology. Supplement, vol. 166, pp. 40–42, 1995.
[32] H. Jia, F. Venail, J.-P. Piron et al., “Effect of surgical technique on electrode impedance after cochlear implantation,” Annals of
Otology, Rhinology and Laryngology, vol. 120, no. 8, pp. 529–534,
[33] T. Wesarg, R.-D. Battmer, L. C. Garrido et al., “Effect of chang-ing pulse rate on profile parameters of perceptual thresholds and loudness comfort levels and relation to ECAP thresholds in recipients of the Nucleus CI24RE device,” International Journal
of Audiology, vol. 49, no. 10, pp. 775–787, 2010.
[34] J. Schacht, A. E. Talaska, and L. P. Rybak, “Cisplatin and aminoglycoside antibiotics: hearing loss and its prevention,”
Anatomical Record, vol. 295, no. 11, pp. 1837–1850, 2012.
[35] U. Khetarpal and H. F. Schuknecht, “Temporal bone findings in a case of bilateral Meniere’s disease treated by parenteral streptomycin and endolymphatic shunt,” Laryngoscope, vol. 100, no. 4, pp. 407–414, 1990.
[36] A. Hagr, “Intra-operative neural response telemetry and acous-tic reflex assessment using an advance-in-stylet technique and modiolus-hugging: a prospective cohort study,” Sultan Qaboos
University Medical Journal, vol. 11, no. 3, pp. 369–376, 2011.
[37] Y. Tian, W. Li, Z. Wang, N. Yang, L. Hui, and X. Jiang, “Site of cochlear stimulation and its effect on electrically evoked compound action potentials using the Nucleus24 cochlear implants,” Lin Chung Er Bi Yan Hou Tou Jing Wai Ke Za Zhi, vol. 26, no. 22, pp. 1014–1019, 2012.
[38] A. Botros and C. Psarros, “Neural response telemetry recon-sidered: I. The relevance of ecap threshold profiles and scaled profiles to cochlear implant fitting,” Ear and Hearing, vol. 31, no. 3, pp. 367–379, 2010.
[39] L. Spivak, C. Auerbach, A. Vambutas, S. Geshkovich, L. Wexler, and B. Popecki, “Electrical compound action potentials recorded with automated neural response telemetry: threshold changes as a function of time and electrode position,” Ear and
Submit your manuscripts at
http://www.hindawi.com
Stem Cells
International
Hindawi Publishing Corporationhttp://www.hindawi.com Volume 2014
Hindawi Publishing Corporation
http://www.hindawi.com Volume 2014 INFLAMMATION
Hindawi Publishing Corporation
http://www.hindawi.com Volume 2014
Behavioural
Neurology
Endocrinology
International Journal ofHindawi Publishing Corporation
http://www.hindawi.com Volume 2014 Hindawi Publishing Corporation
http://www.hindawi.com Volume 2014
Disease Markers
Hindawi Publishing Corporation
http://www.hindawi.com Volume 2014
BioMed
Research International
Oncology
Journal of Hindawi Publishing Corporationhttp://www.hindawi.com Volume 2014
Hindawi Publishing Corporation
http://www.hindawi.com Volume 2014
Oxidative Medicine and Cellular Longevity
Hindawi Publishing Corporation
http://www.hindawi.com Volume 2014
PPAR Research
The Scientific
World Journal
Hindawi Publishing Corporationhttp://www.hindawi.com Volume 2014
Immunology Research Hindawi Publishing Corporation
http://www.hindawi.com Volume 2014
Journal of
Obesity
Journal ofHindawi Publishing Corporation
http://www.hindawi.com Volume 2014
Hindawi Publishing Corporation
http://www.hindawi.com Volume 2014
Computational and Mathematical Methods in Medicine
Ophthalmology
Journal ofHindawi Publishing Corporation
http://www.hindawi.com Volume 2014
Diabetes Research
Journal of Hindawi Publishing Corporationhttp://www.hindawi.com Volume 2014
Hindawi Publishing Corporation
http://www.hindawi.com Volume 2014
Research and Treatment
AIDS
Hindawi Publishing Corporation
http://www.hindawi.com Volume 2014
Gastroenterology Research and Practice
Hindawi Publishing Corporation
http://www.hindawi.com Volume 2014