Digitized
by
the
Internet
Archive
in
2011
with
funding
from
Boston
Library
Consortium
IVIember
Libraries
I
DEWEY
L.. *
Massachusetts
Institute
of
Technology
Department
of
Economics
Working
Paper
Series
CROSS
COUNTRY
INEQUALITY
TRENDS
Daron
Acemogiu
Working
Paper
02-1
4
February
2002
Room
E52-251
50
Memorial
Drive
Cambridge,
MA
02142
This
paper
can be
downloaded
withoutcharge from
theSocial
Science
Research Network Paper
Collection atMassachusetts
Instituteof
Technology
Department
of
Economics
Working
Paper
Series
CROSS
COUNTRY
INEQUALITY
TRENDS
Daron Acemoglu
Working
Paper
02-1
4
February
2002
Room
E52-251
50
Memorial
Drive
Cambridge,
MA
021
42
This
paper
can be
downloaded
without
charge
from
the
Social
Science
Research
Network
Paper
Collection
atCross-
Country
Inequality
Trends'
Daron
Acemoglu,
MIT
February
7,2002
Abstract
The
economics professionhasmade
considerable progressinunderstanding theincrease in wage inequahty in the U.S. and the
UK
over the past several decades,but currently lacks a consensus on
why
inequahty did not increase, or increasedmuch
less, in (continental) Europe over the same time period. I review the twomost popular explanations for these difTerential trends: that relative supply of
skills increasedfasterin Europe, and that European labor market institutions
pre-vented inequality from increasing. I argue that these two explanations go some
way
towards accounting for the differential cross-country inequality trends, butdo not provide an entirely satisfactory explanation. In addition, it appears that
relative
demand
for skills increased differentially across countries. Motivated bythis reasoning, I develop a simple theory where labor market institutions
creat-ing wage compression in Europe also encourage more investment in technologies
increasing the productivity ofless-skilled workers, thus implying less skill-biased
technical change in Europe than in the U.S.
Keywords:
Relative Supply of Skills, Returns to Education, Skill-Biased Technical Change, Technology Adoption,Wage
Compression,Wage
Inequality.JEL
ClassificationNumbers:
,130. J31.*I thank Larry Katz and Timothy Smeeding, and seminar participants at Cornell and
MIT
forcomments and Alexis Leon for outstanding research assistance, and the
NSF
and the Russell Sage1
Introduction
While
over the 1980swage
inequaUtyand
retiu'ns to education increased sharply inthe U.S.
and
theUK,
therewas
less ofan
increase, or evenno
change, in continentalEirropeaneconomies (see, for example,
Freeman and
Katz, 1995, Nickelland
Bell, 1996,Blanchflower,
Loveman, and
Katz, 1995).Table 1 illustrates these trends
by
showing an estimate of the educationpremium
and
the log differences of the 90thand
the 10th percentiles of thewage
distributionfor a
number
of countries from the LirxembourgIncome
Studies dataset (and for theU.S. from the
CPS,
see Section 4and
theAppendix
for data details).The
table alsoreplicates the estimates of the 90-10 differential for a
number
of countries from Table2 of the survey
by
Freeman and Katz
(1995) for comparison.The
nimrbersshow
that U.S. inequalityand
skill premia were higher at the end ofthe 1970s than inmost
othercountries,
and
from there on, they increased faster than in these other cases (perhapswiththe exception ofIsrael)
.
These
cross-country trends are wellknown. There
is also afairly widespreadconsen-sus that U.S.
wage
inequalityrose because the relativedemand
for skills increasedfasterthan
the relative supply (e.g.,Katz and Murphy,
1992,Berman,
Bound
and
Griliches,1994,
Katz and
Autor, 2000,Acemoglu,
2002). Sowhy
haven't thesame
technologicaldevelopments increased skill
premia
inmuch
ofcontinentalEurope?
There
are three broad types of answers:1.
The
relative supply ofskiUs increased faster in Europe.2.
European
wage-setting institutions preventedwage
inequalityfrom
increasing.3. For exogenous or
endogenous
reasons, technical change has been less skill biasedin Europe.
The
firsttwo
explanationshave beenthemost
popularamong
economists,and
Ireferto
them
as the "traditional explanations".Both
ofthese explanationsfit nicely intothethe U.S.
wage
inequality patterns.They
both suggest that the lack of increase inin-equality in
Europe
shoiildhave
been
associated with a relatively faster increase in theemployiBent of
more
skilled workers. Table 1 alsoshows
that during the 1980s the rel-ativeemployment
ofskilled .workersincreased faster in anumber
ofEuropean
countriesthan
in the U.S. Is thismore
rapid increase in skilledemployment
sufficient to accountfor the stabihty ofthe
European wage
structure?I use a versionoftherelative-supply-demand
framework
to investigate this question.The
evidence suggests that these explanations account for a significantcomponent
ofthe differential inequality trends (in fact, for substantially
more
than the authorhad
originallyconjectured!). Nevertheless, it also appears that the relative
demand
for skillsdid not increase as
much
inmany
European
economies as it did in the U.S.and
theUK.
More
specifically, Ifmd
that the relative-supply-demand framework, with thesame
relative
demand
shifts across countries, does areasonable job ofexplainingsome
ofthedifferences in the cross-country inequality trends, for example, for Finland
and
Norway.Nevertheless, there are a
number
of cases, in particular, Belgium,Denmark, and
Sweden,and
also tosome
degree Israel,where
skill premia increasedmuch
less than predictedby
this approach. I therefore conclude that the traditional explanationsdo
notseem
toprovide
an
entirely satisfactory explanation for the differential inequahty trends acrosscountries. Instead, it appears that the U.S.
and
European
relativedemand
curves didnot shift in the
same
way
over the past 20 years.^
Given
data qualityand
compatibility issues, tliis evidence hasto be interpreted withcaution. Nevertheless, it suggests that
we
shouldbe
tliinldng of explanations featuringdifferences in technical change or technology adoption across these coimtries. In the
last part of the paper, I propose a possible explanation for
why
relativedemand
forskills
may
not have increased asmuch
inEurope
as in the U.S.The
basic idea is thatinstitutional
wage
compressioninEurope
makes
firmsmore
willing toadopt technologies'Berman, Bound and Machin (1998) look at patterns of skill-upgrading in various industries and
concludethat therehasbeen skill-biasedtechnicalchangeinall ofthe
OECD
countries intheirsample.However, their results do not imply that theseshifts have occurred atthe samerate or with thesame
intensityacrosscountries. Infact,toinfertheoverall rate of skill-biasedtechnicalchange fromindustry
complementary
to unskilled workers,making
teclinical change less skill bitised there.The
paper proceeds as follows. In the next section, I review the three explanationssuggested above. In Section3, I develop a simple
framework
toquantitatively investigatewhether cross-comrtry ineciuality trends can be explained bythe relative-supply-demand
framework
assuming similar changes in relativedemand
for skills across coimtries. InSection 4, I use data from the
Luxembourg
Income
Studiesand
rmdertake such aninvestigation. I find that although the differential behavior of relative supphes
between
the U.S.
and
continentalEurope
explainsmuch
ofthe differences, there is also evidencethat the relative
demand
for skills did not increase asmuch
in continental Europe. InSection 5, I
make
a preliminary attempt at developing a simple theorywhere
relativedemands
change differentially across com^itries. Section 6 concludes.2
Review
of
the
Arguments
2.1
Traditional
Explanations
of
Differential
Inequality
Trends
The
traditional approaches explain the differential cross-country inequality trends bydifferences in the behavior of relative supplies.
The
first explanation claims that themore
rapid increase in the relative supply of skills inEurope
accoimts for the lack ofincrease in inequality there.
The
second explanation,on
the other hand, emphasizesthe role of
European
wage-setting institutions. According to this explanation, it isnot the differential
growth
of skilled workers in the population, but the differentialbehavior of skilled
employment
that is responsible for differencesm
inequahty trendsacross countries.
More
specifically, firms respond towage
compressionby
reducingtheir
demand
for unskilled workers,and
theemployment
of skilled workers (relative tothat of unskilled workers) increases in
Europe
compared
to the U.S.As
a result, themarket equihbriates with a lower
employment
of imskilled workers compensating fortheir relatively liigher
wages
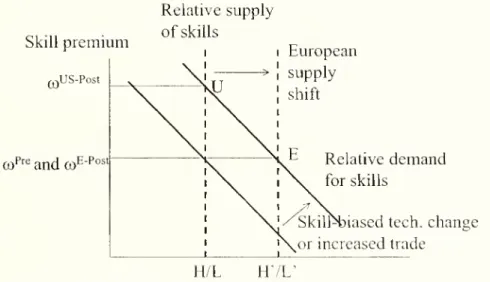
in Europe.Figure 1 illustrates the first explanation using a standard relative-supply-demand
diagram, with relative supply
on
the horizontal axisand
the relativewage
of skilledas vertical.
The
diagram shows
thatan
increase in thedemand
for skills, for a givensupply of skills, will lead to higher
wage
inequality.At
a simple level,we
can thinkof this
economy
as corresponding to the U.S.,where
the consensus is that because of skill-biased technical change or increased trade with less skill-abunclant countries, therelative
demand
for skillsgrew
faster than the relativesupply duringthe recent decades.As
aresult ofthe increase in the relativedemand
forskills, theskillpremium
risesfrom
u;P'-^ to a;US-Post_
Now
imagine that continentalEurope
is also affectedby
thesame
relativedemand
shifts, but the relative supply of skills also increases. This
captmes
the essence of thefirst explanation,
where
the supply ofskills increases faster in continentalEurope
thanin the U.S.
Then
the "European" equilibrium willbe
at a point likeE
wloichmay
notexliibit greater inequality than before. In fact, Figure 1 depicts the case in
wMch
there isno
change in the skillpremium
in Erurope.^Probably the
more
popular explanationamong
economistsand commentators
is thesecond one above (e.g.,
Krugman,
1994,OECD,
1994,Blau
and Kalm,
1996).To
captm-ethis story, imagine that wage-setting institutions in
Europe
preventwage
inequaUtyfrom increasing
—
for example, because ofunion bargaining,unemployment
benefits, orminimum
wages
that keep the earnings of low-skill workers in line with those ofhigh-skill workers. Thiscan
be
representedasan
institutionalwage-settinglinedifferentfrom
the relative supply curve as
drawn
in Figure 2. (Tomake
the story stark, Idrew
theinstitutional wage-setting
hne
as horizontal).The
equilibriumnow
has tobe
along thisinstitutional wage-setting line,
and
consquently ojf the relative supply curve, causingunemployment.
Now,
even in the absence ofan
increase in the relative supplyofskills,the skill
premium
might
not increase; instead there will be equilibriumunemployment.
In the figure, relative miemployiBent caused
by
the increase in thedemand
for skillsis
shown
as thegap between
the relative supply of skillsand
the intersectionbetween
relative
demand
and
institutional wage-setting hne. Notice that in the simplest versionof the story, there is full
employment
of skilled workers,and
the indicatedgap
simply^See, among others, Katz, Loveman and Blanchflower (1995), Murphy, Riddell and Romer (1998)
reflects unskilled
unemployment.
The
fact thatunemployment
increased inEurope
relative to the U.S. is often interpreted as evidence in favor of this explanation.-^
Notice that
both
of these explanations are "supply-side".Firms
are along theirrelative
demand
ciu-ves,and
different supply behavior or institutional characteristics ofthe
European
economies pick different points along the relativedemand
curves.This relative-
supply-demand framework
is not only aparsimonious specification, butalso enables
an
empirical investigation of whether these two approaches can providea satisfactory explanation for the behavior of skill premia in continental Europe. If
we know
the elasticity of substitution between skilledand
unskilled workers,we
caninvestigate whether the observed differences in the growth of relative
employment
ofskilledworkersare large
enough
toaccovmtforthedifferential behaviorofwage
inequality in Europe. In Section 3, I develop aframework
for undertaking such an investigation,and
in Section 4, I presentsome
empirical results using tliis framework.2.2
Differential
Changes
in
the Relative
Demand
for Skills
An
alternative to thetraditionalexplanationsinvolvesdifferential changesin therelativedemand
for skills across countries.These
differential changes could reflect four distinctforces:'*
1. Different countries could develop their
own
technologies, with different degrees of •'But in contrast to the prediction ofthis simple story, unemployment in Europe increased for allgroups, not simply for the low-education workers. See, for example, Nickell and Bell (1994), Card,
Kramartz and Lemieux (1996) and Krueger and Pischke (1998). Nevertheless, some of the increasein
unemploymentamongthe high-educationworkers inEuropemay reflecttheeffect ofwagecompression
within education groups on job creation (e.g., iffirms are forced to pay the same wages to low-skill collegegraduatesasthehigh-skill collegegraduates, they
may
stophiringthelow-skillcollegegraduates, increasing unemployment amongcollege graduates).''Yet another alternative is to introduce labor market imperfections that would also force firms to functionofftheir "relativedemandcurves" (the modelof Section 5 featureslabormarketimperfections,
butfirmsarestillalongtheir relativedemandcurves).
An
examplewould beefficient-bargainingbetweenfirms and unions. Nevertheless, even iffirmsareofftheir relativedemand curves, they will be located alongsomeequilibriumlocus, and in thiscase wehaveto explainwhy thisequilibrium locus isshifting
differentially. I
am
not aware ofany analysis of cross-country inequality trends using a model wherefirms areofftheir relativedemandcurves. HereIwilldevelop anexplanation thatkeepsfirmsalongtheir relative demand curves, but suggest why the relative demand curves may have changed differentially acrosscountries.
skill bias.
2.
Some
countries could be lagging behind the world technology frontier,and
may
not have adopted the
most
recent skill-biased teclmologies.3. Wliileallcountriesfacethe
same
technologyfrontier,some
may
haveadopted
more
skill-biased technologies from this frontier.
4. Different countries have experienced different degrees of trade opening, affecting
the
demand
for skills differentially.Although
the fourth explanation is the simplest, the current consensus is thatin-creased international trade played a limited role in the increase in the relative
demand
forskills ofthe recent decades (see the surveys
by Katz and
Autor, 2000,and
Acemoglu,2002). Therefore, I focus
on
the technological reasons for differential changes in therelative
demand
for skills. Plausibly,many
advanced
economies developsome
of theirown
technologies. InAcemoglu
(1999b), I analyzed amodel where
differences in localconditions
make
it profitablefor countries to developsome
of their ov,titeclmologies. Inthis context, I
showed
that greater trade with skill-scarceLDCs may
cause skiU-biasedtechnical change in the U.S., while inducing the development of
more
skiU-replacingtechnologies in Europe. Nevertheless, it appears plausible that
most
OECD
economieshave access,
and
even relatively rapid access, to thesame
set of technologies. This sug-geststhat themost
likelyreasonforwhy
the relativedemand
for skillsmay
ha\-ebeha\-eddifferently in continental
Europe
is not differential development ofnew
teclmologies orslow technology diffusion, but different incentives to adopt available technologies.
In the last section of the paper, I
make
a preliminary attempt to develop such atheory of differential adoption of available teclmologies.^ Here I briefly
summarize
themain
idea, leaving the details to that section.The
basic idea of the theory I propose^An alternative theory ofdifferential cross-country inequality trends is developed by Beaudry and
Green (2000). They construct a model in which capital scarcity is more harmful to unskilled workers.
The introduction of a new technology increases the demand for capital, and hurts unskilled workers. In Europe, capital is relatively more abundant than in the U.S., so the relative earnings of unskilled workersdonot decline as much.
is to link the incentives to adopt
new
technologies to the degree of compression in thewage
structure, wliich is in part determinedby
labor market institutions. In particular,institutional
wage
compression inEirropemakes
firmsmore
wilhng to adoptteclmologiescomplementary
to unskilled workers, inducing less skill-biased technical change there.This theory is based on three premises:
1.
There
issome
degree of rent-sharingbetween
firmsand
workers, for example, because ofbargaining over quasi-rents.2.
The
skill bias oftechnologies is determinedby
firms' teclmology choices.3.
A
varietyoflabormarket
institutionstend toincreasethewages
oflow-skillworkersin Europe, especially relative to the wages ofcomparable workers in the U.S.
All three premises are plausible.
The
finding ofhigh correlation betweenwages
and
firms' profitabihty or investments both in union
and
non-union sectors (e.g.,Katz and
Summers,
1989, Groshen, 1991, Blanchflower, Oswald,and
Sanfey, 1997) support theviewthat thereis
some
amount
of rent-sharing.That
teclmologyadoptionisendogenousis close to the heart of
many
economists,and
in previouswork
(e.g.,Acemoglu,
1998,and
especially,1999a, 2000), I developedthistheme
in detailand
showed
how
it can help us understand the behavior of thedemand
for skillsand wage
inequality in the U.S.Finally, the view that
minimum
wages, unions and social insuranceprograms
createwage
compression inEurope and
increase the pay of low-skill workers is widely sharedby most
economists,and
supportedby
existing evidence (e.g.,OECD,
1994, Blauand
Kahn,
1996).The new
implication of combining these three premises is that firms inEurope
may
find it
more
profitable to adoptnew
technologies with unskilled workers than theirAmerican
counterparts. This is because withwage
compression, firms are forced to payhigherwagesto unskilledworkersthan they
would
otherwisedo
(thatis, greaterthanthe"bargained" wage). This creates
an
additional incentive for these firms to increase theproductivity of unskilled workers: they are already paying high wages,
and
additionalmarket
institutions thatpush
the wages of these workersup
make
their employers theresidual claimantofthe increasein productivity
due
totechnologyadoption, encouragingthe adoption oftechnologies
complementary
to unskilled workers inEurope.^A
simple numericalexample
illustrates tliis pointmore
clearly.Suppose
that aworker's productivity is 10 without technology adoption,
and
20when
thenew
technol-ogy
is adopted.Assume
also thatwages
are equal to half of the worker's productivity,and
technology adoption costs 6 (incurred solelyby
the firm).Now
without technologyadoption, the firm's profits are equal to 1/2 x 10
=
5, while with technology adoption,they are 1/2 x 20
—
6=
4.The
firm, therefore, prefers not to adopt thenew
technologybecause ofthe subsequent rent-sharing.
Next
suppose that aminimum
wage
legislationrequires the worker to be paid at least 9. This implies that the worker will be paid 9
unless his productivity is
above
18.The
firm's profits without technologynow
changeto 10
—
9=
1, since it has topay
9 to the workerbecause oftheminimrun
wage. Incon-trast, its profits with technology adoption arestill 4. Therefore, thefinxi
now
prefers toadopt the
new
technology'.The
reason for this change is clear: because ofthe iTiinimumwage
laws, the firmwas
already forced to pay highwages
to the worker, evenwhen
Irismarginal product
was
low, so itbecame
the effective residualclaimant ofthe increase inproductivity
due
to technology adoption.This reasoning
imphes
that theremay
begreater incentives to invest in technologiescomplementing
workerswhose wages
are beingpushed
up by
labor market institutions.Since
European
labormarket
institutions increase thepay
of low-skill workers,teclinol-ogy
may
be
endogenously less skiU biased inEurope than
in the U.S.An
additional implicationn ofthismodel
is that institutionalwage
compression wallmake
job creation less profitable in Eiirope, thus as in the second explanation above,we
expectunemployment
inEurope
to increase relative to the U.S. Interestingly, inthis story, therise in
imemployment
can be across theboard
rather than falldispropor-tionately
on
the rmskiUed, wliich is consistent with the evidence (see the references in^This reasoningissimilar to the intuitionfor whyfirmsfind itprofitable toinvest inthetraining of their employeesin thepresence of labor market imperfections in Acemoglu and Pischke (1999). It also
relies onthe notion that firms obtain some "rents" from theemployment relationship. Inthe absence
footnote 3).
Therefore, the overall
macro
predictions of tliis approach are consistent withcross-county trends. However, as yet thereis nodetailed evidence supporting tliis theory,
and
an
empirical investigation of these ideasmay
bean
interesting area for futm^e research.3
Cross-Country
Relative
Demand
Shifts
3.1
The
Relative-Supply-Demand
Prame^vork
I
now
develop the relative-supply-demandframework
inmore
detail for a quantitativeevaluation of the traditional explanations. Consider the following simple
model
(see,e.g., Wekii, 1970,
Katz and Mvnphv,
1992, orAcemoglu,
2002): there are two typesof workers, unskilled (low-education) workers
and
skilled (liigh-education) workers. Idenote the
employment
of unskilledand
skilled workers in country j at time tby
L^ {t)and
H^
{t).These
employment
levelsmay
vary across countriesand
over timeboth
because of differences in the educationlevels of the population,
and
alsobecause, in thepresence oflabor
market
distortions, theremay
be imemploynient.The
aggregate production function foreconomy
j takes the constant elasticity ofsubstitution
(CES) form
Y^{t)
=
[{Ai{t)u{t)r
+
{Ai{t)w{t)rf',
(1)where
p<
1,and
A^, [t)and
A^
{t) are factor-augmenting technology terms, which are,for now, allowed to vary across countries.
The
elasticity of substitutionbetween
skilledand
unskilled workers in this production function is cr=
1/(1—
p).The
marginal product ofthe two factors can be written asMPl
[t)=
{Al {t)Y [{Af {t)Y+
{Ai {t)Y[W
{t)IV
[t)y] ^'~'^", (2)
and
MPh
=
{K
(0)' [{^i {t)Y {H^ it)lu
{t))-"+
K
(i))Suppose
thatwages
are related linearly to marginal product: w-'^ (t)=
PMPj^
{t)full marginal product, with
no
rent sharing. Irrespective ofthe value of/3,we
havewiit)
MPiity
That
is,'in this specification firms will be along their relativedemand
curves.Throughout
the paper, I will think ofo'-' [i]both
as ameasure
ofskillpremium
(suchasreturns to schooling)
and
as ameasure
of inequality. Thisismotivatedby
areasoningwhereby
evenamong
observationally equivalent workerssome
will bemore
"skilled",and
they will earn higherwages
commensurate
with their skillsand
themarket
price ofskills as reflected
by
uj^ (t) (see Juhn,Murphy
and
Pierce, 1993,Acemoglu,
2002). Inpractice, ofcourse, there are
many
other factors, in addition to, or instead of. the skillpremium,
determiningwage
dispersionamong
observationally identical workers.Alternatively, as long as firms are along their relative
demand
curve, the skillpre-mium
will beEquation
(3) canbe
rewritten in amore
convenientform by
taking logs,cr \A',{t)J
a
\V{t)j
This equation
shows
that the skillpremium
is decreasing in therelative supply of skilledworkers,
H^
{t)/U
{t), except in the special casewhere a
—> oo (where skilledand
unskilled workers are perfect substitutes).
Another
importantpoint to notefrom this equation is that as long as cr>
1, i.e., aslong as skilled
and
unskilled workers are gross substitutes,an
increase in Aj^ (t)/A] (t)corresponds to skill-biased technical change
and
raises the skill premiimiand wage
in-equahty. Interestingly,
when
cr<
1, it is a decline in A-'^^ {t)/Af (i) that corresponds toskill-biased technical change (see
Acemoglu,
2002).But
the case with cr<
1 is not ofgreat empirical relevance in thecontext of skilled
and
imskilled workers, sinceahnost allexisting estimates suggest that cr
>
1 (e.g.,Freeman,
1986).Let us start with a relatively
weak
form ofthecommon
technology assumption. In particular, suppose thatAi
it)=
viO' (0Ah
(0and
Aj {t)=
r^^O^ [t] A^(i).
'
(5)
This assuiBption can beinterpreted as follows.
There
is a world technology representedby
Ah
(t)and
Ai (f), wliich potentiallybecomes
more
orlessskill-biasedovertime.Comi-tries
may
differintheirabilitytouse theworldtechnologyefficiently,and
tliis iscaptured by theterm
6-' {t).Although
the ability to use world technology is time varying, it issymmetric between
the two sectors. In addition, comitriesmay
have differentcompara-ti\'e advantages iu the two sectors as captured b\- the ternis rfl
and
/?/ (though these areassumed
to be time invariant).Substituting (5) into (4),
we
obtainIno;^ (i)
=
c'+\na{t)
- 1
In(f^)
, (6)where
Ina[t]=
^^
In{A^ {t)/Ai [t)) is themeasure
of skill-biased technical change,and
c-J
=
^izln^^vi/vi-Then,
using U.S. datawe
canconstructan
estimateforthe change in Ina{t), denotedby
A
Ina[t), usingan
estimate for the elasticity ofsubstitution,a
as:ou.
,i..V^"(0
Alna(0
=
Aln.^^'(0+
-^1"
. n
where
j=
refers to theU.S.Although
the elasticityofsubstitutionbetween
skilledand
imskilled workers, a, is difficult to pin
down
precisely, there is a fairly well-establishedconsensus that it is greater than 1, perhaps aroimd 1.4, but possibly as large as 2 (see, e.g.. Freeman, 1986,
Katz
and
Mirrphy, 1992, Angrist, 1995,Card and
Lemieux, 2001).Hence, in the empirical exercise I will use cr
=
1.4and
cr=
2 as two reference values.Now
defme
Afe as the /c-period difference operator, i.e.,AfcX
=
X {t)—
X{t—
k).
Then,
predicted changes in the skill premiirm for country jbetween between
t—
kand
t are given by:^
AfclncI;^ {t)
=
Afclna(i)- ^A^ln
(f^)
(7)The
implicit assumption in this exercise is that there isno
delay in the adoption ofnew
teclinologiesacrosscountries. Instead, it is quite possible thatsome
ofthenew
skill-biased technologies developed or adopted in the U.S. are only introducedin continental
Europe
with a lag.That
is, instead of (5),we
would
have4
(i)=
viO' {t)Ah
{t-
k^)and AJ
(t)=
77/^^ (t)A
[t-
k^) , (8)implying that there is a delay of
y
periods for country j in the adoption of frontier technologies.Motivated
by
the possibility ofsuchdelays, asan
alternativemethod
I use U.S. datafrom 1974 to 1997 to recover estimates of
Alna(i),
and
calculate the average annualgrowth rate of Ina(i), denoted
by
g. I then constructan
alternate estimate for thepredicted changein the skill
premimu
in comrtry jbetween
dates t—
kand
t as:A,ln^^-(t)=^fc-^A,ln(|^^
(9)In tliis exercise, I use 1974 as the starting point, since it is five years prior to the
earliest observation for any other country
from
the LIS data,and
fiveyears appears as areasonable time lag for diffusion oftechnologies
among
theOECD
countries. I use 1997as the final year, since this is the final year for wliich there is LIS data for a comitry in
my
sample.Whether
the relative-supply-demandframework
provides a satisfactory explanationforcross-coimtry inequality trends can then
be
investigatedby comparing
the predictedskill
premium
changes, theA^
\\\Cj-' (f)'sfrom
(7)and
the Afclna)-' (i)'sfrom
(9), to theactual changes, the
At
Inu;^ (i)'s.^Equivalently, we can write:
Alnc^(t)
=
Aln ' ^'
a
\V
(t)where
A
Inx^(t)=
A
Ina;^ (t)—A
Inx°(t)withj=
astheU.S.,andinvestigatewhetherthisequationprovides agood fit tothedata.
4
Can
Differences
in
Relative Supplies
Explain
In-equality
Differences?
4.1
Data
I
now
undertake apreliminary investigation ofwhether differences in the behaviorrela-tivesupplies can explain the differentialinequality trends acrosscountries.
More
specifi-cally, I investigatewhetherequations (7)and
(9) provideagood
descriptionofthecross-countryinequality trends, I usedata
from
Luxembourg
Income Study
(LIS) dataset (see, for example, Gottschalkand
Smeeding, 1997, for an im-estigation of cross-countryin-come
inequality using this dataset,and
Gottschalkand
Joyce, 1998, foran
investigation of differences inwage
inequality). Because LIS data for different countries refer to dif-ferent years, Icombine
these with theMarch
Current Population Siurveys(GPS)
for thecorresponding years.
There
areanumber
ofdifficultiesin using theLISforthis purpose. First, informationon
years ofschoohng
or education is missing for anmnber
of countries. In particular,thereis
no
consistent education informationfor theUK
and
Sweden,and
fortheNether-lands, the education categories change over the sample period in a
way
thatmakes
itdifficult to construct
comparable
relative supply numbers. Second, forsome
countries,for example,
Belgium
and
Prance, incomes are reported after taxes. Third, because theLIS sample is limited to household heads, relative supplies have to
be
constructed forheads of households instead of the whole population. Finally, because weeks worked
information is missingfor
some
countries, annual earnings have tobe
used to constructskill (coUege) premia.
These
difficulties notwithstanding, the LIS provides a convenientdata set for a preliminary look at
whether
differences in relative supplies could accountfor the differential inequality trends.
The
skill premia are obtainedfrom
a log-wage regression analysis using annualearn-ings of full-time- fuU-year
male
householdheads aged of 18-64.The
"collegepremium"
isestimatedasthecoefficient
on
thediunmy
forcollegeeducation. Following other authors,in the case
where
there isno
education information, I use informationon
occupation(thisisthecasefor the
UK
and
Sweden, seethe Appendix).The
regression alsocontainsother education
dummies,
a quartic in age (since experience cannot be constructed forevery country),
and
a race or immigrantdummy
when
apphcable (see the Appendix).For the
CPS
calculations,when
earnings are top coded, they are assigned the value of1.5 times the tope code.^
The
90-10wage
differential is simply the log differencebetween
the earnings of thehousehold
head
at the 90th percentileand
those of the household head at the 10thpercentile (again the
sample
is limited to full-time-full-yearmale
heads ofhouseholds).Relative supplies are constructed adapting the
method
ofAutor,Katz
and Krueger
(1998) to the data available here. In particular, it is the ratio of niuuber of
college-equivalents divided
by
thenumber
ofnoncollege-equivalents. Here, I define collegeand
noncollege equivalents as follows:
college equivalents=college graduates-|-0.5xworkers with
some
college,and
noncollege equivalents=highschooldropouts
and
graduates-|-0.5x workers withsome
col-lege.
When
college information is not available, occupations are used for this calculation(see the Appendix). Moreover, for the Netherlands
and Germany,
there isno
separatecategory for those with
some
college.^ Presumably, workers withsome
college areal-ready included either with those with secondary education or
among
those with collegeeducation. Tliis
may
create problems with therelative supply estimatesfrom
these twocountries. For
aU
these calculations, I use a sample ofmale
heads ofhouseholds ratherthan the whole population, since the LIS only has information for heads ofhouseholds.
To
the extent that there are differential trends over the years across different countriesin female labor force participation, this hmitation of the LIS
may
create biases in theanalysis here.
^Because the sampleis narrower thanusual (in particular, it excludes women), is not weighted by weeks worked, and includes age instead of experience controls, the college premium for the U.S. is
estimated to belower than usual.
^For Germany, weonly use data from 1989 and 1994. The survey also includes data for 19S1 and
1984, but the 1981 survey is the first LIS survey, and dataquality is low and LIS advises against the useof this survey. The 1984 survey has a verydifferent classification ofeducation, and implausibh'few
people outside the categories of high school and high school and less. .Although I report overall wage
inequality numbers from the survey in Table 1, I do not use it for calculating returns to schooling or relative supplies.
Because there are a
number
ofproblems with the French data (for example, incomesare reported after taxes, there is
no
education variable for the firsttwo
surveys,and
itis not possible to limit the sample to full-time-full year workers), I exclude France from the analysis. I also exclude LiLxembourg since the sample size is small.
4.2
Empirical
Results
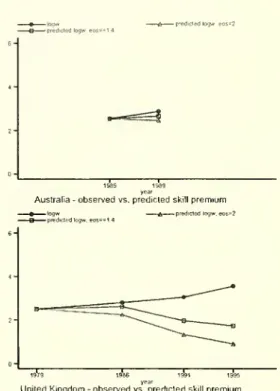
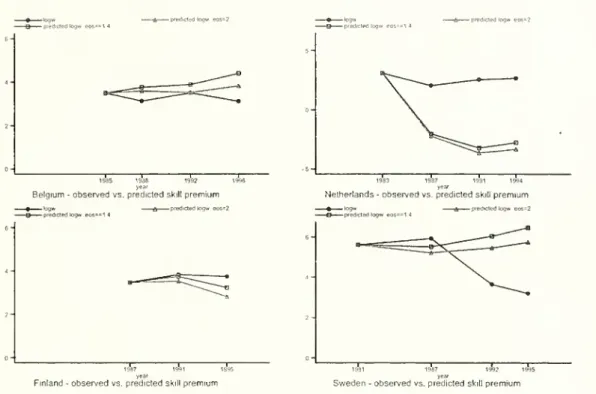
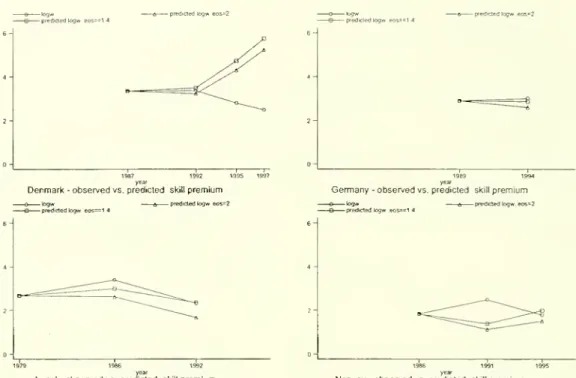
Figures 3a-c
and
4a-cshow
the results of the empirical exercise. Figures 3a-c depict theestimates obtained
from
(7) for two values ofthe elasticity ofsubstitution, cr=
1.4and
cr
=
2, while Figures 4a-cshow
the estimatesfrom
(9), again for thesame two
valuesofthe elasticity of substitution. In all cases, the change estimates, Aklnuj-' (t)
and
theA/elnu)-' (i), are translated into level estimates
by
choosing the first year estimate foreach country to be the
same
as the actual skillpremium
for that country.A
number
of patterns are apparentfrom
the figures, irrespective of whichmethod
and
which estimate of the elasticity of substitution are used. First, for Australiaand
and Canada,
the predictedskill premiaestimates are close to the actual estimates, whilefor the
UK,
the collegepremium
increasesmore
than predicted. Therefore, there is noevidence that the relative-supply-demand
framework
withcommon
technology trends ispredicting too large
an
increase in the skillpremia
among
theAnglo-Saxon
countries.ThisconclusionisconsistentwiththeresultsofKatz,
Loveman, and
Blanchflower(1995),Murphy,
Riddelland
Romer
(1998)and
Card and Lemieux
(2001).The
predicted skiUpremiaestimates are also close to the actual estimates for Finland
and
Norway.Second, for the Netherlands, the predicted skill premia decline, whereas the actual
skill
premia
remain approximately constant. This reflects substantial increase in therelative supplies of skills in this coimtry.
Given
the shortcomings of the LIS data forthe Netherlands noted above, increases in the relative supply of skills are likely to be
overstated,
and
these results need to be interpreted with caution. Next, forGermany,
Norway
and
Finland the predictedand
actual skill premiamove
more
orless in tandem.Hence, therelative-supply-demand
framework
withcoimnon
technology changes appearsto perform well for these countries,
though
it has to be borne inmind
thatGerman
relative supply changes
may
be
overstated in the LIS data.Finally, for Belgiiun,
Denmark, and
Sweden, the predicted skillpremia
estimatesincrease substantially while actual skill
premia
are approximately constant or actuallydeclined. For Israel, the
same
result is obtained using the firstmethod,
but not thesecond.
Given
the quality oftheLIS data, these resultshaveto be viewedaspreUminary,and
more
work
using detailed microdata from these countries is necessary to reachfirmer conclusions. Nevertheless, theresultssuggest that for a significant fraction ofthe
continental
European
coimtries in the sample, the relative-supply-demand frajBeworkwith
common
technology trends does not providean
entirely satisfactory explanationfor the differential behavior ofskill premia. Instead, it appears that relative
demand
for skills increased substantially less in Belgium,Denmark
and
Sweden
than in the U.S. orother
Anglo-Saxon
comitries.5
A
Model
of
Differential
Technology
Responses
I
now
develop a simple theorywhich
links the adoption of skill-biased technologiesto labor
market
institutions,and
providesan
explanation forwhy
technical changemay
havebeen
less skilled-biased inEurope
than in the U.S. Tliis theory buildson
aframework
I developed inAcemoglu
(1999a),and
combines it withsome
ofthe insights of the literatureon
training investments in the presence of labormarket
frictions (e.g.,Acemoglu,
1997,Acemoglu
and
Pischke, 1998, 1999).The
basic idea is that in a labormarket
withwage
bargaining, the incenti\-es offinns to invest innew
technologiesis affectedby
thedegreeofwage
compression. In particular,greater
wage
compressionmay
increasefirms' incentivesto raisethe productivity oflow-skill workers. I then suggest that the greater institutional
wage
compression inEurope
may
haveencouraged firms toadopt certaintechnologieswith low-skiUworkersthat U.S.firms did not adopt.
Throughout, I
wiU
keep the presentation at a heuristic level.The
reader is referredto
Acemoglu
(1999a) for a fuUer discussion ofa similarmodel
(but withoutan
analysisofthe
impact
of differences in wage-setting institutionson
technology clioices).5.1
The
Environment
There
is acontinuum
1 ofworkers that areinfinitelyhved
and
maximize
the net presentvalue ofincome discounted at the rate r.
A
fraction of these workers are skilled,and
have
human
capital /i^, wliile the remaining workers are unskilled withhuman
capitalhu
<
hs-Jobs in this
economy
are created via costly search as in the modelsby
Diamond
(1982),
Mortensen
(1982),and
Pissarides (1990).When
there areV
vacanciesand
U
imemployed
workers, there willbe
M({7,V)
new
matches
created. Notice thatwhat
matters is the total nun:iber of
unemployed
workers (skilled plus unskilled),and
as aresult, both skilled and unskilled workers will ha^•e the
same
matching
rates. Iassume
that the function
M
exhibits constant returns toscale, so matcliingratesare determinedsimply
by
thetightness of the labor market, 6=
jj.The
probability ofmatching
with aworkerfor a vacancyisq(6)
where
g isadecreasingfunction.The
probabilityofmatchingrate for an
unemployed
worker, in turn, is 6q[6),which
isassumed
to be increasingin d.I also
assume
thatmatches between
firmsand
workerscome
toan
end at theexogenousprobability s.
Firms
incur a setup cost 7^when
they post a vacancy at time t.Once
theymatch
with aworker, they decide
what
typeofajobto create. InAcemoglu
(1999a), I analyzedthe
more
realistic (andinvolved) casewhere
firmsdecidethetype ofjob beforematching.Here I focus
on
the casewhere
this decision ismade
aftermatching
in order to simplifythe analysis. Specifically, at time f, a firm
matched
with a worker ofhmnan
capitalh
can either produce
Ath
(10)units of the final good, without incurring any additional costs, or it can undertake
an
additional investment of cost kt
and
produce{I
+
a) Ath, (11)where
a
>
0.One
possible interpretation ofthe choicebetween
thetwo
technologies is that firmscan either use last period's technology at
no
cost, or adopt the frontier teclinologyby
incurring
an
additional cost every period.Notice that the multipHcative nature of the production function in (11)
makes new
technology
complementary
to skills.Also in terms of the
framework
discussed in the previous section, the elasticity ofsubstitution
between
skilledand
unskilled workers is infinity,and wage
inequaUty isunaffected
by
relativesupphes. Tliis istosimplify the discussionand
focuson
differentialtechnology responses of different economies.
5.2
Analysis
The
discounted net present value ofa firm with technology adoption decision Xf e {0, 1}and
matched
with a worker ofskillh G
{hu,hs} canbe
written as1
Jt (xt,h)
=
Ath
+
Xt{aAth
-
kt)~
Wt (xj,h)+
1
+
rsVt+i
+
(1-
s)max
Jt+i {xt+i,h)^t+i
(12)
where
Wt (xf,h) is thewage
as a fimction of the technology decisionand
the skill levelof the worker,
and
Vt+i is the value of a vacancy at time t+
I.The
wage
may
depend
on
the teclinology decision because ofbargainingover the quasi-rents createdby
searchfrictions.
The
term
sVt+i isadded
because with probability s, there is a separation,and
the firmbecomes
an imfiUed vacancy. Finally, the lastterm
is the continuationvalue conditional
on no
separation,and
I haveimposed
that there will beno
voluntaryseparations. This will
be
the case in steady state,and
I will focuson
the steady state allocation for simphcity.^"Next
suppose that Atand
ktgrow
exogenously at a constant rate, g, i.e.,At
=
{1+ gYA
(13)kt
=
{l+
gfk.'"Away from the steady state, workers
may
want to end the relationship with a firm that does notadopt the new technology voluntarily, and I'm ignoring thiscasein writingequation (12). In any case, suchvoluntary separationswould never happenalong the equilibrium path, since the technologj- adop-tiondecisions aretaken every period, sothe firmwould never choosenot to adoptthenewtechnology
whenitknowsthat this willresult in aquit.
Inaddition,
assume
thatwages
areequaltoafraction(3ofthe worker'sex post product:'
'
wt{xt,h)
=
l3[l+
Xta)Ath. (14)The
important assumption incorporated in this expression is thatwage
determinationtakes place after the firm sinks the cost of
new
teclmology. This is reasonable inprac-tice given the impossibility of wTiting binding
wage
contracts,and
that, wliilewages
are negotiated throughout the duration of the
employment
relationship,many
of thetechnology-related decisions are
made
before or at the beginning ofthis relationship.Using (14)
and
the fact thatboth
productivityand
costs aregrowing at the rateg asspecified
by
(13),we
can rewrite the steady-state value of a job that always adopts thenew
technology (x=
1)and
that ofajob that never adopts thenew
technology (;r=
0):J{x,h)
=
6[[l-l3){l
+ xa)Ah-xk]
(15)where
8=
~^^^^ is theeffective discount factor, taking into accomittime preference,separation probabihty
and
productivity growth.Notice that the firm only receives afraction 1
—
/3 ofthe output, though it incurs thefull cost of investment.
As
a result, firms will tend to underinvest in teclmology. Thisis a standard result, going back at least to
Grout
(1984),and
also emphasized in thecontext ofsearch equihbrium
by Acemoglu
(1996).It is straightforward to see that, in steady state, firms will choose to adopt the
new
teclmology with a worker ofskill level h if and only if
J
(x=
1, h)>
.7(x=
0,/i), or if{l-l3)aAh>k.
(16)The
fact that the left-hand side of this expression is increasing inh
reiterates thatnew
technologies are
complementary
to skills,and
thereforemore
likely to be adopted withskilled workers.
Next, consider the case:
{\-0)otAK>k.
(17)'^More formally,I'm assumingthatwages aredeterminedbyoutside-option bargaining asin
Ruben-stein (1982) and Shaked and Sutton (1984) (see Acemoglu, 1996, forajustification in the search equi-librium context).
This condition ensures that firms are
happy
to adopt anew
technology even withun-skilled workers. Clearly (17) immediately implies that (1
—
(3)aAhs
>
k. So thenew
technology will be adopted with skilled workers as well.
Then,
wages
will be givenby
w^
=
P
{1+
a)Ahu
and
wt=
p
{1+
a)Ath„
. (18)so the skill premirun (or the
measure
wage
inequality) in each period is simply_
w^t_
hs^
~
w^
hu
In this equilibrimn, there is steady technical change,
and wages
are increasing at aconstant rate.
But wage
inequality remains stable, because allnew
technologies areimplemented
both with skilledand
unskilled workers, so technical change is "neutral"towards skills.
Itis alsostraightforward tocharacterizethe equilibrium tightness ofthe labor
market
and
theunemployment
rate. In particular, given condition (18), the value of a vacancyat time t can be written as:^^
Vt
=
-it
+
q{Ot))max{Jt
{x—
1,hs) ;Jt{x=
0,hs)} (19)+
(1 -(/))max{.7t(x=
l,/i„); Jt(x=
0,/i„)}+
(1-
g(^t))max{T4+i;0}
X J
Here 7j is the cost of opening a vacancy.
With
probability q{9t), the vacancymatches
with a worker, and with probability 0, thisworker is skilled,
and
with probability 1—
d,he is unskilled.
The
firm then decides whether to adopt thenew
technology or not ascaptured
by
the"max"
operators.With
probability 1—
q{9t), there isno
match,and
then the firm decides
whether
to keep the vacancy, obtaining the value Vt+i or shutdown.
Assume
that the cost of vacancy -y^ also grows at the rate g, that is, 7j=
(1-1-g) 7,
and
impose free entry,which
implies that Vt=
K+i
=
0.Then,
using (15),we
obtainthat in steady state:
V
=
~j
+
q {9''"') [6((1 -f3){l+
a)A-
k) (</>/i,+
(1-
0)K)]
=
0, (20)^^Without loss
ofany generality, I'm usingthetiming conventionthata vacancythat getsfilledthis period can start production in thisperiod.
where
6^"' is the steady-state tightness ofthe labor market, with the superscript "Pre"denoting the fact that tliis refersto the case before the tecliriology shock. This tightness
and
the whole equilibriiun allocation are defined uniquely.Next, thesteady state
unemployment
rate for bothskilledand
mrskilled workers is:^''^
=
7Tkwy
''''The
important point isthat bothskilledand
unskilled workershave thesame
unemploy-ment
rate,and
that thisunemployment
rateis a decreasing functionof^:unemployment
will
be
lowerwhen
the labormarket
is tighter.5.3
Change
in
Technology
Regime
Now
imagine that theeconomy
is liitby an
adverse shock at time T, increasing kj- tok'j^
>
kx-^'^From
this point onwards,both
kand
A
grow
at at thesame
rate as before,i.e.,
Ar+t
=
(1+5)'^t and
fcj+j=
[l+
gYk'j..Assume
also that followingthistechnologyshock,
we
have:(1
-
P)aArh,
>
k'j->
[l-
(3)aArK.
(22)Condition (22) implies that firms, fi-om this point onwards, will continue to adopt the
new
technology with skilled workers, but not with unskilled workers.That
is, thenew
technology adoption condition (16) is
now
satisfied for skilled workers only.As
aresult,wages at
any
time t>T
arenow
Wf
=
l3Athuand
u'f=
(3{I+
a) Ath^.so after this technology shock,
wage
inequahty increases to,
wf
. . hs'^•
=
^
=
<'+
"'fc:-'''Thisunemploymentrateequation followsby equatingtothe flowoutofunemployment, Oq(6) u, to
the flow intounemployment, (1 — s)u. Thefactthatbothtypesofworkershavethesameunemployment
rate is a consequence of the simplifying assumption that all search is undirected, and no matches are turned down. It is straightforward, but cumbersome to generalize the model by adding some
heterogeneity, or by allowing firms toturn down workers asin Acemoglu (1999a)
.
'"Notice thatI
am
takingthetechnology shocktobe an increaseinthe cost ofnew investment. Thisisconsistentwiththe factthatallthecountriesinquestionexperienceda
TFP
slowdownoverthistimeperiod. Nevertheless, many other economists view the 1980s as a period of more rapid technological
change (e.g., Greenwood and Yorukoglu, 1997, Hornstein and Krusell, 1996). See Gordon (1998), Jorgensen and Stiroh (2000) and the discussioninAcemoglu (2002).
In addition,
unemployment
forboth
types of workers increases.To
see this note that the free-entry conditionnow
changes toV=-^
+
q(^'-'S-Po^t^)
[^(^((1
_
^) (1+
^)^
_
;,) ;,^+
(1_
^) (j_
^)y^/^^^]=
q, (23)wliich incorporates the fact that
now
firms will not adopt thenew
technology withmiskilled workers.
The
steady-state labormarket
tightness is denotedby
9 ~^°^^^ sinceitreferstotheequilibrium afterthechangeintechnologyin the
model
economy
supposed
to approximate the U.S.
Comparing
this expression to (20)shows
that, as a consequence of the teclinologychange, opening a vacancy is
now
less profitable (i.e. the term in square Vjrackets hasfallen). So 9, tlie tightness of the labor market, has to decline to satisfy (23)
—
that is,^^^'P°''*
<
9^^'^, This impHes,from
equation(21), that the
imemployment
rate willincrease.^'^
So at a very simple level, this
model
illustrateshow
a technological shockmight
increase
wage
inequalityby
changing the technology adoption decisions of firms. Afterthe change in technology, firms find it profitable to invest in
new
technologies only withskilled workers,
and
as aresult, therelative productivity ofskilled workersand
the skillpremium
increase.5.4
Change
in
the
Technology
Regime
in
the
"European"
Equi-Hbrium
Now,
consideradifferent environment,meant
to proxyataverycrudelevelthecontinen-tal
European
labor market. In this environment, there is institutionallyimposed wage
compression, for
example
because there is aminimum
wage
at a level that is bindingfor unskilled workers. This contrast captures in a styUstic
way
the differencesbetween
the
American
and
continentalEuropean
labor markets. For example,Blau
and
Kalm
(1996) provide evidence in favor of the hypothesis that labor market regulations
com-press
wage
differences at thebottom
of the distribution in Europe.They show
that'^Thisisconsistentwith thefactthat unemploymentboth amonglow andhigheducationworkers in the U.S. increasedduringthe 1980s (seeAcemoglu, 1999a).
although
wage
differentialsbetween
the 90thand
the 50thwage
percentiles are similar across countries, the differential betweenthe 50thand
10th percentilesismuch
larger inthe U.S. than Europe.
Union
wage
setting, which extendswage
floors across firms, orrelatively high
mimmum
wages, as well asmore
generous social insurance progr'ams, areprobably at the root of tliis
wage
compression.Denote
theminimum
wage
in effect at time ^by
u^;. Since theeconomy
is growing, theminimum
wage
has togrow
as well—
otherwise, itwould
quicklybecome
irrelevant.So
Iassume
^t=
(1+
gYw
Also to illustrate the
main
point, it ismost
convenient toassume
that at time t=
0:,5(1
+
q)Ahu
>
w>
PAhu
and
i3Ahs>
w. (24)That
is, theminimum
wage
is binding for afirm that Iriresan
miskiUed w^orkerand
doesnot adopt the
new
technology. In contrast, it is not binding for a firm that adopts thenew
technologywithan
unskilled worker.And
it is never bindingfor afirmemploymg
askilled worker. Since both productivity
and
minimum
wages
grow
at thesame
constantrate, (24) ensures the
same
configuration at all tIn the presence ofthe
minimmn
wage
law, thewage
equation (14) camiot apply, since(24) implies that
some
workerswould
be paid less than theminimum.
Hence, considera straightforward generalization of this
wage
equation to:^''Wt{xt,h)
=
rmix{Pi\
+
Xta)Ath,w^}
. (25)So if the "eciuilibrium bargained wage" in the absence of the
mimmum
wage
is belowthe
minimum,
the worker is simply paid theminimum.
Since nothing has changed forskilled workers, the condition for the
new
technology tobe
adopted is thesame
as inthe unregulated economy, i.e., (1
—
/3) (1 4- a)Ahg
>
k.But
the technology decision for unskilled workers has changed. In particular,now
the
minimum
wage
will be binding for a firm employingan
unskilled worker with theold technology, so
J{x
=
0,K) =
6{Ahu
-w).
(26)'^Thiswagerule followsfromisstraightforward applicationoftheRubinstein(1982) bargainingmodel
withoutside options (seeShaked and Sutton, 1984).
In contrast, tlie value of the firm that adopts the
new
technology with an unskilledworker is still given
by
J[x^l,K)
=
b{[l-
p) (1+
q)Ahu
-
k) ,(27)
because,
when
the firm adopts thenew
technology, theminimum
wage
is not binding.Comparing
the expressions (26)and
(27)shows
that the firm will find it profitable tointroduce the
new
technology with an unskilled worker if{1-
P)aAh^-k>
PAK-w.
(28)Assumption
(24), wliichmeant
that theminimum
wage was
binding for unskilledwork-ers, also immediately ensures that theright hand-side of (28) is negative. Consequently,
the condition for this
economy
to adoptnew
technologies with unskilled workers is lessrestrictivethan for theunregulated
economy
(recall theunregulatedeconomy
adoptsthenew
technologywhen
(1—
/?)aAhu —
k>
0).The
intuitionis as foUows: the institutions alreadyforce the firm topay
anunskilledworker ahigher
wage
thanwhat
the firmand
the workerwould
have bargained to. ThisimpMes
that the firm can investmore and
increase production, without this increasedproductivity being translated into higher wages.
Wage
compression is thereforemaking
the firm the residual claimant of the increase in the productivity ofthe worker.
This reasoning is similar to the intuition for
why
firms find it profitable to invest inthe general training of their employees in the presence oflabor market imperfections in
Acemoglu and
Pischke (1999). Also as inAcemoglu
and
Pischke (1999), labormarket
rents for firms are crucial for this result.
With
/?=
1, that is,when
there areno
rentsforfirms, ifinstitutions
pushed
thewages
ofunskilled workersup, firmswould
lay offall unskilled workers.'^Now
imagine a situation inwhich
firms invest innew
technology with both skilledand
unskilled workers, even in theabsence oftheminimum
wage. Then, a fortiori, firms in the "European" equilibrium will also invest innew
technology with both types ofworkers. Next, as discussed in subsection 5.3, imagine a change in technology' regime
'^Ofcourse, in this casewe also need 7