HAL Id: hal-01174287
https://hal.archives-ouvertes.fr/hal-01174287
Submitted on 8 Jul 2015
HAL is a multi-disciplinary open access
archive for the deposit and dissemination of
sci-entific research documents, whether they are
pub-lished or not. The documents may come from
teaching and research institutions in France or
abroad, or from public or private research centers.
L’archive ouverte pluridisciplinaire HAL, est
destinée au dépôt et à la diffusion de documents
scientifiques de niveau recherche, publiés ou non,
émanant des établissements d’enseignement et de
recherche français ou étrangers, des laboratoires
publics ou privés.
Degradation by Hydrogen Peroxide of
Metal-Nitrogen-Carbon Catalysts for Oxygen Reduction
Vincent Goellner, Vanessa Armel, Andrea Zitolo, Emiliano Fonda, Frédéric
Jaouen
To cite this version:
Vincent Goellner, Vanessa Armel, Andrea Zitolo, Emiliano Fonda, Frédéric Jaouen. Degradation by
Hydrogen Peroxide of Metal-Nitrogen-Carbon Catalysts for Oxygen Reduction. Journal of The
Elec-trochemical Society, ElecElec-trochemical Society, 2015, 162 (6), pp.H403-H404. �10.1149/2.1091506jes�.
�hal-01174287�
A
uthor
Pr
oof
Journal of The Electrochemical Society, 162 (6) H1-H12 (2015) H1
Degradation by Hydrogen Peroxide of Metal-Nitrogen-Carbon
Catalysts for Oxygen Reduction
1 2
Vincent Goellner,a,∗Vanessa Armel,a,∗Andrea Zitolo,bEmiliano Fonda,b
and Fr´ed´eric Jaouena,∗∗,z 3
4
aInstitut Charles Gerhardt Montpellier, UMR CNRS 5253, Agr´egats, Interfaces et Mat´eriaux pour l’Energie,
Universit´e Montpellier, 34095 Montpellier cedex 5, France
5 6
bSynchrotron SOLEIL, L’Orme des Merisiers Saint-Aubin - BP 48, 91192 Gif-sur-Yvette, France
7 8
Fe-N-C and Co-N-C materials are promising catalysts for reducing oxygen in fuel cells. The degradation of such catalysts induced by H2O2was investigated by contacting them ex situ with various amounts of H2O2. The degradation increased with increasing
amounts of H2O2. The effect was most severe for Cr-N-C followed by Fe-N-C and last by Co-N-C. Treatment with H2O2leads
to diminished oxygen reduction activity at high potential and/or reduced transport properties at high current density in fuel cell. From spectroscopic characterisation, it was found that 66 and 80% of the CoNxCyand FeNxCymoieties present in pristine catalysts
survived the extensive H2O2treatment, respectively. In parallel, the activity for oxygen reduction was divided by ca 6–10 for Fe-N-C
and by ca 3 for Co-N-C. The results suggest that the main degradation mechanism in fuel cell for such catalysts is due to a chemical reaction with H2O2that is generated during operation. The super-proportional decrease of the oxygen reduction activity with loss of
FeNxCyand CoNxCymoieties suggests either that only a small fraction of such moieties are initially located on the top surface, or
that their turnover frequency for oxygen reduction was drastically reduced due to surface oxidation by H2O2. 9 10 11 12 13 14 15 16 17 18
© The Author(s) 2015. Published by ECS. This is an open access article distributed under the terms of the Creative Commons Attribution Non-Commercial No Derivatives 4.0 License (CC BY-NC-ND,http://creativecommons.org/licenses/by-nc-nd/4.0/), which permits non-commercial reuse, distribution, and reproduction in any medium, provided the original work is not changed in any way and is properly cited. For permission for commercial reuse, please email:[email protected]. [DOI:10.1149/2.1091506jes] All rights reserved.
19 20 21 22 23 24
Manuscript submitted February 5, 2015; revised manuscript received March 11, 2015. Published 00 0, 2015. This was Paper 1589 presented at the San Francisco, California, Meeting of the Society, October 27–November 1, 2013.
25 26
Electrochemical energy conversion devices are expected to play an
27
increasing role for stationary and transportation applications as well as
28
for reversible energy storage. Among the various applications already
29
in use or contemplated for electrochemical devices, the transportation
30
sector is the most demanding in terms of energy density, power density
31
and cost.1 Driving a full-size car over 100 km requires ca 13 kWh of
32
mechanical energy.2While batteries are more efficient than fuel cells,
33
the higher energy density of H2/air fuel cells relative to the lithium-34
ion battery (1.8 kWh per kg of H2-reservoir at 690 bars; compared to 35
0.2 kWh per kg of Li-ion battery pack) is critical for designing a system
36
that can propel a car over 500 km without refuelling or recharging.2-3
37
Hence, the polymer electrolyte membrane fuel cell (PEMFC) is
to-38
day the most promising electrochemical device for replacing internal
39
combustion engines, with uncompromised driving range and power
40
density.3 Mid-term remaining challenges for PEMFCs are increased
41
durability and reduced cost, while a longer-term challenge is the
re-42
placement of the rare and expensive platinum element by catalysts
43
based on Earth-abundant metals.1,4-5 Today, ca 80–90% of the mass
44
of Pt in a PEMFC stack is placed at the cathode due to the sluggish
45
oxygen reduction reaction (ORR) compared to fast hydrogen
oxida-46
tion at the anode. Based on projections for mass production, Pt-based
47
catalysts in today’s PEMFC technology are expected to account for
48
ca 50% of the material’s cost of a fuel cell stack.4,6Significantly
re-49
ducing the Pt loading in cathodes or eliminating the platinum metal
50
altogether from ORR catalysts are two possible approaches to tackle
51
this cost problem.3,5
52
While the concept of ORR catalysis by materials or molecules
53
comprising Fe or Co, nitrogen and carbon elements is known since
54
1964,7breakthroughs in the ORR activity and fuel cell performance
55
that were necessary to seriously consider Fe(Co)-N-C catalysts as
po-56
tential substitutes to platinum in the acidic environment of PEMFCs
57
were reported only after 2008.2,8–14While major advances in the ORR
58
activity and power density of PEMFC comprising Fe(Co)-N-C based
59
cathodes have been reported, the next grand scientific challenges are
60
i) improved understanding of the structure of the active sites and
61
∗Electrochemical Society Student Member. ∗∗Electrochemical Society Active Member.
zE-mail:[email protected]
ii) improved understanding of the degradation mechanisms. Depend- 62
ing on the latter, mitigation approaches might be very different: i) 63
system-based solutions to avoid the transient high-potential polariza- 64
tion during start-up and shutdown, ii) catalyst-based approaches in 65
order to avoid the formation of H2O2 during ORR or to endow the 66
catalysts with a higher graphitic character, iii) novel cathode designs 67
in order to stabilize its electrical, hydrophilic and diffusion properties. 68
A restricted number of studies have focused on the degradation mech- 69
anisms of Fe(Co)-N-C catalysts.15–28Fe-N-C catalysts pyrolyzed in 70
NH3have shown the highest initial activity and power performance 71
thus far, but degrade very quickly in PEMFC, mostly due to a proto- 72
nation and anion-binding effect of highly-basic surface N-groups that 73
are characteristic of NH3 pyrolysis.16Fe(Co)-N-C catalysts synthe- 74
sized at high temperature in inert gas are initially less active but are 75
more stable in PEMFC.8–10,15,26Disentangling the various degradation
76
phenomena of Fe(Co)-N-C cathodes occurring during PEMFC opera- 77
tion is complex. Water flooding, changes of the hydrophilic properties 78
of the cathode, loss of a fraction of the active sites through dissolu- 79
tion or via oxidative attacks generated by either the cathode potential, 80
H2O2 or radical oxygen species (ROS) formed between H2O2 and 81
the transition-metal-based active sites may all account to some de- 82
gree for the overall decline of the cathode performance with time. In 83
a first attempt to disentangle these phenomena, we recently investi- 84
gated on a well-defined Fe-N-C catalyst the degradation incurred by 85
high-voltage cycling.21 This phenomenon is the least complex one
86
to separately investigate from other degradation routes since it is not 87
linked to the ORR. It was concluded that the FeNxCymoieties initially 88
present in the Fe-N-C catalyst were not immediately destroyed after a 89
polarization up to 1.4–1.5 V vs. RHE. However, bulk oxidation of the 90
carbon matrix in which these active sites are embedded ultimately lead 91
to the massive dissolution of FeNxCymoieties. In addition, increased 92
electric resistance of the cathode layer after high potential cycling 93
also contributed to the decline of the cathode performance.21Due to
94
the integration of Fe(Co)NxCymoieties at the edge of graphene sheets 95
or within the sheets, these materials are intrinsically more prone to 96
degradation when subjected to high electric potential than Pt/C cat- 97
alysts. More graphitic matrices may be resorted to for synthesizing 98
Fe(Co)-N-C catalysts. However, it is notoriously difficult to achieve a 99
high density of Fe(Co)NxCymoieties in highly graphitic substrates via 100
pyrolysis.23,29Mitigation of the degradation induced by high-voltage
A
uthor
Pr
oof
on Fe(Co)-N-C catalysts should therefore be most effective by
focus-102
ing on the causes of the high-voltage transients, namely i) the purging
103
of uncombusted H2at the anode with air and ii) the non-selectivity of 104
platinum for hydrogen oxidation.30–32
105
The present work focuses on the oxidative attack of Me-N-C
106
catalysts by minute amount of H2O2 that is produced due to the 107
incomplete electro-reduction of O2to H2O during fuel cell operation. 108
This degradation mechanism can probably not be dealt with at a
sys-109
tem level and is therefore an inescapable issue for Me-N-C catalysts.
110
While the % H2O2 produced during ORR is often not much higher 111
on Fe(Co)-N-C than on Pt/C catalysts,25–27,33–34 the residence time
112
of H2O2 in the electrode may be longer with Fe(Co)-N-C catalysts 113
due to their extremely poor activity for the electro-reduction of H2O2 114
to H2O,33,35and poor activity for the chemical disproportionation of 115
H2O2.27,33,35–36Chemical disproportionation of H2O2is ca two orders 116
of magnitude faster at high pH for such catalysts,36highlighting the
117
possibility to recycle H2O2at high pH but impossibility to do so at 118
low pH. In contrast, platinum is an excellent catalyst for both the
119
four-electron reduction of O2to H2O and the two-electron reduction 120
of H2O2to H2O.33,37The important difference between the durability 121
of Pt/C and Fe(Co)-N-C catalysts in PEMFC may thus stem from their
122
different reactivity toward H2O2. Moreover, chemical disproportion-123
ation of H2O2 on Fe(Co)-N-C catalysts via Fenton chemistry might 124
produce a significant amount of radical oxygen species (ROS).38–40
125
While suspected, the role of H2O2in the degradation of Fe(Co)-N-C 126
based cathodes during steady-state operation of a PEMFC has not
127
yet been investigated in depth. Early work by Wiesener showed that
128
addition for every 100 h of a given aliquot of H2O2to the electrolyte 129
lead to a faster degradation of a Co-N-C catalyst.41Ex situ chemical
130
degradation of Fe-N-C catalysts with H2O2was investigated in 2003 131
by Lef`evre.25A series of catalysts were immersed in H
2O2solutions of 132
various concentrations. The ORR activities measured with a
rotating-133
disk electrode (RDE) were shown to have strongly decreased. More
134
recently, Zelenay’s group applied a different ex situ H2O2treatment, 135
keeping the H2O2concentration fixed but varying the duration of im-136
mersion of the catalyst.26In addition to measuring the ORR activity
137
in RDE before and after the treatments, also the elemental
compo-138
sition was determined by X-ray photoelectron spectroscopy (XPS).
139
A comprehensive understanding of the degradation mechanism of
140
Me-N-C catalysts upon contact with H2O2 solution is however still 141
lacking, especially regarding spectroscopic changes of the transition
142
metal coordination.
143
In the present work, we synthesized a Fe-N-C, a Co-N-C and a
144
Cr-N-C catalyst and contacted them with various amounts of H2O2 145
corresponding to ratios of mol H2O2 per mass of catalyst ranging 146
over ca two orders of magnitudes. The ORR activities of the catalysts
147
before and after H2O2 treatment were determined with RDE and in 148
PEMFC. The pristine and treated materials were characterized with
149
X-ray diffraction, X-ray absorption spectroscopy, X-ray photoelectron
150
spectroscopy and, for Fe-N-C, with57Fe M¨ossbauer spectroscopy. 151
Experimental
152
Synthesis.— Catalyst precursors were prepared via a dry 153
ballmilling approach from a Zn(II) zeolitic imidazolate framework
154
(ZnN4C8H12, Basolite Z1200 from BASF, labelled ZIF-8), Fe(II) ac-155
etate (Fe(II)Ac), Co(II)Ac, Cr(II)Ac and 1,10-phenanthroline. The
156
Fe-N-C and Co-N-C catalysts were synthesized identically: weighed
157
amounts of the dry powders of Fe(II)Ac (or Co(II)Ac), phenanthroline
158
and ZIF-8 were poured into a ZrO2 crucible. Then, 100 zirconium-159
oxide balls of 5 mm diameter were added and the crucible was sealed
160
under air and placed in a planetary ball-miller (FRITSCH Pulverisette
161
7 Premium) to undergo 4 cycles of 30 min of ballmilling at 400 rpm.
162
The resulting catalyst precursor was pyrolyzed at 1050oC in Ar for 163
1 h. The catalyst precursors contained 1 wt% of metal and the mass
164
ratio of phenanthroline to ZIF-8 was 20/80.9,21The mass loss during
165
pyrolysis was 60–65 wt%, leading to Fe and Co contents of 2.5–2.9
166
wt%. The catalyst precursor for Cr-N-C was prepared identically, but
167
the pyrolysis was performed under flowing NH3at 950◦C for 15 min. 168
Figure 1. Scheme of the experimental setup used for ex situ H2O2
degradation.
When pyrolyzed in Ar, the initial ORR activity of Cr-N-C was too 169
low to be of interest. The resulting Cr-based catalyst was then acid 170
washed in a pH 1 sulphuric acid solution and copiously washed with 171
de-ionized water. The acid washing was applied only to Cr-N-C in or- 172
der to compare its ORR activity to the Ar-pyrolyzed Fe- and Co-N-C 173
catalysts. It is known that pyrolysis in NH3leads to a higher initial 174
ORR activity, mostly due to the presence of highly basic surface N- 175
groups.16This promotion of ORR activity due to the high basicity of 176
N-groups is usually suppressed after an acid wash, which protonates 177
basic N-groups followed by anion adsorption. The mass loss during 178
pyrolysis for the Cr-based catalyst precursor was 85–90 wt%, leading 179
to 8–10 wt% Cr in Cr-N-C. 180
Chemical treatment with hydrogen peroxide.— 100 mg of catalyst 181
was dispersed and stirred in (500 – X) ml of deionized water heated 182
to 80oC under reflux. A piece of Nafion 117 membrane with area 4.84 183
cm2was also immersed in solution in order to serve as an indicator 184
for ROS. The scalar X represent the total volume of 30 wt% H2O2 185
solution that was added to reach the desired number of mol H2O2 186
per mg of catalyst. This volume was systematically divided in four 187
aliquots of X/4 ml, each aliquot being added with a one hour time 188
interval. Once the total desired volume of H2O2had been added, the 189
solution was stirred for 24 h at 80oC under reflux and then allowed to 190
cool down to room temperature. The entire experimental setup can be 191
visualized in Fig.1. For example, in order to reach a ratio of 10−2mol 192
H2O2per mg of catalyst, four aliquots of 25 ml each of 30 wt% H2O2 193
solution were added every hour to a solution initially containing 100 194
mg of catalyst dispersed in 500-(4× 25) ml of deionized water. In 195
the present study, the ratio of mol H2O2per mg catalyst was spanned 196
from 5× 10⁻⁴to 2× 10⁻²by changing the cumulative volume of 30 197
wt% H2O2 from 5 to 200 ml. Each H2O2 treatment was terminated 198
with a one hour sonication of the solution to solubilize fluoride ions 199
A
uthor
Pr
oof
was removed and the solution filtrated using a B¨uchner setup with
201
a 220 nm pore-sized filter. The filtrate was stored for fluoride ion
202
analysis while the collected catalyst powder was copiously washed
203
with de-ionized water (ca one litre) before overnight drying at 90◦C.
204
The collected mass of dry catalyst powder was then weighed while
205
the fluoride ion concentration in the filtrate was measured using an ion
206
selective electrode. To avoid any interference of the pH, the electrolyte
207
solution was adjusted with the appropriate ionic strength adjustment
208
buffer (TISAB IV from Sigma-Aldrich) in order to keep the pH in the
209
range of 5–7. TISAB solution also prevents complexation of fluoride
210
ions with any iron or other trace metals present in solution.
211
Structural characterization.— Metal K-edge X-ray absorption 212
spectra were recorded at room temperature at SAMBA beamline of
213
Synchrotron SOLEIL. The beamline is equipped with a sagittaly
fo-214
cusing Si 220 monochromator and two Pd-coated collimating mirrors.
215
The mirrors have been used to remove X-rays harmonics. The catalysts
216
were pelletized as disks of 10 mm diameter using a 50/50 mass ratio
217
of Teflon powder (1μm particle size) and catalyst. The spectra were
218
recorded in transmission mode and the energy was calibrated with
219
the corresponding metal foils to correct any change in beam energy
220
during the experiments. All experimental spectra were normalized
221
and analyzed identically with Athena software in order to derive the
222
XANES and Fourier-transform EXAFS spectra. X-ray diffraction was
223
conducted using a PANanalytical X’Pert Pro powder X-ray
diffrac-224
tometer. XPS spectra were recorded with a Physical Electronics PHI
225
5701 spectrometer. Non-monochromatic Mg KαX-ray was used as
226
the excitation source. For the pristine and H2O2-treated Fe-N-C cata-227
lysts,57Fe M¨ossbauer spectra were measured with a source of57Co in 228
rhodium. The measurements were performed keeping both the source
229
and the absorber at room temperature. The spectrometer was operated
230
with a triangular velocity waveform, and a NaI scintillation detector
231
was used for detecting theγ-rays. Velocity calibration was performed
232
with anα-Fe foil.
233
Electrochemical characterization.— Electrochemical activity of 234
the catalysts toward the ORR was determined using the RDE
tech-235
nique. A catalyst ink including 10 mg of catalyst, 109 μl of a
236
5 wt% Nafion solution containing 15–20% water, 300μl of ethanol
237
and 36μl of de-ionized water was sonicated and mixed using a vortex.
238
An aliquot of 7μl was deposited on the glassy-carbon disk (0.196 cm2) 239
resulting in a catalyst loading of 800μg · cm−2. The working electrode
240
with the deposited catalyst layer was used in a three-electrode cell
241
setup connected to a potentiostat (Versastat 3, AMETEK) and rotator
242
(MSR, Pine Instruments). The counter electrode and reference
elec-243
trode were a graphite rod and a reversible hydrogen electrode (RHE),
244
respectively. The electrolyte was an O2-saturated aqueous solution of 245
0.1 M H2SO4. The RDE polarization curves were recorded with a scan 246
rate of 10 mV· s−1at 1500 rpm and corrected for the background
cur-247
rent measured in N2-saturated electrolyte. Additional measurements 248
were similarly performed with a rotating-ring disk electrode for
de-249
termination of the % H2O2 released during ORR. The ring potential 250
was held at 1.2 V vs. RHE. Selected catalysts were investigated in
251
fuel cell. For the membrane electrode assembly (MEA), cathode inks
252
were prepared using the following formulation: 20 mg of catalyst,
253
652μl of a 5 wt% Nafion solution containing 15–20% water, 326
254
μl of ethanol and 272 μl of de-ionized water. The inks were
alterna-255
tively sonicated and agitated with a vortex mixer every 15 min, for a
256
total of 1 h. Then, three aliquots of 405μl of the catalyst ink were
257
successively deposited on the microporous layer of an uncatalysed
258
4.84 cm2 gas diffusion layer (Sigracet S10-BC) to reach a catalyst 259
loading of 4 mg cm−2. The cathode was then placed in a vacuum oven
260
at 90◦C to dry for 1 h. The anode used for all PEMFC tests performed
261
in this work was 0.5 mgPt· cm−2 on Sigracet S10-BC. MEAs were 262
prepared by hot-pressing 4.84 cm2anode and cathode against either 263
side of a Nafion NRE-211 membrane at 125◦C for 2 min. PEMFC
264
tests were performed with a single-cell fuel cell with serpentine flow
265
field (Fuel Cell Technologies Inc.) using an in-house fuel cell bench
266
and a Biologic Potentiostat with a 50 A load and EC-Lab software.
267
For the tests, the fuel cell temperature was 80◦C, the humidifiers were 268
set at 85◦C, and the inlet pressures were set to 1 bar gauge for both 269
anode and cathode sides. The flow rates for humidified H2 and O2 270
were ca 50–70 sccm downstream of the fuel cell. Polarization curves 271
were recorded by scanning the cell voltage at 0.5 mV· s−1. 272
Results and Discussion 273
Structural characterisation of pristine catalysts.— The X-ray 274
diffractograms for the pristine Fe-N-C, Co-N-C and Cr-N-C cata- 275
lysts are shown in Figure2. While the Fe-N-C and Co-N-C catalysts 276
only show two diffraction peaks that are assigned to the 002 and 101 277
reflections of graphite, the Cr-N-C catalyst shows additional intense 278
peaks that are assigned to the CrN structure. In addition, secondary 279
peaks visible in the diffraction pattern of Cr-N-C are assigned to the 280
Cr2N structure and to a chromium carbonitride structure. The major 281
presence of CrN over Cr2N was expected after pyrolysis in the N- 282
rich atmosphere, NH3.42The superimposition of the broad peaks at 283
23–25◦that is assigned to graphite highlights a similar low degree of 284
graphitization. This is understandable since the metallic cobalt and 285
iron crystalline structures known to catalyze graphitisation are not 286
detected by XRD in the pristine Fe-N-C and Co-N-C catalysts while 287
chromium nitrides do not catalyze graphitization.29,43–44
288
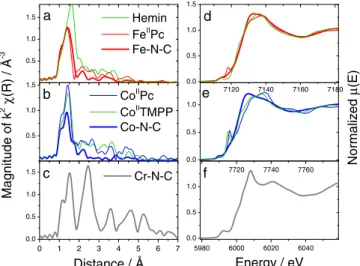
The Fourier-transforms of the extended X-ray absorption fine 289
structure (EXAFS) spectra of the Fe-N-C and Co-N-C catalysts are 290
shown in Fig. 3a–3b (thick solid lines), while the corresponding 291
X-ray absorption near edge structure (XANES) spectra are shown 292
in Fig.3d–3e. The radial distribution function of Fe-N-C shows a first 293
peak at 1.3–1.5 Å arising from Fe-N interactions and a second peak 294
at 2.2 Å mostly assigned to backscattering from carbon atoms. Both 295
the EXAFS and XANES spectra for pristine Fe-N-C resemble those 296
of Fe(II) phthalocyanine (FeIIPc) (thin red line in Figs.3aand3d). 297
The main difference is the absence of a pre-edge peak at 7117 eV 298
in the XANES spectrum of Fe-N-C, while it is present in the spec- 299
trum of FeIIPc. The absence of the pre-edge feature in Fe-N-C can 300
be explained on the basis that the square-planar D4hlocal symmetry 301
is broken down in the Fe-N-C catalyst due to the additional coordi- 302
nation of dioxygen along the axial direction.45The pre-edge feature
303
at 7117 eV is indeed observed for square-planar FeIIN
4 compounds 304
but disappears for a square-pyramid coordination resulting from the 305
coordination by a fifth ligand.17,46Such is the case for Hemin, a
chloro-306
Fe(III)-porphyrin compound (green line in Fig.3d). Thus, the XANES 307
and EXAFS data for Fe-N-C show that i) the active-site structure in 308
Fe-N-C is similar to that in FeIIPc and ii) no or almost no Fe-Fe 309
bonds exist in that catalyst. Similarly, the EXAFS data for Co-N-C 310
suggest that only few Co-Co bonds are present in the pristine cata- 311
lyst due to the small signal at 2.3–2.5 and 4–5 Å corresponding to 312
10 20 30 40 50 60 70 80 90 100 Fe-N-C Co-N-C Cr-N-C Graphite CrN Cr2N Cr3C1.52N0.48
Counts / a.u.
2θ angle / °
Figure 2. X-ray diffractograms of the pristine Fe-N-C, Co-N-C and Cr-N-C catalysts and reference X-ray diffraction lines for graphite (JCPDS file 75-1621), CrN (JCPDS file 11-0065), Cr2N (JCPDS file 01-1232) and
A
uthor
Pr
oof
0.5 1.0 1.5 7120 7140 7160 7180 0.0 0.5 1.0 1.5 0.5 1.0 1.5 7700 7720 7740 7760 0.0 0.5 1.0 0 1 2 3 4 5 6 7 0.0 0.5 1.0 1.5 5980 6000 6020 6040 0.0 0.5 1.0 e d c b Hemin FeIIPc Fe-N-C a f Normalized μ (E) CoIIPc CoIITMPP Co-N-C Magnitude of k 2 χ (R) / Å -3 Cr-N-C Distance / Å Energy / eVFigure 3. Left handside: Magnitude of the k2-weighed Fourier transform of
the EXAFS signal for the pristine Fe-N-C, Co-N-C and Cr-N-C catalysts and for reference compounds. The radial distance is not corrected for phase shift. Right handside: the corresponding normalized XANES spectra, at energies between−10 and +70 eV around the corresponding Metal K-edge.
Co-Co bond distances in metallic cobalt (thick blue line in Fig.3b).
313
On the basis of the relative intensity of the Fourier transform at 1.4 Å
314
(Co-N interactions) for the present Co-N-C catalyst compared to that
315
of a Co-based catalyst free of metallic cobalt particles (lower cobalt
316
content), it was estimated that ca 79–83% of the cobalt atoms in the
317
present Co-N-C catalyst are involved in CoNxCymoieties. Similar to 318
the case for iron, the pre-edge feature is observed for the square-planar
319
CoIIN
4compounds CoIIPc and Co(II)-tetramethoxyphenylporphyrin 320
(CoIITMPP) but not observed for Co-N-C (Fig.3e). The active site 321
structure in Co-N-C is also different from that in CoIIPc or CoIITMPP 322
as revealed by the lower intensity of its Fourier transform at 1.4 Å,
323
corresponding to Co-N interactions (Fig.3b). This suggests a lower
324
coordination of cobalt in Co-N-C than in CoN4macrocycles. In con-325
clusion, the restricted amount of metal-based crystalline structures in
326
the pristine Co- and Fe-N-C catalysts is important as it allows an
eas-327
ier tracking with X-ray absorption spectroscopy (XAS) of the fate of
328
the CoNxCyand FeNxCymoieties after H2O2treatment. This aspect 329
had already proved important for post mortem M¨ossbauer analysis of
330
Fe-N-C cathodes.21Last, the Fourier transform function for Cr-N-C
331
shows a long-range ordering up to 6 Å, in agreement with the CrN
332
structure. The first peak at 1.5 Å is assigned to Cr-N interactions with
333
N atoms while the second and third peaks at 2.5 and 3.6 Å are assigned
334
to Cr-Cr interactions.
335
Electrochemical characterization of pristine and degraded 336
catalysts.— Figure4shows the polarization curves measured with
337
RDE for the pristine Fe-N-C, Co-N-C and Cr-N-C catalysts (thick
338
black curves) as well for the three series of catalysts obtained by
339
treating these catalysts with increasing amounts of H2O2. The po-340
larization curves for the pristine Fe- and Co-N-C catalysts show a
341
gradual\transition from a kinetic control to a diffusion control
ex-342
tending over 150 mV. This is typical for catalytic films with poor
343
diffusion properties. These experimental curves are similar in shape
344
to those calculated for films including an O2 concentration gradient 345
at high current density.47This does however not impede the reading
346
of the ORR activity at high potential where the current density is
347
low. For both Fe- and Co-N-C, the ORR activity at 0.8 V vs. RHE
348
gradually decreases with increasing amounts of H2O2used during the 349
treatment, while the diffusion-limited current density is practically
350
unmodified. This suggests that the ORR mechanism was unchanged
351
while the number of FeNxCyand CoNxCyactive sites on the surface 352
gradually decreased. The general trend of decreasing ORR activity
353
with increased amount of H2O2used in the treatment is however more 354 -4 -3 -2 -1 0 -4 -3 -2 -1 0 0.3 0.4 0.5 0.6 0.7 0.8 0.9 -4 -3 -2 -1 0
Current density / mA cm
-2c
b
0 5 10-4 10-3 2 10-3 5 10-3 10-2 2 10-2a
Potential / V vs. RHE
Figure 4. Polarization curves measured with RDE for a) Fe-N-C, b) Co-N-C and c) Co-N-Cr-N-Co-N-C pristine catalysts and after ex situ treatment with various amounts of H2O2. The legend indicates the number of moles H2O2per mg of
catalyst used for treating Me-N-C catalysts.
complex at low peroxide amounts. For Fe-N-C, the ORR activities 355
after treatment with 5· 10−4 and 10−3 mol H2O2 per mg of catalyst 356
are identical, suggesting that the degradation stalled. For Co-N-C, the 357
ORR activity first decreased after treatment with 5· 10−4 mol H2O2 358
per mg of catalyst, but rose back to the activity of pristine Co-N-C 359
after treatment with 10−3 mol H2O2 mg−1. For higher amounts of 360
H2O2, the ORR activity then decreased gradually for both Fe- and 361
Co-N-C. The H2O2 treatment seems to result in the superimposition 362
of a minor positive effect at low H2O2amount and of a major negative 363
effect at high H2O2amount. Following a restricted surface oxidation 364
with H2O2, the top surface of Co- or Fe-N-C might have been cleaned, 365
thereby exposing to the electrolyte some active sites that were pre- 366
viously buried under a thin carbon layer. Alternatively, the grafting 367
of oxygen groups on the surface might have positively affected the 368
ORR turnover of the active sites via electronic effects.48 Next, the
369
pattern for Cr-N-C is different. The polarization curve of the pristine 370
catalyst is steeper in the kinetic region. The diffusion-limited current 371
density is also better defined. The decrease of the ORR activity after 372
H2O2 treatment is much larger than that observed for Fe- and Co- 373
N-C. This suggests that the nature of the active sites is completely 374
different, which is corroborated by XRD, XANES and EXAFS char- 375
acterisations (Figs.2–3). As will be seen later, the chromium nitride 376
structures resist the peroxide treatment, but they are ORR inactive. 377
The ORR activity of pristine Cr-N-C is assigned to highly basic N- 378
groups that are formed during pyrolysis in NH3. The assignment is 379
based on the poor ORR activity of a Cr-based sample pyrolyzed in Ar 380
and also on the high activity of a metal-free N-C sample pyrolyzed in 381
NH3(not shown). Regarding the diffusion-limited current density, the 382
pattern is also very different from that observed for Fe- and Co-N-C. 383
The ORR mechanism seems to gradually shift from a four-electron 384
to a two-electron reduction mechanism (Fig.4c). This is understand- 385
able if the top-surface N-groups present in pristine Cr-N-C were re- 386
A
uthor
Pr
oof
0.80 0.85 0.90 0.75 0.80 0.85 0.1 1 10 0.65 0.70 0.75 0.80c
b
a
Potential / V vs. RHE
0 5x10⁻⁴ 10-3 2x10⁻³ 5x10⁻³ 10-2 2x10⁻²Mass activity / A g
-1Figure 5. Tafel plots derived from RDE polarization curves for a) Fe-N-C, b) Co-N-C and c) Cr-N-C catalysts initially and after ex situ treatment with various amounts of H2O2. The legend indicates the number of moles H2O2
per mg of catalyst used to treat Me-N-C catalysts.
modified. The low ORR activity remaining after extensive
degrada-388
tion with H2O2 possibly comes from less active N-groups or from 389
oxygen groups that formed during the peroxide treatment. In order to
390
quantify the ORR activity, the polarization curves were corrected for
391
diffusion limitation with the Koutecky-Levich equation and
normal-392
ized per mass of catalyst. Figure5shows the Tafel plots corresponding
393
to Figure4. Within a given catalyst series, the Tafel slopes remained
394
constant with H2O2treatment, except for pristine Fe-N-C for which 395
the Tafel slope is slightly higher than that for treated catalysts (77
396
vs. 62–65 mV dec−1). The ORR activity after treatment with 10−2
397
mol H2O2mg−1was divided by 6.6 for Fe-N-C, 2.9 for Co-N-C and 398
1400 for Cr-N-C (Fig.5). The activity was read at 0.8 V vs. RHE
399
for Fe- and Co-N-C, and at 0.75 V vs. RHE for Cr-N-C. Thus, the
400
ORR activity decay following H2O2 treatment strongly depends on 401
the nature of the metal in Me-N-C catalysts. This in turn strongly
sug-402
gests that the oxidizing species degrading the catalysts is not H2O2 403
but rather the ROS generated via a Fenton reaction between transition
404
metal atoms and H2O2. Direct evidence for the formation of ROS is 405
reported in Collection yield and radical oxygen species after ex situ
406
H2O2treatment section. 407
The ORR mechanism on pristine catalysts was then investigated
408
with a rotating ring disk electrode (RRDE). Measured at a loading
409
of 0.8 mg cm−2, the % H2O2detected at the ring is shown in Fig.6a 410
and the polarization curves measured at the disk are shown in Fig.6b.
411
The % H2O2is far lower for ORR when catalyzed by Fe-N-C than 412
catalyzed by Co-N-C and Cr-N-C. The curves of % H2O2vs. potential 413
for Fe-N-C and Co-N-C have a similar shape, but Co-N-C produces ca
414
20 times more H2O2at any given potential. For Cr-N-C, the % H2O2is 415
quite high and almost independent of potential. In order to investigate
416
whether the low % H2O2 measured on Fe-N-C indicates a true four 417
electron reduction mechanism, a 2+ 2 electron mechanism or a
418 0.2 0.3 0.4 0.5 0.6 0.7 0.8 -5 -4 -3 -2 -1 0 0.2 0.3 0.4 0.5 0.6 0.7 0.8 0.9 0.1 1 10 Curre nt d ensity / mA.cm -2
Potential / V vs. RHE Potential / V vs. RHE
d
Fe-N-C 0.1 mg cm-2 Fe-N-C 0.4 mg cm-2 Fe-N-C 0.8 mg cm-2c
b
Cr-N-C Co-N-C Fe-N-C % H 2 O2a
Figure 6. Rotating ring disk electrode measurements for Fe-N-C, Co-N-C and Cr-N-C (left handside) at a fixed loading of 0.8 mg cm−2and rotating ring disk electrode measurements for Fe-N-C at different loading (right hand-side). In c and d, the loading at the disk was 0.8 mg cm−2(thick solid line), 0.4 mg cm−2(thin solid line) or 0.1 mg cm−2(dashed line).
two-electron mechanism followed by chemical disproportionation, 419
lower Fe-N-C loadings were investigated (Fig. 6c–6d).49 At lower 420
loadings, the diffusion-limited current density was drastically reduced 421
(Fig.6d), due to incomplete coverage of the disk, or due to a low 422
density of active sites per geometric area of the disk. This drastic de- 423
crease does not reflect the small change in % H2O2that is detected at 424
the ring. The % H2O2increased with decreased loading, but remained 425
in the range 3.3–4.5% at potentials of 0.2–0.6 V vs. RHE even at 426
0.1 mgFe-N-C cm−2 (dashed curve in Fig.6d). This shows that ORR 427
on Fe-N-C proceeds mostly according to a direct four electron 428
mechanism. The minute amount of H2O2 formed on the catalyst 429
surface may however have formed ROS through a chemical reaction 430
on FeNxCymoieties. 431
While the RDE and RRDE techniques are useful for investigating 432
the ORR activity and ORR mechanism, they do not allow predicting 433
the behavior of Me-N-C cathodes at high current density in PEMFC. 434
We selected the pristine catalysts and catalysts treated with 2· 10−3 435
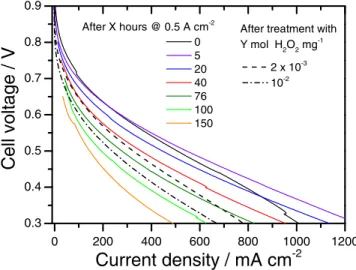
and 10−2mol H2O2mg−1for beginning-of-life (BoL) PEMFC tests. 436
Figure7shows PEMFC polarization curves recorded with 4 mg cm−2 437
of Me-N-C catalyst at the cathode. Analyzing the extent of degrada- 438
tion after ex situ H2O2 treatment should a priori be carried out by 439
comparing the BoL polarisation curve of H2O2-treated catalysts to 440
the BoL polarization curves of the corresponding pristine catalysts. 441
However, for the pristine Fe- and Co-N-C catalysts, this simple ap- 442
proach is impeded by the fact that the BoL polarization curve does 443
not correspond to the best performance of the pristine catalysts. For 444
pristine Fe-N-C, the polarization curve continuously improves during 445
the first 6 h of operation, and the same occurs for pristine Co-N-C 446
during the first 15 h of operation. The improvement is most visible 447
in the high current density region, while the ORR activity at high 448
potential slightly decreases during this break-in period (Fig.7a–7b). 449
The break-in phenomenon is assigned to changes in the hydrophilic 450
properties of the catalytic surface that had never been in contact with 451
water previously. This break-in period is neither observed for pristine 452
Cr-N-C nor for any H2O2-treated catalyst. When the high current den- 453
sity region is considered, the reference curves for the pristine Fe-N-C 454
and Co-N-C catalysts will therefore be the polarisation curves after 455
break-in (dotted black lines in Fig.7a–7b). When the ORR activity 456
at 0.8 V is considered, the reference curves for the pristine Fe-N- 457
C and Co-N-C catalysts will be the BoL polarization curves (solid 458
black lines in Fig.7a–7b). The current densities measured at 0.8 and 459
0.5 V in fuel cell as extracted from Fig.7for pristine and H2O2-treated 460
A
uthor
Pr
oof
0.3 0.4 0.5 0.6 0.7 0.8 0.9 0.3 0.4 0.5 0.6 0.7 0.8 0 200 400 600 800 1000 1200 1400 0.3 0.4 0.5 0.6 0.7 0.8 1 10 0.7 0.8 1 10 0.8 0.9 1 10 0.7 0.8c
b
a
BoL Break-in 2.10-3 10-2Cel
l vol
tage /
V
...
Current density / mA cm
-2Figure 7. Effect of ex situ H2O2treatment on the fuel cell polarization curves
of MEAs with cathodes comprising a) Fe-N-C, b) Co-N-C and c) Cr-N-C catalysts. The insets show the high-potential region of the polarization curves in semi-logarithmic plot. The break–in involved potentiostatic control at 0.5 V for 6 h (pristine Fe-N-C) or 15 h (pristine Co-N-C).
As previously observed with RDE, the degradation of the cathode
462
performance after treating the catalysts with 10−2mol H2O2mg−1is 463
most severe for Cr-N-C, followed by Fe-N-C and then Co-N-C. After
464
a treatment with 10−2mol H2O2mg−1, the ORR activity measured in 465
PEMFC at 0.8 V was divided by ca 45 for Cr-N-C, by 9 for Fe-N-C
466
and by 3 for Co-N-C (Fig.8b). These numbers are comparable to those
467
measured with RDE, except for Cr-N-C for which the decay in fuel
468
cell is much smaller than the one measured in RDE (Fig.5cand7c). At
469
0.5 V, the decrease in current density from the BoL polarization curve
470
(Cr-N-C), or from the polarisation curve after break-in (for Co- and
471
Fe-N-C) to the BoL polarisation curve measured for catalysts treated
472
with 10−2mol H2O2mg−1is highest for Cr-N-C (decrease from 606 473
to 85 mA cm−2), followed by Fe-N-C (470 to 238 mA cm−2) and
474
smallest for Co-N-C (366 to 240 mA cm−2). Noteworthy, the ORR
475
activity at 0.8 V is almost identical for the pristine Co-N-C catalyst
476
after break-in and for the Co-N-C catalyst after treatment with 10−2
477
mol H2O2mg−1(Fig.8b). In spite of this, a large difference is observed 478
in the current density at 0.5 V (Fig.8a). Thus, for Co-N-C, the loss of
479
performance at high current density induced by the peroxide treatment
480
is mostly due to decreased transport properties of the cathode layer.
481
The story is different for Fe-N-C and Cr-N-C. The Fe-N-C catalyst
482
shows a stronger decay of its ORR activity after peroxide treatment
483
(Fig.8b) but the transport properties of the cathode layer are also
484
negatively impacted by the ex situ peroxide treatment of the catalyst,
485
as can be deduced from the steeper slope of the polarization curve
486
at high current density (Fig.7a). The Cr-N-C based cathode shows a
487 0 100 200 300 400 500 600
b
Current density / mA cm -2 10-2 2x10⁻³ BoL After break-ina
0.01 0.1 1 10 Fe-N-C Co-N-C Cr-N-CFigure 8. Current density measured in PEMFC at 0.5 V (a) and 0.8 V (b) for the pristine catalysts at BoL or after break-in, and for the catalysts after treatment with 2·10−3or 10−2mol H2O2mg−1. The break–in involved
poten-tiostatic control at 0.5 V for 6 h (pristine Fe-N-C) or 15 h (pristine Co-N-C). No break-in was applied to Cr-N-C. The activity of Cr-N-C at 0.8 V after 10−2 mol H2O2mg−1needed an extrapolation.
dramatic decrease of both its ORR activity and transport properties 488
due to the H2O2ex situ treatment of the Cr-N-C catalyst (Fig.8, gray 489
columns). 490
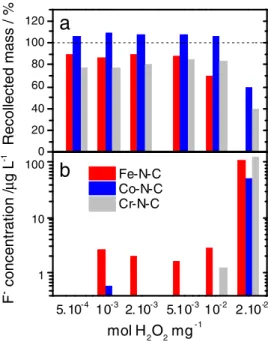
Collection yield and radical oxygen species after ex situ H2O2 491 treatment.— The weight percentage of catalyst powder collected af- 492
ter each H2O2treatment is reported in Fig.9a. After a treatment with 493
5·10−4to 5·10−3mol H2O2mg−1, the collection yields are 87–90% 494
for Fe-N-C (red bars) and 77–85% for Cr-N-C (gray bars). Collection 495
yields lower than 100% can be due to i) handling loss, ii) chemical 496
loss due to the oxidative attack by peroxide and ii) filtration loss. The 497
latter occurs if, at the end of the treatment, some catalytic particles 498
are smaller than the pore size of the filter used to separate the treated 499
0 20 40 60 80 100 120 Recollected mass / %
a
1 10 100 Fe-N-C Co-N-C Cr-N-Cb
5. 10-4 10-3 2. 10-3 5.10-3 2.10-2 F - concentration / μ g L -1 mol H2O2 mg -1 10-2Figure 9. Extent of the H2O2ex situ degradation assessed a) with the relative
mass of catalyst recollected after each H2O2treatment+ filtration + drying,
or b) with the concentration in the filtrate of fluoride ions released by a Nafion membrane.
A
uthor
Pr
oof
catalyst from the solution. The non-collected mass of catalyst for the
500
treated Fe-N-C and Cr-N-C samples is mostly assigned to chemical
501
and filtration losses. The loss due to material’s handling is believed to
502
be negligible since for Co-N-C samples handled similarly, a weight
503
gain was observed after treatment up to 10−2mol H2O2mg−1(blue 504
bars in Fig.9a). This weight gain is assigned to the grafting of oxygen
505
functionalities on the surface of Co-N-C, without any loss of carbon
506
atoms from Co-N-C. This explanation is supported by XPS
elemen-507
tal analysis (III.6). The lower collection yields for Cr-N-C samples
508
than for Fe-N-C samples is assigned to the higher porosity and higher
509
specific area of the pristine Cr-N-C catalyst due to the ammonia gas
510
used during pyrolysis. A significant decrease of the collection yield
511
is observed at and above 10−2mol H2O2mg−1. After treatment with 512
2· 10−2 mol H2O2 mg−1, only 60 and 40% of the initial Co-N-C 513
and Cr-N-C mass was collected whereas no Fe-N-C catalyst could
514
be collected on the filter. A large fraction of the missing mass of
515
catalyst is suspected to have passed through the 220 nm sized pores
516
of the filter as a consequence of finer powders following the H2O2 517
treatment. This hypothesis is supported by the greyish color of the
518
filtrates after treatment with large amounts of peroxide. The lower
519
granulometry of the powders after extended treatment with
perox-520
ide may explain the poorer transport properties of fuel cell cathodes
521
(Fig.7). The cathode macroporosity may have decreased due to a
522
lower 3D branching character and lower inter-particle connections for
523
H2O2-treated catalysts. In conclusion, after treatment with 10−2 mol 524
H2O2mg−1, the extent of catalyst modification clearly depends on the 525
nature of the transition metal in Me-N-C catalysts, in the order Fe> Cr
526
> Co. This, in turn, might be related to the production of ROS ensuing 527
from the reaction between H2O2and metal species. The production 528
of ROS during the peroxide treatment was quantified with the
con-529
centration of fluoride ions measured in the filtrate at the end of each
530
treatment. These fluoride ions originate from the simultaneous attack
531
by ROS of the Nafion membrane immersed in the solution during the
532
entire process. While the fluoride concentration remained low after
533
treatment up to 5.10−3mol H2O2mg−1, it dramatically increased by 534
ca two orders of magnitude for all three catalysts after a treatment with
535
2· 10−2mol H2O2mg−1(Fig.9b). A correlation is observed between 536
a high collection yield and a low concentration of fluoride, suggesting
537
that Co-N-C produces less ROS than Fe-N-C when it is contacted
538
by H2O2. This explains the restricted decrease of the electrochemical 539
performance of Co-N-C after H2O2treatment. 540
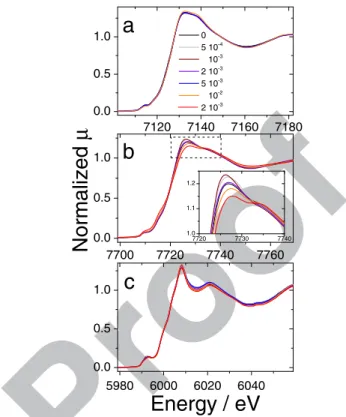
X-ray absorption spectroscopy on pristine and degraded 541
catalysts.— The XANES spectra for the three series of H2O2treated 542
catalysts are shown in Fig.10. For Fe-N-C, there is practically no
543
change of the XANES spectra from the pristine Fe-N-C catalyst up to
544
the highly degraded catalyst after treatment with 10−2mol H2O2mg−1 545
(Fig.10a). Also the Fourier-transforms of the EXAFS spectra of the
546
Fe-N-C samples did not reveal any changes and were identical to that
547
of pristine Fe-N-C shown in Fig.3a. The XANES and EXAFS
spec-548
tra of the Fe-based series therefore demonstrate that the coordination
549
chemistry of the Fe atoms that remained in the samples after H2O2 550
treatment is identical to the one before treatment. It is paramount to
551
realize that this observation does not preclude the possibility that the
552
FeNxCymoieties located on the top-surface in pristine Fe-N-C were 553
partially or fully removed during H2O2treatment. If similar FeNxCy 554
moieties are present both on the top surface and in the bulk of pristine
555
Fe-N-C, the normalized XANES and EXAFS spectra will remain
un-556
changed even after the complete removal of top surface sites due to
557
the bulk-averaging nature of XANES and EXAFS. Hence, identical
558
spectra before and after H2O2treatment is not paradoxical with the 559
decreased ORR activity before and after H2O2treatment. It strongly 560
suggests, however, that only a fraction of the FeNxCymoieties existing 561
in pristine Fe-N-C were located on the top surface. Only the latter may
562
contribute to the ORR activity. For the series of H2O2-treated samples 563
derived from pristine Co-N-C, the XANES spectra changed
notice-564
ably with H2O2 treatment (Fig.10b). The inset in Fig.10bshows 565
the initial increase of the white line intensity at ca 7726 eV after
566
treatment with 5· 10−4and 10−3mol H2O2mg−1, followed by a con-567 7120 7140 7160 7180 0.0 0.5 1.0 7700 7720 7740 7760 0.0 0.5 1.0 5980 6000 6020 6040 0.0 0.5 1.0 7720 7730 7740 1.0 1.1 1.2
c
b
0 5 10-4 10-3 2 10-3 5 10-3 10-2 2 10-3Normalized
μ
a
Energy / eV
Figure 10. Normalized XANES spectra for pristine and H2O2treated
cata-lysts. a) Fe-N-C, b) Co-N-C, c) Cr-N-C. The spectra are shown in the energy range−10 to +70 eV around the corresponding Metal K-edge.
tinuous decrease from 10−3to 2·10−2mol H2O2mg−1. Noteworthy, 568
after treatment with 10−3mol H2O2mg−1, the ORR activity measured 569
in RDE increased back to the ORR activity of pristine Co-N-C, and 570
these two observations might be interrelated. The two XANES spectra 571
corresponding to treatments with 10−2and 2·10−2mol H2O2mg−1are 572
significantly different at 7726 eV and are also negatively shifted by 573
1.5–2.5 eV at the beginning of the absorption edge (7715 eV). This in- 574
dicates a decreased average oxidation state of cobalt. This observation 575
is further supported by the Fourier-transforms of the EXAFS signal, 576
showing an increased peak at ca 2.2, 3.8 and 4.5 Å (Fig.11). These 577
distances (not corrected for phase shift) correspond to back-scattering 578
from cobalt atoms in metallic cobalt. Extensive treatment with H2O2 579
probably resulted in the etching of a significant fraction of the CoNxCy 580
moieties present in pristine Co-N-C, thereby increasing the fraction of 581
0 1 2 3 4 5 6 7 0.0 0.5 1.0
Distance / Å
0 5 10-4 10-3 2 10-3 5 10-3 10-2 2 10-2Magnitude of k
2χ
(R) / Å
-3 mol H2O2 mg-1 increased H2O2Figure 11. Magnitude of the k2-weighed Fourier transform of the EXAFS
signal for pristine Co-N-C and for H2O2treated Co-N-C. The radial distance
A
uthor
Pr
oof
0.000 0.005 0.010 0.015 0.020 0 2 4 6 8 10Bulk metal content / wt %
moles H
2O
2per mg catalyst
Cr-N-C
Co-N-C
Fe-N-C
Figure 12. Bulk metal content as a function of the ratio of mol H2O2per mass
catalyst used for ex situ degradation.
metallic cobalt in the treated Co-N-C samples. Pristine Co-N-C seems
582
to contain a small fraction of metallic cobalt (Fig.11), although it was
583
not detected by XRD (Fig.2). The better resistance of metallic cobalt
584
particles to the peroxide treatment is normal since such particles are
585
usually surrounded by a continuous layer of graphitic carbon after
586
pyrolysis. Next, the XANES spectra for the pristine and treated
Cr-N-587
C catalysts show little change with H2O2treatments (Fig.10c). This 588
agrees with the known stability of chromium nitride structures.
589
In addition to providing knowledge on the oxidation state and
co-590
ordination chemistry of transition metals, XAS allows quantifying the
591
bulk metal content from the absolute height of the absorption step
592
combined with the exact mass of each pellet used for measurements
593
in transmission mode. Figure12shows the bulk content of Fe, Co and
594
Cr determined from XAS as a function of the number of mol H2O2 595
used to treat the catalysts. The bulk contents of Fe and Co decreased
596
with increasing amounts of H2O2. However, the loss is moderate. Af-597
ter a treatment with 10−2 mol H2O2 mg−1, the relative decrease of 598
Fe and Co content was only 17 and 27%, respectively. For Cr-N-C,
599
the bulk metal content even increased by 18%, highlighting the better
600
resistance to the peroxide treatment of CrN particles than the N-doped
601
carbon matrix. Dodelet’s group also reported in 2003 a relative loss
602
of Fe of only 30–40% after H2O2treatment. In parallel, the half-wave 603
potential for ORR in RDE decreased by 150–200 mV, corresponding
604
to ca two-order-of-magnitude decrease in ORR activity.25For another
605
Fe-N-C catalyst, Zelenay’s group observed a decrease of Fe content
606
from 0.9 to 0.6 at. % (33% relative los) after H2O2 treatment for 607
72 h, which was accompanied by a 150 mV downshift of the
half-608
wave potential for ORR when measured in RDE.26A XANES analysis
609
with linear combination fitting of reference spectra identified that only
610
20–25% of the iron atoms in their pristine catalyst were involved in a
611
FeIIPc-like coordination, the remainder being iron sulfide, iron oxide 612
and metallic iron structures. This complicated the identification of a
613
correlation, or lack of correlation, between the decrease in bulk
con-614
tent of FeNxCymoieties during H2O2treatment and the decrease of 615
ORR activity. Here in contrast, ca 80 and 90% of the metal atoms in the
616
pristine Co-N-C and Fe-N-C catalysts are assigned to MeNxCy moi-617
eties, respectively (see Structural characterisation of pristine catalysts
618
section and57Fe M¨ossbauer spectroscopy on pristine and degraded 619
Fe-N-C catalysts section). The relative loss of only 27 and 17% of
620
Co and Fe compared to the ORR activity loss measured in RDE after
621
a treatment with 10−2 mol H2O2 mg−1(activity divided by a factor 622
6.6 for Fe-N-C and 2.9 for Co-N-C) suggests that only a fraction of
623
the Fe and Co atoms in the pristine catalysts are located on the top
624
surface and participate in the ORR. Alternatively, if a major fraction
625
of MeNxCymoieties is located on the top surface initially, the results 626
suggest that surface oxidation due to H2O2 drastically reduced the 627
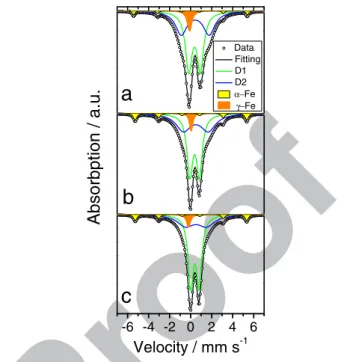
turnover frequency for ORR of the remaining MeNxCy moieties. In 628 -6 -4 -2 0 2 4 6
c
b
a
Absorbption / a.u.
Data Fitting D1 D2 α−Fe γ−FeVelocity / mm s
-1Figure 13. M¨ossbauer absorption spectra measured for pristine Fe-N-C and after ex situ treatment with H2O2. a) pristine, b) after 2· 10−3mol H2O2mg−1,
c) after 10−2mol H2O2mg−1.
this second hypothesis, the fact that little or no modification of the 629
XANES spectra is observed after H2O2treatment, especially for Fe- 630
N-C, suggests that the oxidation would have mostly occurred on the 631
N-doped carbon matrix. Preferential oxidation at the edge of graphene 632
sheets could have modified the electronic properties. The latter might 633
in turn have modified the access of electrons to the MeNxCymoieties. 634
The latter are believed to be covalently integrated near the edge, or at 635
the edge, of graphene sheets.48,50–55Decreased electronic properties 636
and conductivity at the edge would have profound implications in 637
particular for MeNxCymoieties located in micropores.56,57 638
57Fe M¨ossbauer spectroscopy on pristine and degraded Fe-N-C
639 catalysts.— M¨ossbauer spectroscopy is a powerful technique to iden- 640
tify the presence of different iron coordinations in multiphase mate- 641
rials. It is therefore ideally suited to be used alone or in combina- 642
tion with XAS.58–60With EXAFS, the secondary peak observed at ca
643
2.1–2.3 Å in the Fourier-transform may be assigned to backscatter- 644
ing from either carbon atoms in the second coordination sphere of 645
FeNxCymoieties, or from iron atoms in the first or second coordina- 646
tion sphere of metallic iron or iron carbide (Fig.3a). The detection 647
of a minor fraction of iron atoms involved in Fe-based crystalline 648
structures is therefore difficult with EXAFS. Figure13shows the57Fe 649
M¨ossbauer spectra for pristine Fe-N-C and for samples obtained after 650
its treatment with 2· 10−3and 10−2mol H2O2mg−1. The M¨ossbauer 651
spectrum of pristine Fe-N-C shows that the major components are the 652
doublets D1 and D2 (Fig.13a). They have previously been assigned 653
to a square-planar FeIIN
4coordination with FeIIin low and medium 654
spin, respectively.58–61Doublets D1 has M¨ossbauer parameters
sim-655
ilar to those of unpyrolyzed FeIIPc adsorbed on carbon, while D2 656
has parameters similar to those of crystalline FeIIPc in which stacked 657
molecules interact with each other (TableI).62A sextet and a singlet
658
component are also detected and unambiguously assigned toα-Fe and 659
γ-Fe, respectively (Fig.13a).63The spectral areas of these two
com-660
ponents represent only 10% (TableI), demonstrating that the major 661
fraction of iron atoms in pristine Fe-N-C is engaged in molecular-like 662
FeNxCymoieties. Figures13band13cshow the spectra after perox- 663
ide treatment with 2· 10−3and 10−2mol H2O2mg−1, respectively. No 664
major changes are observed. With increasing amount of H2O2, a trend 665
of increased relative fraction of D1 and decreased relative fraction 666
A
uthor
Pr
oof
Table I. M¨ossbauer parameters derived from the fitting with four components of the spectrum for pristine Fe-N-C and for Fe-N-C after ex situ treatment with 2· 10−3and 10−2mol H2O2mg−1. The hyperfine field of the sextet was 33.6, 33.0 and 32.9 T for pristine Fe-N-C, 2·10−3and 10-2
treated Fe-N-C samples, respectively.
Relative Area/% Isomer Shift/mm s−1 Quadrupole Splitting/mm s−1
Pristine 2· 10−3 10−2 Pristine 2· 10−3 10−2 Pristine 2· 10−3 10−2 Assignment D1 53± 5 51± 2 59± 3 0.38± 0.01 0.38± 0.00 0.40± 0.00 1.10± 0.02 0.90± 0.01 0.80± 0.01 FeIIN
4/C, LS
D2 38± 3 37± 2 29± 2 0.43± 0.02 0.49± 0.01 0.51± 0.02 2.65± 0.08 2.36± 0.06 2.01± 0.13 FeIIN 4/C, MS
Sextet 3± 1 7± 0 7± 0 −0.02 ± 0.03 0.03± 0.01 0.04± 0.01 – – – α-Fe Singlet 6± 1 4± 0 4± 0 −0.10 fixed 0.05± 0.01 −0.20 ± 0.01 – – – γ-Fe
andγ-Fe increases only from 9 to 11%. Such metallic particles are
668
embedded in a graphitic shell and resist oxidative attacks, as
previ-669
ously shown in a high-voltage degradation study of the same catalyst.21
670
If a large amount of FeNxCymoieties had been removed from the cata-671
lyst during H2O2treatment, the relative fraction ofα-Fe and γ-Fe after 672
treatment would have dramatically increased. The fact that it only
in-673
creased from 9 to 11% (+22% relative increase) confirms that most of
674
the FeNxCymoieties existing in pristine Fe-N-C are still present after 675
treatment with 10−2mol H2O2mg−1. This agrees with the moderate 676
decrease in bulk Fe content, only 17% relative decrease after
treat-677
ment with 10−2mol H2O2mg−1(Fig.12). Due to the trends of relative 678
area of D1 and D2, it can be concluded that the peroxide treatment
679
preferentially removed FeNxCymoieties assigned to D2. The relative 680
loss of 17% Fe after treatment with 10−2mol H2O2mg−1can however 681
not entirely be assigned to the removal of D2 sites. If this were true,
682
the decrease in the relative area of D2 would have been
commensu-683
rate with that number. However, it only decreased from 38 to 29%
684
(Table I). Hence, the H2O2 treatment etched a minor fraction of 685
both the D2 and D1 sites that were initially present in pristine
Fe-686
N-C. These fractions can be estimated mathematically. If one
con-687
siders 100 Fe atoms in pristine Fe-N-C, then 53 Fe atoms are in D1
688
sites, 38 atoms in D2 sites and the remainder in metallic structures
689
(TableI). The H2O2treatment with 10−2mol H2O2mg−1removed 17 690
out of those 100 atoms (17% loss). After trial-and-error calculations,
691
it is found that when, among those 17 Fe atoms, 4 come from D1
692
sites, 13 from D2 sites and none from the metallic structures, then
693
the final relative % of D1 and D2 in the H2O2 treated sample are 694
100× (53-4)/(100-17) = 59%, and 100 × (38-13)/(100-17) = 30%.
695
These percentages match those experimentally observed for D1 and
696
D2 after treatment with 10−2mol H2O2mg−1(TableI, column 4). The 697
decrease in the absolute content of Fe atoms involved in D1 and D2
698
coordinations upon treatment with 10−2mol H2O2mg−1can now be 699
calculated. It is ca 100× 4/53 = 7.5% for D1, and 100 × 13/38 = 34%
700
for D2. This information is more precise than the overall loss of 17%
701
Fe obtained from XAS. Nevertheless, no proportional relationship can
702
be drawn with the decrease in ORR activity for Fe-N-C. After
treat-703
ment with 10−2mol H2O2mg−1, the latter was divided by 6.6 and by 704
9 in RDE and PEMFC measurements, respectively (Electrochemical
705
characterization of pristine and degraded catalysts section).
706
In conclusion, M¨ossbauer spectroscopy reveals that most of the
707
FeNxCy moieties present in pristine Fe-N-C survived the peroxide 708
treatment. The M¨ossbauer parameters of D1 and D2 were only slightly
709
modified, especially for D1. This suggests that the active sites
remain-710
ing in the peroxide-treated catalysts have an electronic structure and
711
coordination chemistry very similar to those in the pristine catalyst.
712
The apparent continuous decrease of the QS values for D1 and D2
713
with increased mol H2O2 mg−1 used for ex situ degradation might 714
be due to electronic effects of the surrounding carbon support, which
715
becomes more oxidized and contains fewer delocalizedπ electrons.
716
Hence, either the ORR activity in pristine Fe-N-C is due to a
mi-717
nor fraction of D1 or D2 sites located on the top surface, or the
718
top surface of the catalyst was highly oxidized during H2O2 treat-719
ment, leading to a loss of surface conductivity or partial exfoliation
720
of the graphene sheets. The latter transformations may be localized
721
around the surface FeNxCy moieties, where H2O2 reacted to form 722
ROS.
723
X-ray photoelectron spectroscopy on pristine and degraded 724 catalysts.— The nitrogen and oxygen content and speciation were in- 725
vestigated with XPS on pristine catalysts as well as on catalysts after 726
treatment with 10−2 mol H2O2mg−1. Figure14shows as an exam- 727
ple the N1snarrow scan spectra for the pristine and degraded Fe-N-C 728
catalyst. Both experimental spectra were fitted with four components 729
(TableII). They are assigned in the order of increasing binding energy 730
(BE) to pyridinic, pyrrolic, graphitic and oxidized nitrogen.64–67The
731
pyridinic component (BE 398.5-398.7), primarily assigned to N atoms 732
contributing with one electron to theπ system, may also comprise N 733
atoms ligating the Fe or Co ions.66–67Next, most pyrrolic N atoms are
734
expected to be located on the graphene edges, and bonded to two C 735
atoms and 1 H atom in six-membered rings. Third, the graphitic N 736
component comprises all N atoms bonded with three C-atoms, either 737
within a graphene sheet or at the edge of a graphene sheet.64,68
738
From Fig.14, it can be seen that no novel N-species arose during 739
the treatment of Fe-N-C with H2O2. This observation holds for Co- 740
N-C and Cr-N-C. The modified shape of the overall N1sspectrum in 741
Fe-N-C after degradation is due to a larger relative fraction of pyrrolic- 742
N. After quantification of the atomic % of C, N and O, it is found that 743
the absolute content of pyrrolic N increased from 1.07 to 1.97 at % 744
during degradation, (TableII). This absolute increase in pyrrolic N 745
is also observed with Co-N-C and Cr-N-C (TableII). In contrast, the 746
absolute content of all other N species in Fe-N-C, Co-N-C or Cr-N-C 747
was unmodified or increased only slightly after H2O2treatment. The 748
exception is the significant decrease of pyridinic N for Cr-N-C after 749
H2O2degradation (ca -1 at %). The changes observed in the nitrogen 750
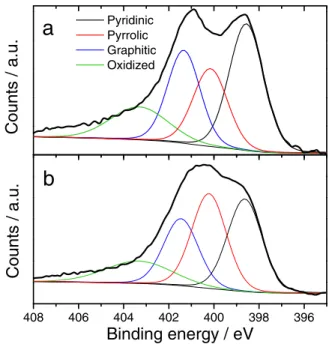
408 406 404 402 400 398 396 Pyridinic Pyrrolic Graphitic Oxidized
b
Counts / a.u.
a
Counts / a.u.
Binding energy / eV
Figure 14. N1snarrow scan spectra measured with XPS for a) the pristine
Fe-N-C catalyst and b) the Fe-Fe-N-C catalyst treated with 10−2mol H2O2mg−1.