HAL Id: inserm-01478367
https://www.hal.inserm.fr/inserm-01478367
Submitted on 20 Apr 2021HAL is a multi-disciplinary open access archive for the deposit and dissemination of sci-entific research documents, whether they are pub-lished or not. The documents may come from teaching and research institutions in France or abroad, or from public or private research centers.
L’archive ouverte pluridisciplinaire HAL, est destinée au dépôt et à la diffusion de documents scientifiques de niveau recherche, publiés ou non, émanant des établissements d’enseignement et de recherche français ou étrangers, des laboratoires publics ou privés.
Lycopene bioavailability is associated with a
combination of genetic variants
Patrick Borel, Charles Desmarchelier, Marion Nowicki, Romain Bott
To cite this version:
Patrick Borel, Charles Desmarchelier, Marion Nowicki, Romain Bott. Lycopene bioavailability is associated with a combination of genetic variants. Free Radical Biology and Medicine, Elsevier, 2015, 83, pp.238 - 244. �10.1016/j.freeradbiomed.2015.02.033�. �inserm-01478367�
1
Lycopene bioavailability is associated with a combination of genetic variants
Patrick Borela,b,c*, Charles Desmarcheliera,b,c**, Marion Nowickia,b,c, Romain Botta,b,c
a
INRA, UMR INRA1260, F-13005, Marseille, France (PB, CD, MN, RB)
b
INSERM, UMR_S 1062, F-13005, Marseille, France (PB, CD, MN, RB)
c
Aix-Marseille Université, NORT, F-13005, Marseille, France (PB, CD, MN, RB)
* To whom correspondence and request for reprints should be addressed:
UMR 1260 INRA/1062 INSERM/Aix-Marseille University
"Nutrition Obesity and Risk of Thrombosis"
Faculté de Médecine
27, boulevard Jean Moulin
13005 Marseille
France
Phone: +33 (0)4 91 29 41 11
Fax: +33 (0)4 91 78 21 01
** C. Desmarchelier is co-first author
Running head: Lycopene bioavailability
Abbreviations: ABCB1 (ATP-binding cassette, sub-family B (MDR/TAP), member 1);
1
AUC (area under the curve); BCO1 (β-carotene 15,15’oxygenase-1); BCO2 (β-carotene 2
2 9,10’-oxygenase-2); CD36 (cluster determinant 36); CM (chylomicron); ELOVL2 (ELOVL 3
fatty acid elongase 2); HPLC (high performance liquid chromatography); ISX (intestine 4
specific homeobox); L-FABP (liver-fatty acid binding protein); LYC (lycopene); MTTP 5
(microsomal triglyceride transfer protein); PLS (partial least squares); SCARB1 (scavenger 6
receptor class B, member 1); SNPs (single nucleotide polymorphisms); SOD2 (superoxide 7
dismutase 2, mitochondrial); SR-BI (scavenger receptor class B type I); VIP (variable 8
importance in the projection). 9
10
This clinical trial is registered at http://www.clinicaltrials.gov/ct2/. The ID number is 11 NCT02100774. 12 13 14 15 16 17 18
Footnote: chylomicron (CM), Lycopene (LYC), single nucleotide polymorphism (SNP),
19
partial least square regression (PLS) 20
3
Abstract
21
Background: The intake of tomatoes and tomato products, which constitute the main dietary
22
source of the red pigment lycopene (LYC), has been associated with a reduced risk of prostate 23
cancer and cardiovascular disease, suggesting a protective role of this carotenoid. However, 24
LYC bioavailability displays high interindividual variability. This variability may lead to 25
varying biological effects following LYC consumption. Objectives: Based on recent results 26
obtained with two other carotenoids, we assumed that this variability was due, at least in part, 27
to several single nucleotide polymorphisms (SNPs) in genes involved in LYC and lipid 28
metabolism. Thus, we aimed at identifying a combination of SNPs significantly associated 29
with the variability in LYC bioavailability. 30
Design: In a postprandial study, 33 healthy male volunteers consumed a test meal containing
31
100 g tomato puree, which provided 9.7 mg all-trans LYC. LYC concentrations were 32
measured in plasma chylomicrons (CM) isolated at regular time intervals over 8 h post-33
prandially. 1885 SNPs in 49 candidate genes, i.e. genes assumed to play a role in LYC 34
bioavailability, were selected. Multivariate statistical analysis (partial least squares regression) 35
was used to identify and validate the combination of SNPs most closely associated with 36
postprandial CM LYC response. 37
Results: The postprandial CM LYC response to the meal was notably variable with a CV of
38
70%. A significant (P=0.037) and validated partial least squares regression model, which 39
included 28 SNPs in 16 genes, explained 72 % of the variance in the postprandial CM LYC 40
response. The postprandial CM LYC response was also positively correlated to fasting plasma 41
LYC concentrations (r=0.37, P<0.05). 42
Conclusions: The ability to respond to LYC is explained, at least partly, by a combination of
43
28 SNPs in 16 genes. Interindividual variability in bioavailability apparently affects the long 44
4 term blood LYC status, which could ultimately modulate the biological response following 45
LYC supplementation. 46
47
Keywords: carotenoid; absorption; single nucleotide polymorphisms; nutrigenetic; genetic
48
polymorphisms 49
5
Introduction
51
Lycopene (LYC) is the red pigment found in tomatoes and tomato products. It is the 52
carotenoid found at the highest levels in the blood of Americans and the second one in the 53
blood of Europeans. Its protective role against the development of prostate cancer and 54
cardiovascular diseases has been suggested [1-6] but the mechanisms involved have yet to be 55
fully elucidated. Indeed, although LYC’s potential as an antioxidant is well characterized in 56
vitro [7], there is evidence that its biological effects could also be mediated by metabolic 57
products of LYC [8-11], a hypothesis supported by the results of recent molecular studies [11-58
14]. 59
LYC digestion begins in the gastrointestinal lumen where digestive enzymes can 60
modulate its bioaccessibility by facilitating its release from the food matrix to micelles [15-61
17]. Micelles then carry LYC to the apical side of the enterocyte. LYC uptake is not only 62
passive, as previously thought, [18] but its transport is also facilitated by two membrane 63
proteins, SR-BI (scavenger receptor class B type I) [19], encoded by SCARB1, and CD36 64
(cluster determinant 36) [20]. Following uptake, it is possible that a portion of LYC may be 65
metabolized. Indeed, enterocytes contain two enzymes with the potential to cleave LYC. The 66
first one, BCO1 (β-carotene 15,15’ oxygenase-1), is a dioxygenase [21] that catalyzes the 67
oxidative cleavage of LYC with an efficiency similar to that of β-carotene [22], and which has 68
been associated with blood LYC status [23]. The second enzyme, BCO2 (β-carotene-9,10’-69
oxygenase), has been previously suggested to be the main LYC-cleaving enzyme [10]. 70
Regardless of possible metabolism, the fraction of parent LYC remaining in the enterocyte is 71
transported within the cell to the site where it is incorporated into chylomicrons (CM). The 72
mechanism of this transport is not known, but proteins involved in intracellular transport of 73
lipids have been suggested to be involved [24]. LYC-containing CM are secreted into the 74
6 lymph, and then enter the bloodstream. LYC is assumed to stay within these lipoproteins and 75
to follow the fate of CM which is ultimately taken up by the hepatocytes [25]. 76
Clinical trials dedicated to the study of LYC bioavailability have reported high 77
interindividual variability in blood and tissue LYC concentration in response to LYC intake 78
[18, 26-30]. Genetic variations between individuals may provide a partial explanation of this 79
phenomenon [31, 32]. Some genetic polymorphisms have been shown to be associated with 80
the variability in fasting blood LYC concentrations [23, 30, 33-36], and yet only one study has 81
attempted to assess the role of genetic polymorphisms involved in the variability in blood 82
LYC concentration following a LYC load [30]. Only two SNPs in BCO1 have been previously 83
shown to be associated with the variability in LYC bioavailability [30]. While promising, the 84
small number of candidate genes previously investigated calls for more studies to explain the 85
variation in a phenotype that is likely affected by numerous environmental and genetic factors 86
[31]. In fact, we have recently demonstrated that the bioavailability of the carotenoid lutein is 87
a complex phenotype that is not modulated by any single gene, but by the additive effects 88
several gene SNPs [37]. Thus, the aim of this study was to identify the combination of SNPs 89
associated with the variability in LYC bioavailability. 90
7 Subjects and Methods
92
Subject number and characteristics
93
Thirty five healthy, nonobese, nonsmoking male subjects were recruited for the study. 94
Subjects presented with normal energy consumption, i.e. ≈ 2500 kcal/d and drank ≤ 2% 95
alcohol as total energy. They had no history of chronic disease, hyperlipidemia, 96
hyperglycemia, and were not taking any medication that might affect LYC or lipid 97
metabolism (e.g. tetrahydrolipstatin, ezetimibe, phytosterols, cholestyramine, fibrates, etc.) 98
during the month prior to the study or during the study period. Because of the relatively large 99
volume of blood that was drawn during the study, subjects were required to have a blood 100
hemoglobin concentration >1.3 g/L as inclusion criteria. The study was approved by the 101
regional committee on human experimentation (N°2008-A01354-51, Comité de Protection des 102
Personnes Sud Méditerranée I, France). The procedures followed were in accordance with the 103
Helsinki Declaration of 1975 as revised in 1983. The objectives and requirements of the study 104
were fully explained to all participants before beginning the study, and informed written 105
consent was obtained from each subject. Two subjects left the study for personal reasons 106
before participating in the postprandial experiment, leaving 33 subjects whose baseline 107
characteristics are reported in Table 1. Note that the fasting plasma LYC concentration of 108
these subjects was relatively high as compared to previous reported data [38] suggesting that 109
these subjects regularly consumed tomatoes and tomato products. 110
111
DNA preparation and genotyping methods
112
An average of 25 µg of DNA was isolated from a saliva sample from each subject 113
using the Oragene kit (DNA Genotek Inc., Kanata, ON, Canada) as described in detail 114
previously [39]. DNA concentration and purity were checked by spectrophotometry at 260 nm 115
and 280 nm (Nanodrop ND1000, Thermo Scientific, Villebon sur Yvette, France). All 116
8 genotyping procedures were carried out by Integragen (Evry, France). Concerning the whole 117
genome genotyping, the procedure was as follows: 200 ng of DNA was hybridized overnight 118
to HumanOmniExpress BeadChips (Illumina, San Diego, CA, USA), allowing the analysis of 119
approximately 7.33 x 10⁵ SNPs per DNA sample. Unhybridized and non-specifically 120
hybridized DNA was washed out. The BeadChips were then stained and scanned on an 121
Illumina iScan. Detailed methods are provided in the Infinium HD Assay Ultra Protocol 122
Guide from Illumina. Concerning the 40 other SNPs (see “Choice of candidate genes”), they 123
were genotyped as previously described [40]. 124
125
Postprandial experiments
126
Subjects were asked to refrain from consuming LYC-rich foods (tomatoes, tomato 127
products, foods rich in tomato, watermelon) for 48 h before the postprandial clinic visit. In 128
addition, the day prior to the visit, they were asked to eat dinner between 7 and 8 p.m., 129
without any alcohol intake. They were also asked to abstain from consuming any food or 130
beverage other than water after the diner and until the clinic visit. After the overnight fast, 131
they arrived at the local Center for Clinical Investigation (la Conception Hospital, Marseille, 132
France) and consumed a test meal including 100 g of tomato puree purchased from a local 133
supermarket providing 9.7 mg all-trans LYC as measured by high performance liquid 134
chromatography (HPLC). The puree also contained around 0.5 mg cis isomers of LYC as 135
evaluated by the relative peak area of all the cis-isomers (4 peaks identified) as compared to 136
the peak area of the all-trans isomer in the HPLC chromatograms. This LYC dose allowed us 137
to deliver about twice the mean dietary intake of LYC in France and a LYC dose close to 138
daily intake in the United states [30, 38]. The remainder of the test meal consisted of semolina 139
(70 g) cooked in 200 mL of hot water, white bread (40 g), egg whites (60 g), peanut oil (50 g), 140
and mineral water (330 mL). The subjects were asked to consume the meal at a steady pace, 141
9 with half of the meal consumed in the first 10 min, and the remainder of the meal consumed 142
in the 20 next min. This pacing should have ultimately reduced anyvariability in gastric 143
emptying due to variation in rates of intake. No other food was permitted over the following 8 144
h, but subjects were permitted to finish the remainder of the 330 mL of water they had not 145
drunk during the meal. A fasting baseline blood sample was drawn before administration of 146
the meal as well as at 2, 3, 4, 5, 6 and 8 h after meal consumption. Blood was taken up into 147
evacuated tubes containing K-EDTA. The tubes were immediately placed into an ice-water 148
bath and covered with aluminum foil to avoid light exposure. Plasma was isolated by 149
centrifugation (10 min at 4 °C and 878 g) within 2 h following collection. 150
151
CM preparation
152
Plasma (6 mL) was overlaid with 0.9% NaCl solution (4.5 mL) and centrifuged for 28 153
min at 130,000 x g at 10 °C using a SW41Ti rotor (Beckman Coulter, Villepinte, France) in a 154
Thermo Sorvall WX100 ultracentrifuge (Thermo Scientific, Saint Herblain, France). The 155
upper phase, containing mainly CM and large CM remnants [41, 42], was collected. 156
Immediately after recovery, CM were stored at -80 °C prior to LYC analysis. 157
158
CM LYC extraction and analysis
159
Total CM LYC, a mixture of all-trans and LYC cis isomers [42, 43], was extracted and 160
analyzed as follows. Briefly, up to 2 mL of CM was deproteinated by adding one volume of 161
ethanol which also contained apo-8'-carotenal as an internal standard. After adding two 162
volumes of hexane, the mixture was vortexed for 10 min and centrifuged at 500 x g for 10 163
min at 4 °C. The upper phase (containing LYC) was collected and the sample was extracted a 164
second time with hexane following the same procedure. The hexane phases were pooled and 165
evaporated completely under nitrogen gas. The dried extract was then redissolved in 200 µL 166
10 of a dichloromethane/methanol mixture (65:35, v/v). All extractions were performed at room 167
temperature under yellow light to minimize light-induced damage. A volume of 90 µL was 168
injected for HPLC analysis. Separation was achieved using a 10 × 4.0 mm, 2 µm Modulo-169
Cart QS guard column (Interchim, Montluçon, France) followed by a 250 × 4.6 mm internal 170
diameter, 5 µm particle size, YMC C30 column (Interchim) held at 35 °C. The mobile phase 171
was composed of HPLC grade methanol (A), methyl tert-butyl ether (B) and water (C). A 172
linear gradient of 96% A, 2% B, 2% C at t = 0 to 18% A, 80% B, 2% C at t = 27 min at a flow 173
rate of 1 mL/min was used. The HPLC system consisted of a pump (Waters 2690) connected 174
in-line with a photodiode-array detector (Waters 2996) (Waters, Saint Quentin en Yvelines, 175
France). LYC was identified via UV-Vis spectra and retention time coincident with authentic 176
standard (generous gift of DSM LTD, Basel, Switzerland) and quantitated at 472 nm. The 177
consecutive peaks, which contained all-trans LYC and cis-LYC isomers, were integrated 178
together to obtain the sum of all LYC isomers. Integration was performed using Chromeleon 179
software (version 6.80, Dionex, Villebon sur Yvette, France), and quantitation was performed 180
by comparing sample peak area with all-trans LYC calibration curves. Values were corrected 181
by extraction efficiency based on the recovery of the internal standard. 182
183
Calculations
184
The trapezoidal approximation rule was used to calculate the postprandial plasma CM 185
LYC response, i.e. the area of the postprandial plasma CM LYC concentration over 8 hours 186
(AUC). Calculated AUCs were baseline-corrected using the fasting plasma CM LYC 187
concentration measured in each subject. 188
189
Choice of candidate genes
11 The candidate genes included those whose encoded proteins have been shown by in 191
vitro methods to be involved in cellular uptake of LYC, i.e. SCARB1 (scavenger receptor class
192
B, member 1) [19] and CD36 (cluster of differenciation 36) [20], genes that are suspected to 193
be involved, directly or indirectly, in enterocyte LYC metabolism, e.g. L-FABP (liver-fatty 194
acid binding protein) [24], MTTP (microsomal triglyceride transfer protein), and genes that 195
have been associated in genome-wide association studies [23, 36] or candidate gene 196
association studies [30, 33-35] with blood LYC concentration. This resulted in the selection 197
of 26 genes (Supplementary table 1), representing 2202 SNPs on the arrays. In addition, we 198
added 30 SNPs in 23 genes that we have recently found to be associated with the postprandial 199
CM triacylglycerol response in the same group of subjects [44]. Indeed, CMs are the main 200
blood carrier of newly absorbed LYC and we hypothesized that genetic variants that affect the 201
secretion/clearance of CMs in the postprandial period likely affect the postprandial blood 202
response in LYC. We also added 40 SNPs that have been associated, in previous publications, 203
with lipid metabolism (Supplementary table 2). After genotyping of the subjects (see 204
above), SNPs whose genotype call rate was <95%, or SNPs presenting a significant departure 205
from Hardy-Weinberg equilibrium (P<0.05 following the Chi-squared test), were excluded 206
from all subsequent analysis (387 SNPs excluded; 1885 SNPs left for the PLS regression 207
analysis). 208
209
–Multivariate analysis with partial least squares regression
210
In order to identify SNPs associated with the variability in the postprandial plasma 211
CM LYC response, we employed partial least squares regression (PLS). PLS is a multivariate 212
statistical tool often used for chemometric [45] and spectrometric modeling, and which has 213
recently been applied to SNP-based predictions by our group [44, 46] and others [47, 48]. Due 214
to the large number of SNPs compared with the low number of subjects and multicollinearity 215
12 between SNPs, PLS regression is used to identify the best combination of variables (i.e. 216
SNPs) that are predictive of another variable, in this case the postprandial CM LYC response. 217
Since the inheritance model could not be known for the 1885 SNPs entered in the PLS 218
regression analysis, a general genetic model was assumed, i.e. the three genotypes of each 219
SNP were treated as separate categories with no assumption made about the effect conferred 220
by homozygous or heterozygous alleles on the phenotype. Different PLS regression models 221
were built using increasing variable in the projection (VIP) threshold values. The model 222
maximizing the explained (R²) and the predicted variance (Q²), and validated following cross-223
validation ANOVA, was selected. Additional validation procedures of the PLS regression 224
models [37, 44, 49] were also performed and are described in Supplementary Methods. 225
Simca-P12 software (Umetrics, Umeå, Sweden) was used for all multivariate data analyses 226 and modeling. 227 228 Univariate analysis 229
In a second approach, we performed univariate analyses to compare the postprandial 230
plasma CM LYC response between subgroups of subjects who bore different genotypes for 231
the SNPs selected in the PLS regression model. Differences obtained in the different genotype 232
subgroups were analyzed using Student’s t-test with the Benjamini-Hochberg correction, 233
using QVALUE software [50]. For all tests, an adjusted P-value<0.05 was considered 234
significant. 235
13
Results
237
Interindividual variability in postprandial plasma CM LYC responses to the test meal
238
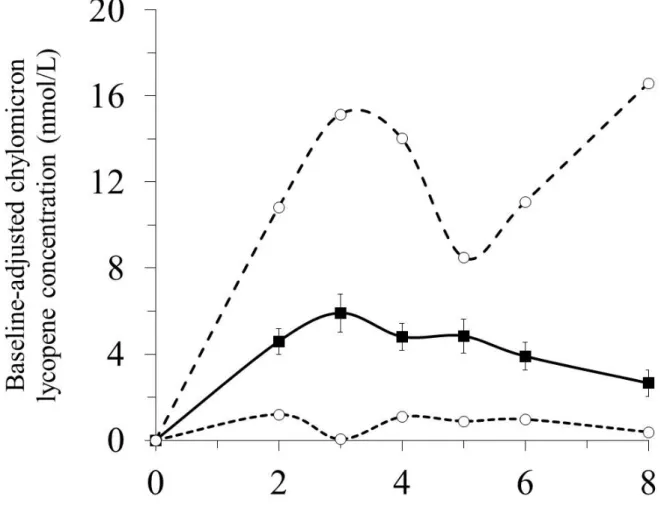
Figure 1 shows the postprandial CM LYC response after consumption of the test meal
239
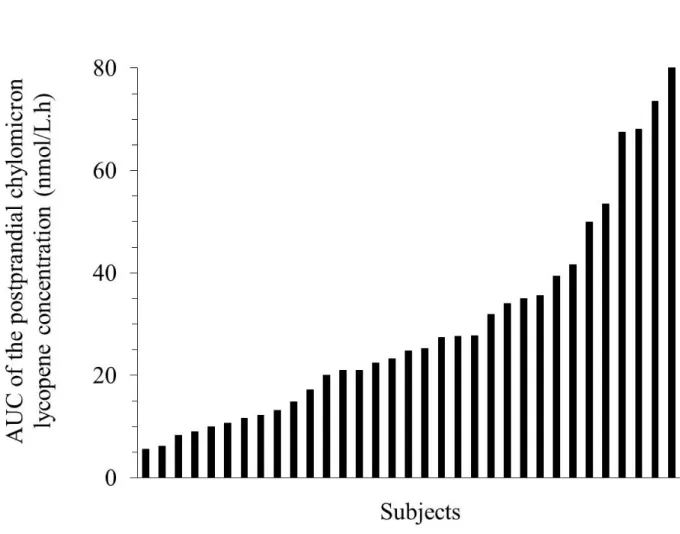
containing tomato puree. The CV of the postprandial plasma CM LYC response, called “LYC 240
response” hereafter in the manuscript, was 70%, as illustrated in Figure 2. 241
242
Correlation between the LYC response to the test meal and the fasting plasma LYC
243
concentration
244
In order to assess whether the fasting plasma LYC concentration, previously found to 245
be a good marker of LYC status, was related to LYC bioavailability, we calculated the 246
correlation between the LYC response of the subjects and their fasting plasma LYC 247
concentration. Results showed that there was a positive relationship between these two 248
variables (Pearson’s r=0.37, P<0.05). 249
250
Genetic variants associated with the LYC response
251
As explained in the subjects and methods section, we used PLS regression to examine 252
whether the 1885 candidate SNPs (used as qualitative X variables) could explain a significant 253
part of the variability in the LYC response of the subjects. As shown in Table 2, the model 254
including all SNPs explained the group variance with good accuracy (R2=0.95) but was not 255
predictive of this variance (Q2=-0.1). Therefore, to improve the model and find an association 256
of SNPs more predictive of the LYC response, we filtered out SNPs that made no important 257
contribution, i.e. those who displayed the lowest variable importance in the projection (VIP) 258
values. After applying several thresholds of VIP value (Table 2), we found that the best model 259
obtained included 44 SNPs (28 not in linkage disequilibrium, plus 16 in linkage 260
disequilibrium, shown in Supplementary table 3). The 28 SNPs were located in or near 16 261
14 genes (Table 3) and explained 72 % of the group variance, with a prediction index Q2 of 56 % 262
(Table 2). The robustness and the stability of the model were validated by three additional 263
methods detailed in the Supplementary Methods section. 264
Using univariate statistics, the association of the 28 SNPs with the LYC response was 265
further evaluated by comparing, for each SNP, the LYC response of subjects who bore 266
different genotypes (Table 3). For 11 of the 28 SNPs, subjects who bore different genotypes 267
exhibited a significantly different LYC response (q-value<0.05). 268
269
Genetic score to calculate the LYC response of a genotyped subject
270
Knowing a subject’s genotype at the 28 aforementioned loci, it is possible to calculate 271
his ability to respond to LYC, according to the following equation: 272
With RP as the responder phenotype (i.e. the LYC response), a as a constant, ri as the
273
regression coefficient of the ith SNP included in the PLS regression model, and
274
genotype.(SNPi) as a Boolean variable indicating the subject’s genotype at the ith SNP. A list
275
of the regression coefficients calculated by the SIMCA software can be found in 276
Supplementary table 5.
277
15
Discussion
279
The first key observation of this study was the high interindividual variability observed 280
in the LYC response to the test meal containing tomato puree. The 70% CV is in agreement 281
with previous reports [18, 26-30]. Until very recently, the reason for this high interindividual 282
variability was not known. Only one study has attempted to link this variability with SNPs in 283
two key genes of carotenoid metabolism, i.e. BCO1 and BCO2, by observing plasma LYC 284
response following a 3 week supplementation with tomato or watermelon juice [30]. This data 285
suggested that subjects with the AA/CT genotype combination at rs12934922 and rs7501331 286
in BCO1 were more responsive to LYC than those without this genotype combination. 287
However, numerous SNPs in genes related to other aspects of lycopene absorption and 288
excretion likely impact LYC response. Indeed, we have recently shown that 73% of the 289
interindividual variability in the bioavailability of the carotenoid lutein can be explained by a 290
combination of 29 SNPs in genes involved in lutein and lipid metabolism [37]. Moreover, 291
LYC bioavailability, is likely affected by multiple parameters besides LYC absorptione.g. 292
catabolism, tissue uptake, oxidation, etc. Therefore, we assessed the involvement of SNPs in 293
all genes suspected to modulate this phenotype. 294
The result of the multivariate analysis, whose validity was verified by several tests, 295
demonstrated that a significant part (72%) of the interindividual variability in the LYC 296
response could be explained by 28 SNPs in or near 16 genes. Seven out of these 16 genes, i.e. 297
ABCA1, LPL, INSIG2, SLC27A6, LIPC, CD36 and APOB, have recently been found to be
298
involved in the postprandial CM triacylglycerol response in the same group of subjects [44]. 299
This was not surprising as most newly absorbed LYC is carried from the intestine to 300
peripheral organs via CM, which are mainly composed of triacylglycerols. Since this study 301
focuses on LYC bioavailability, we will only discuss the potential role of the 4 genes that 302
were not associated with the CM triacylglycerol response and that had SNPs which displayed 303
16 a significant corrected P-value (Table 3). These genes were ELOVL2 (ELOVL fatty acid 304
elongase 2), MTTP (microsomal triglyceride transfer protein), ABCB1 (ATP-binding cassette, 305
sub-family B, member 1) and SOD2 (superoxide dismutase 2, mitochondrial). First, it is 306
striking to observe that 3 of the top 4 SNPs identified in the PLS model were related to 307
ELOVL2. This result suggests that this gene plays a key role in the LYC response. ELOVL2 is
308
known to catalyze the elongation of EPA (eicosapentaenoic acid) to DPA (docosapentaenoic 309
acid) and DPA to DHA (docosahexaenoic acid). LYC is not considered to be a substrate for 310
this enzyme, thus, this association is intriguing. Nevertheless, the fact that rs3798709 and 311
rs9468304 in ELOVL2 were also associated with both the lutein [37] and β-carotene response 312
(data not shown submitted to publication) strongly supports its involvement in carotenoid 313
metabolism. Three SNPs in MTTP were also found in the selected PLS model. MTTP encodes 314
for the microsomal triglyceride transfer protein, which is involved in the packaging of 315
triacylglycerols within the CM. Its association with the LYC response is therefore not 316
surprising, as LYC is incorporated into CM in the enterocyte. ABCB1 encodes for the P-317
glycoprotein, an ATP-dependent drug efflux pump for xenobiotic compounds with broad 318
substrate specificity. To the best of our knowledge, there is currently no study on the 319
involvement of this protein in LYC transport, but the present association suggests that this 320
protein may participate in LYC absorption, possibly by effluxing a fraction of uptaken LYC 321
back to the intestinal lumen. The low absorption efficiency of LYC, about 30% at the dose of 322
10 mg [18], supports this hypothesis, but further studies are required to determine ABCA1 323
involvement. Our results also suggest that SOD2, responsible for converting superoxide by-324
products to hydrogen peroxide and diatomic oxygen, is involved in LYC status, possibly 325
through impacts on LYC metabolism. We hypothesize that when this enzyme is not efficient, 326
superoxide by-products are quenched by LYC, leading to its degradation. 327
17 Surprisingly, some genes assumed to be involved in intestinal LYC bioavailability and 328
metabolism were absent from the selected PLS model. These genes are SCARB1 and CD36, 329
who code for proteins involved in the cellular uptake of LYC [19] [20], and BCO2 [10] and 330
BCO1 [22], which have been shown in vitro to cleave LYC. The fact that SCARB1 was not
331
associated with LYC bioavailability was surprising as this scavenger receptor has been 332
involved in cellular uptake of LYC by intestinal cells [19, 51] and a recent study showed that 333
a SNP in this gene was associated with blood LYC concentration [36]. The results with BCO1 334
are in contradiction with the work by Wang et al., cited earlier [30] but match the findings for 335
BCO2. We have three main hypotheses to explain these lacks of association. The first
336
hypothesis is that SNPs genotyped in these genes do not result in a functionally different 337
phenotype with regards to LYC bioavailability. The second hypothesis is that the association 338
of SNPs in these genes is weaker than that of the SNPs in the selected model. In other words, 339
these SNPs may play a minor role in LYC bioavailability. This is not in disagreement with the 340
fact that they can play a significant role in fasting blood LYC concentrations. For example, 341
SR-BI is expressed in several tissues which could explain that genetic variants in this gene 342
play a key role in, for example, blood LYC uptake by other tissues while they do not play a 343
key role in LYC uptake by the intestine.. Finally, the third hypothesis is that some SNPs in 344
these genes were not entered in the PLS regression analysis because either they were not 345
expressed on the BeadChips, or they were excluded from the analysis (for not following the 346
Hardy-Weinberg equilibrium or because their genetic call rate was <95%). While we 347
acknowledge these limitations of the study, the primary results remain, i.e. a significant 348
fraction of the variability in LYC bioavailability is associated with a combination in genetic 349
variants identified in our model. 350
After determining that LYC bioavailability is, at least partly, modulated by a 351
combination of SNPs, the obvious question that arose was : “do these SNPs impacting LYC 352
18 bioavailability affect long-term blood LYC status?” To answer this question, we assessed 353
whether there was a relationship between the LYC response of the volunteers to the tomato 354
puree test meal and their fasting plasma LYC concentrations. The result of this investigation, 355
which showed a significant relationship between the two parameters, suggests that the ability 356
to respond to dietary LYC is implicated in long term blood, and likely tissue, LYC 357
concentrations. Nevertheless, the relatively low correlation coefficient, i.e. 0.37, supports the 358
assumption that other factors, e.g. LYC catabolism, oxidative stress…, are involved in long 359
term blood LYC concentrations. 360
361
To conclude, the results of this study demonstrate for the first time that interindividual 362
variability in LYC bioavailability is, at least partly, genetically controlled. They also suggest 363
that ELOVL2 is implicated in LYC, and more generally, carotenoid metabolism. Furthermore, 364
the ability to respond to dietary LYC is a determinant of circulating fasting LYC 365
concentrations. These associations will need to be validated in other populations, which will 366
also allow for the identification of additional SNPs not included in our candidates based on 367
the current knowledge of LYC metabolism, which is still quite limited. The ultimate objective 368
of these studies will be to provide nutritionists with an accurate and validated genetic tool to 369
predict one’s individual LYC bioavailability for optimal LYC intake. 370
19
Tables
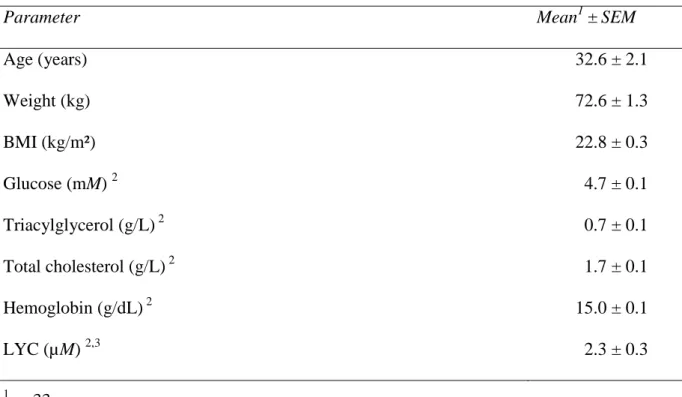
Table 1. Characteristics of the subjects included in the statistical analysis of the results.
Parameter Mean1 ± SEM
Age (years) 32.6 ± 2.1 Weight (kg) 72.6 ± 1.3 BMI (kg/m²) 22.8 ± 0.3 Glucose (mM) 2 4.7 ± 0.1 Triacylglycerol (g/L) 2 0.7 ± 0.1 Total cholesterol (g/L) 2 1.7 ± 0.1 Hemoglobin (g/dL) 2 15.0 ± 0.1 LYC (µM) 2,3 2.3 ± 0.3 1 n=33. 2
Fasting plasma variables.
20
Table 2. Performances of different partial least squares regression models to explain the
postprandial chylomicron lycopene response. 1
VIP threshold R² Q² SNPs no. P (CV-ANOVA)
No selection 0.94 -0.10 1885 1 >0.5 0.87 -0.10 604 1 >1.0 0.70 0.01 183 0.808 >1.5 0.73 0.57 61 0.109 >1.55 0.72 0.55 58 0.104 >1.6 0.71 0.52 56 0.104 >1.65 0.71 0.55 50 0.072 >1.7 0.72 0.55 45 0.041 >1.75 0.72 0.56 44 0.037 >1.8 0.70 0.45 32 0.047 >1.85 0.66 0.37 25 0.025 >1.9 0.63 0.36 23 0.037 >1.95 0.60 0.34 20 0.040 >2.0 0.62 0.39 16 0.036 >2.1 0.62 0.39 15 0.029 1
Different PLS regression models were built using increasing VIP threshold values. The
model maximizing the explained (R²) and the predicted variance (Q²), and validated following
cross-validation ANOVA plus three other validation methods (described in Supplementary
Material), was selected. This is the model with VIP >1.75, shown in the table.
CV-ANOVA, cross-validation ANOVA; Q², predicted variance; R², explained variance; SNP,
21
Table 3. Genes and single nucleotide polymorphisms associated with the postprandial
chylomicron lycopene response. 1
Gene and SNP rs no. 2 VIP value SNP minor allele frequency
Adjusted P-value 3 ELOVL2-rs3798709 3.38 0.252 0.030 ELOVL2-rs9468304 3.33 0.302 0.030 LPL-rs7005359 3.19 0.298 0.030 ELOVL2-rs911196 3.07 0.252 0.030 ABCA1-rs4149316 2.81 0.122 0.023 MTTP-rs17029173 2.73 0.135 0.030 ABCB1-rs10248420 2.67 0.347 0.030 PKD1L2-rs935933 2.57 0.201 0.053 MTTP-rs1032355 2.56 0.251 0.067 ABCG2-rs1871744 2.55 0.173 0.061 ABCA1-rs2791952 2.50 0.140 0.030 LPL-rs7841189 2.44 0.148 0.063 INSIG2-rs17006621 2.27 0.172 0.077 ABCA1-rs3887137 2.15 0.123 0.076 MTTP-rs745075 2.03 0.061 0.030 NPC1L1-rs17725246 1.97 0.254 0.106 LPL-rs17482753 1.95 0.088 0.101 SOD2-rs9365046 1.93 0.169 0.039 SLC27A6-rs10053477 1.91 0.209 0.090 ABCA1-rs1331924 1.88 0.245 0.091 ISX-rs2056983 1.85 0.117 0.092
22 LIPC-rs12914035 1.85 0.096 0.146 CD36-rs4112274 1.85 0.224 0.030 PNLIP-rs11197742 1.84 0.087 0.086 ABCA1-rs4149299 1.84 0.082 0.119 APOB-rs1042031 1.76 0.128 0.157 LIPC-rs8035357 1.76 0.150 0.101 ABCB1-rs10280101 1.75 0.145 0.101 1
SNPs present in the selected PLS regression model shown in Table 2.
2
SNPs are ranked by decreasing VIP value. Note that 16 out of the 44 SNPs present in the
selected model were in linkage disequilibrium. Since these SNPs provided redundant
information, we randomly kept one of each SNP (those presented in this table) in the final
selected PLS model. The SNPs in linkage disequilibrium with some of these SNPs are shown
in Supplemental table 2.
3
Student’s t-test with the Benjamini-Hochberg correction was carried out to determine
differences between the postprandial CM LYC response according to genotype groups for
each SNP.
SNP, single nucleotide polymorphism; rs, reference SNP; VIP, variable importance in the
projection. A complete list of gene names and symbols can be found in Supplementary table
23
Figures
Figure 1: Baseline-adjusted chylomicron lycopene (CM LYC) concentration over 8 h after consumption of the test meal containing tomato puree.
For each subject, postprandial CM LYC concentrations were baseline-adjusted by
normalizing to the fasting CM LYC concentration. The bold curve shows mean ± SEM of 33
subjects combined. The smaller dashed curve shows the concentration of CM LYC measured
in the lowest responder. The larger dashed curve shows the concentration of CM LYC
24
Figure 2: Individual AUCs of the postprandial CM LYC response after consumption of the test meal containing tomato puree.
25
Acknowledgements
We are very grateful to Dr. Rachel Kopec for critical comments on the manuscript.
The authors have no conflict of interest to declare.
The present work has received research funding from the European Community’s Sixth
Framework Programme. The funding was attributed to the Lycocard project (n°016213) which was an Integrated Project within the framework of the “Food Quality and Safety”
programme. This publication reflects only the view of the authors. The Lycocard community
is not liable for any use that may be made of the results.
Authors' contributions to manuscript:
PB designed research; MN conducted the clinical research; RB analysed lycopene by HPLC;
CD and PB analyzed data and CD performed statistical analysis; PB and CD wrote the paper;
26
References
[1] Story, E. N.; Kopec, R. E.; Schwartz, S. J.; Harris, G. K. An update on the health effects
of tomato lycopene. Annu. Rev. Food Sci. Technol. 1:189-210; 2010.
[2] Mordente, A.; Guantario, B.; Meucci, E.; Silvestrini, A.; Lombardi, E.; Martorana, G.
E.; Giardina, B.; Bohm, V. Lycopene and cardiovascular diseases: an update. Curr.
Med. Chem. 18:1146-1163; 2011.
[3] Bohm, V. Lycopene and heart health. Mol. Nutr. Food Res. 56:296-303; 2012.
[4] Giovannucci, E. Tomatoes, tomato-based products, lycopene, and cancer: Review of the
epidemiologic literature. J. Natl. Cancer Inst. 91:317-331; 1999.
[5] Viuda-Martos, M.; Sanchez-Zapata, E.; Sayas-Barbera, E.; Sendra, E.; Perez-Alvarez, J.
A.; Fernandez-Lopez, J. Tomato and tomato byproducts. Human health benefits of
lycopene and its application to meat products: a review. Crit. Rev. Food Sci. Nutr.
54:1032-1049; 2014.
[6] Biddle, M. J.; Lennie, T. A.; Bricker, G. V.; Kopec, R. E.; Schwartz, S. J.; Moser, D. K.
Lycopene Dietary Intervention: A Pilot Study in Patients With Heart Failure. J.
Cardiovasc. Nurs.; 2014.
[7] Kelkel, M.; Schumacher, M.; Dicato, M.; Diederich, M. Antioxidant and
anti-proliferative properties of lycopene. Free Radic. Res. 45:925-940; 2011.
[8] Kopec, R. E.; Riedl, K. M.; Harrison, E. H.; Curley, R. W., Jr.; Hruszkewycz, D. P.;
Clinton, S. K.; Schwartz, S. J. Identification and quantification of apo-lycopenals in
fruits, vegetables, and human plasma. J. Agric. Food Chem. 58:3290-3296; 2010.
[9] Erdman, J. W., Jr.; Ford, N. A.; Lindshield, B. L. Are the health attributes of lycopene
27
[10] Lindshield, B. L.; Canene-Adams, K.; Erdman, J. W., Jr. Lycopenoids: are lycopene
metabolites bioactive? Arch. Biochem. Biophys. 458:136-140; 2007.
[11] Mein, J. R.; Lian, F.; Wang, X. D. Biological activity of lycopene metabolites:
implications for cancer prevention. Nutr. Rev. 66:667-683; 2008.
[12] Gouranton, E.; Thabuis, C.; Riollet, C.; Malezet-Desmoulins, C.; El Yazidi, C.; Amiot,
M. J.; Borel, P.; Landrier, J. F. Lycopene inhibits proinflammatory cytokine and
chemokine expression in adipose tissue. J. Nutr. Biochem. 22:642-648; 2011.
[13] Aydemir, G.; Kasiri, Y.; Birta, E.; Beke, G.; Garcia, A. L.; Bartok, E. M.; Ruhl, R.
Lycopene-derived bioactive retinoic acid receptors/retinoid-X receptors-activating
metabolites may be relevant for lycopene's anti-cancer potential. Mol. Nutr. Food Res.
57:739-747; 2013.
[14] Gouranton, E.; Aydemir, G.; Reynaud, E.; Marcotorchino, J.; Malezet, C.; Caris-Veyrat,
C.; Blomhoff, R.; Landrier, J. F.; Ruhl, R. Apo-10'-lycopenoic acid impacts adipose
tissue biology via the retinoic acid receptors. Biochim. Biophys. Acta 1811:1105-1114;
2012.
[15] Wang, X. D. Lycopene metabolism and its biological significance. Am. J. Clin. Nutr.
96:1214S-1222S; 2012.
[16] Yeum, K. J.; Russell, R. M. Carotenoid bioavailability and bioconversion. Annu. Rev.
Nutr. 22:483-504; 2002.
[17] Borel, P. Factors affecting intestinal absorption of highly lipophilic food
microconstituents (fat-soluble vitamins, carotenoids and phytosterols). Clin. Chem. Lab.
Med. 41:979-994; 2003.
[18] Diwadkar-Navsariwala, V.; Novotny, J. A.; Gustin, D. M.; Sosman, J. A.; Rodvold, K.
28
pharmacokinetic model describing the disposition of lycopene in healthy men. J. Lipid
Res. 44:1927-1939; 2003.
[19] Moussa, M.; Landrier, J. F.; Reboul, E.; Ghiringhelli, O.; Comera, C.; Collet, X.;
Frohlich, K.; Bohm, V.; Borel, P. Lycopene absorption in human intestinal cells and in
mice involves scavenger receptor class B type I but not Niemann-Pick C1-like 1. J.
Nutr. 138:1432-1436; 2008.
[20] Moussa, M.; Gouranton, E.; Gleize, B.; Yazidi, C. E.; Niot, I.; Besnard, P.; Borel, P.;
Landrier, J. F. CD36 is involved in lycopene and lutein uptake by adipocytes and
adipose tissue cultures. Mol. Nutr. Food Res. 55:578-584; 2011.
[21] dela Sena, C.; Riedl, K. M.; Narayanasamy, S.; Curley, R. W., Jr.; Schwartz, S. J.;
Harrison, E. H. The human enzyme that converts dietary provitamin A carotenoids to
vitamin A is a dioxygenase. J. Biol. Chem. 289:13661-13666; 2014.
[22] dela Sena, C.; Narayanasamy, S.; Riedl, K. M.; Curley, R. W., Jr.; Schwartz, S. J.;
Harrison, E. H. Substrate specificity of purified recombinant human beta-carotene
15,15'-oxygenase (BCO1). J. Biol. Chem. 288:37094-37103; 2013.
[23] Ferrucci, L.; Perry, J. R.; Matteini, A.; Perola, M.; Tanaka, T.; Silander, K.; Rice, N.;
Melzer, D.; Murray, A.; Cluett, C.; Fried, L. P.; Albanes, D.; Corsi, A. M.; Cherubini,
A.; Guralnik, J.; Bandinelli, S.; Singleton, A.; Virtamo, J.; Walston, J.; Semba, R. D.;
Frayling, T. M. Common Variation in the beta-Carotene 15,15'-Monooxygenase 1 Gene
Affects Circulating Levels of Carotenoids: A Genome-Wide Association Study. Am. J.
Hum. Genet. 84:123-133; 2009.
[24] Reboul, E.; Borel, P. Proteins involved in uptake, intracellular transport and basolateral
secretion of fat-soluble vitamins and carotenoids by mammalian enterocytes. Prog.
29
[25] Dallinga-Thie, G. M.; Franssen, R.; Mooij, H. L.; Visser, M. E.; Hassing, H. C.;
Peelman, F.; Kastelein, J. J.; Peterfy, M.; Nieuwdorp, M. The metabolism of
triglyceride-rich lipoproteins revisited: new players, new insight. Atherosclerosis
211:1-8; 2013.
[26] Stahl, W.; Sies, H. Uptake of lycopene and its geometrical isomers is greater from
heat-processed than from unheat-processed tomato juice in humans. J. Nutr. 121:2161-2166;
1992.
[27] Bowen, P.; Garg, V.; Stacewiczsapuntzakis, M.; Yelton, L.; Schreiner, R. S. Variability
of Serum Carotenoids in Reponse to Controlled Diets Containing Six Servings of Fruits
and Vegetables per day. Ann. N Y Acad. Sci. 691:241-243; 1993.
[28] Johnson, E. J.; Qin, J.; Krinsky, N. I.; Russell, R. M. Ingestion by men of a combined
dose of beta-carotene and lycopene does not affect the absorption of beta-carotene but
improves that of lycopene. J. Nutr. 127:1833-1837; 1997.
[29] O'Neill, M. E.; Thurnham, D. I. Intestinal absorption of -carotene, lycopene and lutein in men and women following a standard meal: response curves in the
triacylglycerol-rich lipoprotein fraction. Br. J. Nutr. 79:149-159; 1998.
[30] Wang, T. T.; Edwards, A. J.; Clevidence, B. A. Strong and weak plasma response to
dietary carotenoids identified by cluster analysis and linked to beta-carotene
15,15'-monooxygenase 1 single nucleotide polymorphisms. J. Nutr. Biochem. 24:1538-1546;
2013.
[31] Borel, P. Genetic variations involved in interindividual variability in carotenoid status.
Mol. Nutr. Food Res. 56:228-240; 2012.
[32] Moran, N. E.; Erdman, J. W., Jr.; Clinton, S. K. Complex interactions between dietary
and genetic factors impact lycopene metabolism and distribution. Arch. Biochem.
30
[33] Ortega, H.; Castilla, P.; Gomez-Coronado, D.; Garces, C.; Benavente, M.;
Rodriguez-Artalejo, F.; de Oya, M.; Lasuncion, M. A. Influence of apolipoprotein E genotype on
fat-soluble plasma antioxidants in Spanish children. Am. J. Clin. Nutr. 81:624-632;
2005.
[34] Borel, P.; Moussa, M.; Reboul, E.; Lyan, B.; Defoort, C.; Vincent-Baudry, S.; Maillot,
M.; Gastaldi, M.; Darmon, M.; Portugal, H.; Planells, R.; Lairon, D. Human plasma
levels of vitamin E and carotenoids are associated with genetic polymorphisms in genes
involved in lipid metabolism. J. Nutr. 137:2653-2659; 2007.
[35] Borel, P.; Moussa, M.; Reboul, E.; Lyan, B.; Defoort, C.; Vincent-Baudry, S.; Maillot,
M.; Gastaldi, M.; Darmon, M.; Portugal, H.; Lairon, D.; Planells, R. Human fasting
plasma concentrations of vitamin E and carotenoids, and their association with genetic
variants in apo C-III, cholesteryl ester transfer protein, hepatic lipase, intestinal fatty
acid binding protein and microsomal triacylglycerol transfer protein. Br. J. Nutr.
101:680-687; 2009.
[36] Zubair, N.; Kooperberg, C.; Liu, J.; Di, C.; Peters, U.; Neuhouser, M. L. Genetic
variation predicts serum lycopene concentrations in a multiethnic population of
postmenopausal women. J. Nutr. 145:187-192; 2015.
[37] Borel, P.; Desmarchelier, C.; Nowicki, M.; Bott, R.; Morange, S.; Lesavre, N.
Interindividual variability of lutein bioavailability in healthy men: characterization,
genetic variants involved, and relation with fasting plasma lutein concentration. Am. J.
Clin. Nutr. 100:168-175; 2014.
[38] Porrini, M.; Riso, P. What are typical lycopene intakes? J. Nutr. 135:2042S-2045S;
2005.
[39] Hansen, T. V.; Simonsen, M. K.; Nielsen, F. C.; Hundrup, Y. A. Collection of blood,
31
of the response rate and quality of genomic DNA. Cancer Epidemiol. Biomarkers Prev.
16:2072-2076; 2007.
[40] Lecompte, S.; Szabo de Edelenyi, F.; Goumidi, L.; Maiani, G.; Moschonis, G.;
Widhalm, K.; Molnár, D.; Kafatos, A.; Spinneker, A.; Breidenassel, C.; Dallongeville,
J.; Meirhaeghe, A.; Borel, P. Polymorphisms in the CD36/FAT gene are associated with
plasma vitamin E levels in humans. Am. J. Clin. Nutr. 93:1-8; 2011.
[41] Luchoomun, J.; Hussain, M. M. Assembly and secretion of chylomicrons by
differentiated Caco-2 cells. Nascent triglycerides and preformed phospholipids are
preferentially used for lipoprotein assembly. J. Biol. Chem. 274:19565-19572; 1999.
[42] Richelle, M.; Lambelet, P.; Rytz, A.; Tavazzi, I.; Mermoud, A. F.; Juhel, C.; Borel, P.;
Bortlik, K. The proportion of lycopene isomers in human plasma is modulated by
lycopene isomer profile in the meal but not by lycopene preparation. Br. J. Nutr.
107:1482-1488; 2012.
[43] Richelle, M.; Sanchez, B.; Tavazzi, I.; Lambelet, P.; Bortlik, K.; Williamson, G.
Lycopene isomerisation takes place within enterocytes during absorption in human
subjects. Br. J. Nutr. 103:1800-1807; 2010.
[44] Desmarchelier, C.; Martin, J. C.; Planells, R.; Gastaldi, M.; Nowicki, M.; Goncalves,
A.; Valero, R.; Lairon, D.; Borel, P. The postprandial chylomicron triacylglycerol
response to dietary fat in healthy male adults is significantly explained by a combination
of single nucleotide polymorphisms in genes involved in triacylglycerol metabolism. J.
Clin. Endocrinol. Metab. 99:E484-488; 2014.
[45] Eriksson, L.; Antti, H.; Gottfries, J.; Holmes, E.; Johansson, E.; Lindgren, F.; Long, I.;
Lundstedt, T.; Trygg, J.; Wold, S. Using chemometrics for navigating in the large data
sets of genomics, proteomics, and metabonomics (gpm). Anal. Bioanal. Chem.
32
[46] Borel, P.; de Edelenyi, F. S.; Vincent-Baudry, S.; Malezet-Desmoulin, C.; Margotat, A.;
Lyan, B.; Gorrand, J. M.; Meunier, N.; Drouault-Holowacz, S.; Bieuvelet, S. Genetic
variants in BCMO1 and CD36 are associated with plasma lutein concentrations and
macular pigment optical density in humans. Ann. Med. 43:47-59; 2010.
[47] Le Cao, K. A.; Boitard, S.; Besse, P. Sparse PLS discriminant analysis: biologically
relevant feature selection and graphical displays for multiclass problems. BMC
Bioinformatics 12:253; 2011.
[48] Long, N.; Gianola, D.; Rosa, G. J.; Weigel, K. A. Dimension reduction and variable
selection for genomic selection: application to predicting milk yield in Holsteins. J.
Anim. Breed Genet. 128:247-257; 2011.
[49] Borel, P.; Desmarchelier, C.; Nowicki, M.; Bott, R.; Tourniaire, F. Can genetic
variability in alpha-tocopherol bioavailability explain the heterogeneous response to
alpha-tocopherol supplements? Antioxid. Redox. Signal.:Nov 12. [Epub ahead of print];
2014.
[50] Storey, J. D. A direct approach to false discovery rates. Journal of the Royal Statistical
Society: Series B (Statistical Methodology) 64:479-498; 2002.
[51] During, A.; Dawson, H. D.; Harrison, E. H. Carotenoid transport is decreased and
expression of the lipid transporters SR-BI, NPC1L1, and ABCA1 is downregulated in