HAL Id: hal-00914565
https://hal.archives-ouvertes.fr/hal-00914565
Submitted on 5 Dec 2013
HAL is a multi-disciplinary open access
archive for the deposit and dissemination of
sci-entific research documents, whether they are
pub-lished or not. The documents may come from
L’archive ouverte pluridisciplinaire HAL, est
destinée au dépôt et à la diffusion de documents
scientifiques de niveau recherche, publiés ou non,
émanant des établissements d’enseignement et de
A Two-mode Interference Measurement for Nanometer
Accuracy Absolute Distance Ranging
Michel Lintz, Ha Phung, Alain Brillet, Christophe Alexandre
To cite this version:
Michel Lintz, Ha Phung, Alain Brillet, Christophe Alexandre. A Two-mode Interference Measurement
for Nanometer Accuracy Absolute Distance Ranging. International Conference on Space Optics
-ICSO, Oct 2012, Ajaccio, France. �hal-00914565�
1
A Two-mode Interference Measurement for
Nanometer Accuracy Absolute Distance Ranging
Abstract — We present a laser ranging system, under
development, that uses a high frequency modulated beam to achieve sub-nm resolution by the combined use of interferometric and time-of-flight measurements. We first describe how the absolute distance is extracted from a two-mode interference signal. In particular we show that the signal, which presents both optical and synthetic wavelength scales, is essential to achieve nm-scale accuracy, despite the significant long-term phase drifts in the 20 GHz detection chains. Then we present results obtained with the telemeter implemented on an optical table, for a distance of about four meters, implemented by folding the laser beam path to the target. The challenge here is to achieve a phase and amplitude measurement of two 20 GHz signals with a resolution well below 10-4 cycle and 10-4, respectively, despite the fact that the signal undergoes very strong (×3) amplitude changes.
Keywords: electronic distance measurement, optical
interference, metrology, phase measurement, microwave
measurements
I. INTRODUCTION
Beyond its use in geophysics (survey of geological structures) or in large scale metrology [1], laser-based measurement of long distances is expected to find numerous applications in space missions. Nanometer-scale accuracy and resolution on the spacing of the satellites of a geodesy mission will improve the mapping of the gravitational field of the earth. Synthetic aperture instruments in formation flight, such as hypertelescopes [2] or the Darwin mission [3], require that the constellation geometry is known and controlled to much better than the wavelength of the observation window. Maintaining and controlling the relative pointing of satellites also requires high-accuracy high-resolution absolute ranging.
Recording the phase of a beam modulated at high frequency
F provides a simple way to monitor the distance to a target, up to an integer number N of synthetic wave-lengths
/
c F
Λ ≡ . It has been shown that this idea can be implemented in a way such that N can be determined, providing absolute distance measurement with a resolution at the 10 nm scale [4]. However this resolution was obtained for time scales of 10 to 1000 s, while the demand is often for a
measurement rate of 10 /s or higher. This requires higher sensitivity and points to a measurement scheme which includes optical interferometry.
Multi-wavelength interferometry has been able to provide both long synthetic wavelength and sub-wavelength accuracy [5]. Using multiple 40 GHz phase modulations of a CW laser, MSTAR [6] has reached nm-scale accuracy. More recently Coddington et al. [7] have demonstrated a laser ranging scheme that efficiently combines time-of-flight and interference measurements in a single measurement inspired from optical linear sampling [8]. The laser source, however, may require significant engineering to be space qualified. The telemeter presented here combines
i) a high-resolution, interferometric optical phase measurement, wrapped in the 0,λopt interval,
ii) a carrier modulation phase measurement at frequency F≈20GHz, wrapped in the
[
0,Λ]
intervaliii) a time-of-flight measurement.
If measurement iii) is precise enough to bring unambiguous meaning to measurement ii), which in turn has good enough precision to give absolute significance to measurement i), then absolute distances can be measured with an accuracy far better than the optical wavelength.
Here we demonstrate a measurement scheme in which the two phase measurements i) and ii) are obtained, in a consistent way, from the same interference measurement, using a 20 GHz beatnote, two-mode laser beam. On a set-up on which an ≈ 8 meter optical path length is implemented, we show that this measurement scheme can achieve the conditions required to provide nanometer accuracy absolute distance measurements. This is obtained provided that systematic errors associated both to stray optical interference and high frequency amplitude-to-phase conversion are adequately dealt with. In this paper we present the two-mode interference signal, its properties and its exploitation for nanometer-scale accuracy absolute distance measurement. We will not address the time-of-flight aspect of the measurement scheme, and only
Michel Lintz, Duy-Ha Phung, Alain Brillet, Christophe Alexandre
D. H. Phung, Alain Brillet and M. Lintz are with ARTEMIS, Univ. Nice Sophia, Observatoire de la Cote d'Azur and CNRS, Bd de l'Observatoire, 06300 Nice, France (e-mail: [email protected]).
C. Alexandre is with CEDRIC/LAETITIA, CNAM, 292 Rue Saint Martin 75141 Paris Cedex 03, France (e-mail: [email protected]).
This work was supported by ANR (Grant ANR-07-BLAN-0309-01) and CNES.
assume that a time-of-flight measurement has been achieved beforehand with a relative accuracy of ≈10-5
or better [9], [1]. II. MEASUREMENT PRINCIPLE
The telemeter uses a synthetic wave for the purpose of ranging measurements. This synthetic wave is the result of the optical beat-note between two single-mode lasers at 1.54 µm phase-locked at a fixed frequency of F = 20.04 GHz [10]. The corresponding synthetic wavelength
Λ
≡
c
/
F
is close to 15 mm.A. The two-mode interference signal
The two-mode [vopt, vopt + F] laser beam propagates along two different paths: a reference path of constant length l, and a measurement path of length L, variable. The interference of these two beams provides the signal from which we extract the quantity to be measured, i.e. the length difference between the two paths: ∆L ≡ L– l.
Figure 1. Schematic diagram of the telemeter
In the diagram above, we assume that the polarization of the initial beam is oriented so that a small fraction of the power, ε =² a few %, propagates along the reference path with S polarization. The remaining power (fraction 1−ε², close to 100%) propagates along the measurement path with P polarization (S polarization after the half-wave plate) and interferes with the reference beam. The intensity, I(t), of the two-mode interference is detected by photodiode PhD1. The ("reference") photodiode PhD0 delivers a signal whose amplitude and phase are used to eliminate power and phase fluctuations of the laser sources.
Photodiode PhD1 receives a beam whose intensity has three contributions: beam intensity of the measurement beam (fraction (1−ε2)), intensity of the reference beam (fraction ε2), and the interference term:
(
)
(
(
)
)
(
)
(
)
(
)
(
)
(
)
(
)
(
(
)
)
2 2 2( )
1
1 cos
/
1 cos
/
2
1
cos
(
) /
(
) / 2
cos
/ 2
cos
/ 2
I t
t
L c
t l c
L l
c
L l
c
t
L l
c
L l
c
ε
δ
ε
δ
ε
ε
ω
δ
δ
δ
× = −
+
−
+
+
−
+
−
−
+
−
−
+
+
−
(1)where :
ω
≡
2
π
v
opt=
2
π
c
/
λ
opt ,δ
≡2π
F =2π
c/Λ . Note that this expression is valid only in vacuum. Application to quantitative measurements in air would require that two indices of refraction, at the two wavelengths, are taken into account.The measurement exploits the phase and amplitude of the
( )
cos δt terms, modulated at the high frequency
F
.We will use the vector representation, wherein a signal
cos( )
A δt+ϕ is represented by a vector ar=Aeiϕ
in the complex plane, and we re-write eq. 1 in the form
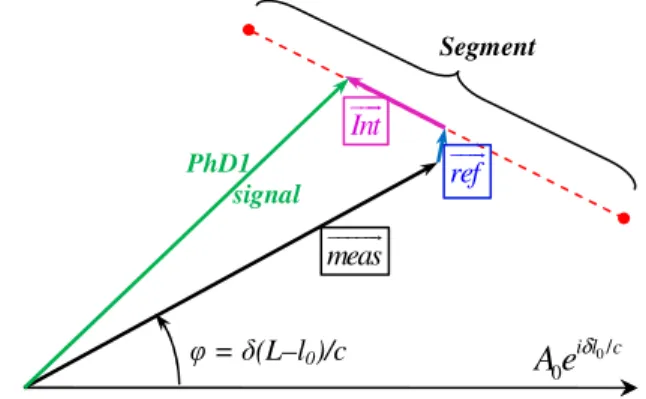
a=meas+ref +Int
uuuuur uuur uuur r (2) where 2 (1 ) i L c meas= −ε eδ uuuuur , 2 i l c ref =ε eδ uuur ,
(
)
( )2 2 2 (1 ) cos ( / 2) ( ) i L l c Int ε ε ω δ L l c eδ + = − + − uuur .The ranging procedure has to determine two key parameters of the signal, as shown in Figure 2:
- the position of the tip of the vector Int
uuur
on the segment, to extract the interferometric phase
(
ω δ+ 2)(
L l−)
c , i.e. the sub-λopt (high resolution) measurement.- the phase δL=2πL/Λ of vector meas
uuuuur
, i.e. the synthetic phase (intermediate scale) measurement of ∆L, and this is done by exploiting the dependence of the two-mode interference signal ar as a function of νopt, and as a function of
∆L.
Figure 2. Addition, in the complex plane, of the three contributions to the PhD1 two-mode interference, signal. The phase eil0δ/c, of the PhD0
photodiode, is taken as the phase reference.
B. Characteristics of the two-mode interference signal
Scan of the master laser optical frequency The vector Int
uuur
is the interference contribution. When the optical frequency νopt of the two-mode source varies over more
than the free spectral range FSR ≡ c/(L–l), the tip of the vector
ar (measurement signal) travels back and forth along the "segment" (Figure 2), of length 4ε 1−ε², characteristic of the
φ = δ(L–l0)/c 0/ 0 i l c
A e
δ PhD1 signal Segment Int uuur ref uuur meas uuuuur3 optical interference between the measurement and reference
beams. In the ideal experiment, the segment is perfectly straight (this property will be used thoroughly in the identification and reduction of imperfections, see §IV).
Dependence on the target position
The
∆
L
dependence is more complex, as two of the three contributions to ar are affected by a change of the distance:i- not only the amplitude of the Int
uuur
vector changes, due to the change of the cos (
(
ω δ+ / 2) (L l c− ))
factor, butii- its direction also changes, due to the eiδ(L l+)/ 2c
factor, and
iii- finally the direction of the meas
uuuuur
vector also changes, through the ei L cδ
factor.
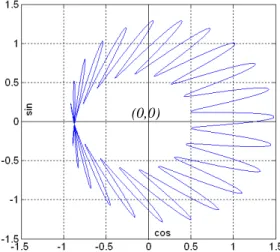
Finally, the pattern obtained when the target is moved by half a synthetic wavelength displays a large number (ω δ/ ≈104) of spikes. The spikes are illustrated on Fig. 3, with the choice of ω δ ≈20 for the spikes to be conveniently observable.
Figure 3. The calculated two-mode interference pattern obtained, at constant
opt
v , when the target is moved continuously over Λ 2, with ε =0.25
Each spike corresponds to one fringe of the optical interference.
C. The ranging procedure
From a single measurement of this complex interference signal (one single data point in the complex plane) one cannot extract the three contributions separately. However, assuming that a time-of-flight measurement has been done beforehand, with a precision better than 10-5, one has an estimate of the free spectral rangeFSR.One can then perform three measurements
1,
ar ar2, ar3,in which the optical frequency of the beam is changed fromνopt to νopt+FSR/ 4 and then to νopt+FSR/ 2, respectively. Then these three data points of the two-mode
interference signal can be processed in a relatively straightforward manner to compute, separately, the interferometric phase Φinter ≡ 2π∆L/λopt (modulo 2π), and synthetic phase Φsynt≡ 2π∆L/Λ (modulo 2π).
Figure 4. The three data points: choice of the sequence of three different optical frequencies
We perform a measurement of ar every 15 µs and assume that
∆
L
does not vary during the three-state pattern. With this 3-fold data group a a1, 2,a3r r r
, we first calculate the position of the segment centre:
0 ( 1 3) / 2
ar = ar +ar , (3) the length of the segment
(
2 2)
2
1 0 2 0
4ε 1−ε =2 ar −ar + ar −ar , (4) as well as its direction, given, for instance, by the direction of
1 2 1 2 a a a a − − r r r r . (5)
From eqns (3) and (4) above, and since 2
1
ε << , we can use a perturbative treatment to subtract the ref
uuur
vector and obtain the
meas
uuuuur
vector. Ideally, one can use the direction of meas uuuuur
to obtain the value of the synthetic phase, that is, the orientation of the meas
uuuuur
signal in the complex plane. In practice, this approach will fail, due to the slow drifts (larger than 10-4 cycle at the 1minute time scale, see sect. V-A) in the measurement chains. However, the direction of the segment provides another determination of the synthetic phase, and the combination of these two provides (L l− ) /Λ in a way which eliminates the slow drifts. This point can be seen by writing the identity
(
)
0 202 2
L l− L l− L+ −l l
= −
Λ Λ Λ . (6)
In other words, one can obtain the synthetic phase δ∆L c/ as twice the angle between the meas
uuuuur
and Int uuur
vectors: in this way, the long term phase drifts between the two detection chains are eliminated. This point, made possible by the choice of recording a two-mode interference signal, is essential in giving access to accuracies far below the optical wavelength.
1
(
opt)
a
r
=
a v
r
2(
opt/ 4)
a
r
=
a v
r
+
FSR
3(
opt/ 2)
a
r
=
a v
r
+
FSR
0a
r
δ(L–l0)/c ref uuur Int uuur meas uuuuur 0/ 0 i l cA e
δ 0 (0,0)Finally, the interferometric phase is obtained from the vector
(
a1−a0)
2ε 1−ε²r r
.
D. Conditions for the ranging procedure
For the procedure to be applicable, it has to fulfill two conditions:
i) The 3-fold pattern must be completed in a time short enough to match equations a ar1, r2,ar3 written with the same value of ∆L.
ii) The accuracy of phase and of the amplitude ratio measurements should be respectively much better than 10-4 cycle and 10-4, otherwise the procedure may converge to a value of L∆ shifted by integer numbers of the optical wavelengthλopt.
Condition i) involves the acquisition rate (the time interval τ between the recordings of ak
r
and ak+1
r
, k = 1,2 ) and the target speed. With 3-fold data groups a a1, 2,a3
r r r
, and τ=15 µs, the maximum target speed is calculated to be of about 2.6 µm/s which is unacceptable. However, with a modified, yet straightforward procedure with 5 points a a a1, 1, 2,a a3, 3
r r r r r , a gain by a factor of 100 (at 260 µm/s) can be obtained on the target speed limit. Higher speed limits may still be obtained by a more sophisticated procedure. For a rapidly moving target, for which nanometer accuracy is not required, the bare measurement signal meas
uuuuur
is easily obtained by masking the reference beam and can be used to provide ranging information at high rate and intermediate precision.
Condition ii) involves two different aspects.
- systematic errors, either with optical origin, or due to electronic imperfections. These points are addressed in sect. IV.
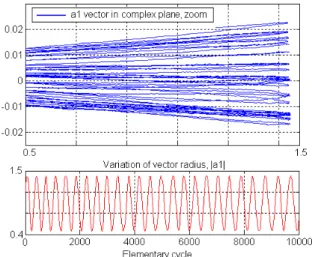
- statistical noise: Given the noise on the data (see sect. V-A), it is important to note that an elementary cycle of the procedure (a three-fold data group, as described above) is not enough. Several hundred measurements of 3-fold data groups are necessary to achieve the required precision: as will be seen in Sect. V-A, one full measurement cycle consists of N = 320 elementary cycles, and provides a sufficient statistical precision on Φsynt to determine uniquely ∆Linter. But a naive averaging is meaningless because (unless the target speed is restricted to very low values, of the order of 1 µm/s), the target movement, during the averaging, will exceed the expected statistical accuracy.
The ranging procedure supports the movement of the target and allows to average N 3-fold data groups, yet keeping the benefit of interferometric measurement. The idea is to take advantage of the interferometric measurement, obtained at each cycle i, to correct the value of synthetic measurement ∆Lsynt(ti) for each of N 3-fold data groups to obtain N values of
0
( )
t Inter i
L= t
∆ , i.e N values of L at the beginning of the
measurement cycle, which lend themselves to averaging.
III. EXPERIMENTAL SET-UP
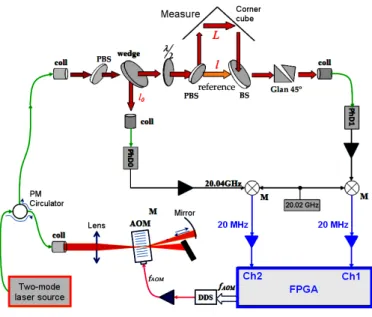
Figure 5. Experimental setup
Orange : laser beams ; green : optical fiber ; black : HF signals (20.04 GHz) ; Blue : RF signals (20 MHz) ; coll. : fibered collimator; (P)BS: (polarizing)
beam splitter; wedge : wedged splitter plate; Glan 45° : Air Glan polarizer, oriented at 45 °, realizes the interference of the measurement and reference beams; AOM: Acousto Optical Modulator; DDS: Direct Digital Synthesizer.
M: mixers
A double pass AOM allows the update of optical frequency
opt
v to be done in about a microsecond. Wedged optics are systematically preferred, see § IV-A.
The microwave signals (20.04 GHz) are detected by two 20 GHz bandwidth photodiodes. At the output of the mixers, the two 20 MHz sinusoidal signals are sampled during 10 µs using two 250 MS/s, 14 bit analog-to-digital converters. Inside a Virtex-6 FPGA, the signals are then translated from 20 MHz to 0 Hz, low-pass filtered and decimated. The resulting complex values are used every 27 µs to compute amplitudes and phase difference using the CORDIC algorithm [11]. The accuracy of the phase meter is about 3×10⁻⁵
on the amplitude ratio and 3×10⁻⁵
cycle on the phase measurement and the resolution is better than 10-6 cycle with averaging time of 25 ms: the device meets the specifications for the telemeter operation.
The FPGA also controls the RF frequency fAOM sent to the AOM: the frequency changes are made at the end of each 10 µs elementary data acquisition. We chose to record 5-fold data groups, [vopt, vopt –ISL/4, vopt +ISL/4, vopt –ISL/2, vopt +ISL/2] (instead of 3-fold in the basic procedure) for more redundancy in the signals and thus more checks against possible systematic errors. After N = 320 5-fold data groups, the FPGA transfers via Ethernet the phase and amplitude data to a computer which calculates ∆L using the procedure outlined in Sect. II.
5
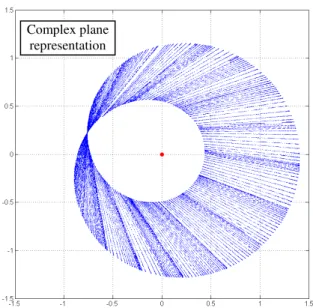
Figure 6. Experimental pattern of the two-mode interference signal when a manual translation stage is used to move the target by ≈ Λ/ 2.
On Fig. 6 the 20 GHz signal is recorded during a fast scan of the length L of the measurement path (corner cube displacement of 7.5mm in 50 seconds). The non-regularity of the spikes is caused by the non-regularity of the target speed. The white areas correspond to data transfers, during which no data acquisition is possible. The significant fraction of dead zones in this example is due to the use of a very slow serial link (later replaced by a TCP-IP link).
The spikes in figure 6 seem to be very straight. In fact detailed examination of the data may reveal significant distortions, of several kinds: elliptical distortion, with the consequence that "spikes" overlap, curved spikes, S-shaped spikes. These defects are:
- for some, of optical origin, such as interference with a coherent beam (stray or multiple reflections)
- for others, of electronic origin. Achieving the goal of 10-4 accuracy is here made difficult due to the fact that the large variations of the signal amplitude couple to defects such as AM-to-PM transfer in microwave components.
IV. SYSTEMATIC DISTORTIONS ON THE MEASURED SIGNAL
A. Optical cross-talk
As well as the measurement and reference beams, characterized by the lengths L and l, and by the power fractions of 1-ε2 and ε2, a stray optical beam is characterized by the beam path length lstray and the power fraction εstray
2
. Each stray beam adds additional interference terms that tend to distort the segment. Depending on the value of lstray it can be shown that the distortion of the segment can be an ellipse, or a figure 8, an S shape,… Indeed an analytic treatment (see annex A) shows that it can be described by the corresponding Lissajoux curves. For these contributions to be smaller than 10-4 one has to achieve εp2 < (1/4)10-8. Such a rejection factor cannot be expected from an anti-reflection coating. As a consequence all the parallel optics of the setup, such as PBS and BS cubes…, have been replaced by wedged optics. Checking the level of
stray contributions can be done by monitoring the phase and amplitude when the beam on the reference arm is blocked, hence preventing the interference: modulations, when the optical wavelength λopt is scanned over 1nm, are the signature of the presence of stray beams or multiple reflexions.
B. Laser beat-note sidebands
Eq. 1 is valid assuming a pure two-mode laser source. Optical amplifiers can affect the two-mode spectrum: self-modulation in a semi-conductor amplifier can add significant sidebands [12]. Fig. 7 shows data recorded when the beam is amplified in a semiconductor amplifier. The observed ellipticity is prohibitive (nearly 5 10-2). This is due to the significant fraction (≈10-2
) of optical power in the sidebands, as observed with an optical spectrum analyzer, and has been eliminated by replacing the semiconductor optical amplifier by a fiber amplifier.
Figure 7. Elliptical distortion of the segment associated with the presence of 1% sidebands in the laser beat-note spectrum. The optical wavelength of the
laser source is scanned by 120 MHz in 12 seconds. a): amplitude, and b) phase of the PhD1 signal. c): complex plane representation, where the transverse coordinate of the segment is magnified to highlight the distortions.
By using only wedged optics and a spectrally pure, two-mode beat-note we obtain a signal without distortions related to optical defects.
C. Cross-talk in the electronic measurement channels
Electronic crosstalk between the two channels is one of the causes of systematic error. This effect can be corrected for if the four parameters of the cross-talk (two amplitudes and two phases) have been determined beforehand. To this end, we mask the reference path, and move the target by a few Λ to vary the phase difference of the two channels for a few π radians. The crosstalk is of the order of a few 10-3 in amplitude, and proves to be quite stable over time.
D. Amplitude-to-phase (AM-to-PM) coupling
Each measurement channel is composed of a photodiode, a HF amplifier, a mixer, an RF amplifier and an analog-to-digital converter. Each of these components may generate amplitude-to-phase coupling. Dedicated experiments [13] made to quantify this effect in different photodiodes have shown that Complex plane
the AM-to-PM coupling includes a significant part which has a
transient behavior, with typical time scales in the 10 µs range. Other microwave components (amplifiers for instance) may introduce other time scales in the transient AM-to-PM coupling.
The ranging procedure implies large changes of the signal (up to a factor of 3 in amplitude) every 15 µs. As a consequence, beyond the distortion of the segment due to the stationary AM-to-PM, a hysteresis is expected at the 10-20 µs time scale due to the transient AM-to-PM. This is conspicuous in fig 8, with points a2
r , a3
r , a4
r
. The fact that almost no hysteresis is observed with points a1
r and a5
r
is due to the fact that
- the data acquisition for a1
r
is preceded by a 70 µs dead time (processing of the previous data)
- For consistency checks,a5
r
is recorded with the same interferometric phase (modulo 2π) as ar4, and hence the same amplitude.
Figure 8. Segments obtained with 60000 5-fold data groups, when the master laser is slowly scanned (about 200 MHz in 5 minutes).
These recordings are performed with a path length L such that the segment is radial, that is, the situation where the change in the signal amplitude, and hence the AM-to-PM effects are maximum. As in Fig. 7, the transverse coordinate is
magnified, to highlight the distortions.
Phase of points a2, a3, a4 are measured 8 µs after optical frequency change. The transient effect can be approximately corrected for by the exponential model below:
1 2 2 2 2 1 1 2 2 3 2 2 3 2 1 2 2 4 3 2 4 3 1 5 4 2 0 ( ) exp( / ) exp( / ) ( ) exp( / ) exp( / ) ( ) exp( / ) exp( / ) f A A f A A f A A ϕ ϕ δ τ ϕ ϕ δ τ δ τ ϕ ϕ δ τ δ τ ϕ ϕ δ τ ∆ = ∆ = − − ∆ = ∆ − + − − ∆ = ∆ − + − − ∆ = ∆ − (7)
where δ1 = 8 µs, δ2 = 15 µs result from the timing of the measurement procedure; Ai are amplitudes of the five data points ; the free parameters are the factor f, and the time
constants τ (the value is somewhat different for an increase and a decrease in the signal).
The stationary effect is characterized by measuring the phase as a function of the signal level, when the level is varied slowly. By using a cubic polynomial, the correction can be performed easily on the measured phase and the curvatures on the segment are eliminated.
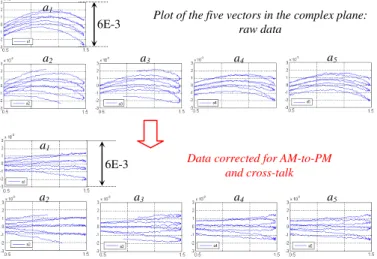
Figure 13 below shows the two-mode interference signal when scanning the measurement length L, without and with the corrections of the AM-to-PM transfer. The curvature and hysteresis effects on the segments are well corrected and neighboring spikes do not overlap anymore.
Figure 9. Spikes recorded by scanning the measurement length L, without and with AM/PM effect correction
E. Saturation effect
The electronic components in the measurement channel can give rise to saturation. In the complex plane, saturation effect may add a curvature on the segment and change the segment length. Figure 10 below shows segments recorded at very high power, to highlight this curvature.
Figure 10. Spikes recorded at very high power, for different position of the target: complex plane representation. The optical frequency is kept constant. Blue data: simulation, with ε = 0.22, taking into account the AM-to-PM and
saturation effects Amplitudes of 5 vectors 6E-3 a1 a2 a3 a4 a5 a1 a2 a3 a4 a5
Data corrected for AM-to-PM and cross-talk
6E-3
Plot of the five vectors in the complex plane: raw data
Interference signal recorded at very high power a4,5
7 The observed curvature results from both saturation and
stationary AM-to-PM coupling. It turns out that in one part of the complex plane, the two effects approximately compensate: absence of curvature. The simulation (blue dots) is in agreement with the experimental data.
By working
- at low optical power,
- and using a mixer with a high 1dB compression point (Miteq DM0520MW1, P1dB = 8dBm),
saturation is less than 10-4 and we do not observe an effect of saturation on the final ranging measurements.
V. RANGING MEASUREMENTS
A. Statistical noise in the experimental data
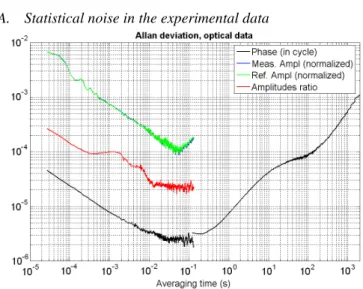
Figure 11. Stabilities of the relative phase and amplitude ratio measurements with an optical signal without interference (the reference path is masked). The average acquisition rate is 27µs. Points "Ampl C1" are almost completely
covered by points "Ampl C2".
Noise on the amplitude and phase of optical data is plotted as Allan deviation curves in Fig. 11. It clearly exceeds the noise recorded when the 20 MHz signal of a synthesizer is split and fed to the two channels of the data acquisition unit.
The amplitude ratio (red curve) efficiently eliminates common mode instabilities on the two amplitudes (green and blue curves). At short time scale (< 270 µs), only white noise is observable on the phase difference and amplitude ratio measurements. The humps from 270 µs to 10 ms on amplitudes ratio corresponds to acoustic noise (mainly fans) in the room which disturbs the 7.5 m measurement path. We chose to work with 1600 points (320 5-fold data groups), where the phase and amplitudes ratio have their optimum stability, at 2.5 10-6 cycles and 2.5 10-5, respectively. A full cycle of the measurement procedure corresponds to 43 ms of data taking. From 1s to 10s and above, instabilities appear, which can be several 10-3 cycles at the 15 minute time scale. They are probably related to temperature instabilities of the circuits involved (amplifiers, mixers ...). The HF amplifiers, in particular, dissipate significant power (several W). These drifts do not perturb the
ranging procedure, performed and completed in a much shorter time (43 ms of data taking).
B. Resolution of the interferometric measurement
The ranging procedure is tested over a folded ~ 7.5 m path on an optical table (simulating the measurement of a ~ 3.75 m distance). As the ToF measurement unit is not yet integrated on the telemeter setup, we tested the principle of two-mode interference measurement without the ToF measurement, but using a 3D measurement arm and the synthetic phase measurements at 20.04 GHz to obtain a value of L with an accuracy of about 10 µ m.
Figure 12 below shows the results of 320 measurements in about 43 ms, corresponding to 320 elementary cycles, with then without interference.
Figure 12. Results of 320 elementary cycles in 43 ms. The target position and the two-mode optical frequency are fixed. a) In the presence of the measurement/reference interference, the variations in the data
result from nm-scale variations in ∆L. Points: 320 measurement values. Blue curve: fit by a sum of harmonics corresponding to the frequency band of the measured acoustic perturbations on the setup. b) By masking the reference path and by converting the observed noise into length data: one measures the
instrumental noise.
Figure 13. The expected resolution of the telemetric measurement. Same data as in Fig. 12 b)
time (ms)
0.135
nm Full cycle resolution
attendue 13pm Elementary cycle resolution 100pm Allan deviation of meas. noise 1/3*1/sqrt(tau) Without interference 10nm 0.4nm 7.4926988829 m Zoom x25 b) 10 ms With interference 10nm
Length measurement vs time a)
From the noise observed on the data without interference one can expect a resolution of around 100pm on each elementary 5-fold measurement cycle (duration ≈100 µs), and significantly less than 100pm after the full cycle of a telemetric measurement (43 ms).
C. Convergence of the high-accuracy measurement
For the telemetric measurement to deliver the correct value, it is necessary that the noise on the data be sufficiently low: if the noise is too high, the procedure may converge to a value which is shifted by one or several timesλopt , even in the
absence of systematics. We verified that the noise is low enough that the procedure converges mostly to the same value. Figure 14 below shows 85 successive measurements, during which the target is stationary at <10 nm. Only four errors are observable. This result is satisfactory, as the detection chains have not yet been optimized in terms of noise (HF amplifiers, in particular, are standard components).
Figure 14. Convergence of the interferometric phase measurement, over 85 results.
D. The accuracy and the effect of electronic distortions on the result
Here, the range measurement procedure is repeated while the target is moved continuously at about 2 µm/minute. The speed is a few wavelengths per minute. We record 10,000 full measurement cycles in 10 minutes.
The expected, ideal pattern for the two-mode interference signal, shown in Fig. 3, is a regular series of spikes, each spike being an interference fringe. As seen on Fig. 15 below, the
Figure 15. The "spikes" of the telemetric signal trajectory in the complex plane when the measurement path length is varied by 25λopt ≈ 39 µm in
10 mn
recorded spikes are not regular at the 10-3 radian level. Due to the slow phase drifts in the two measurement chains at the 10s-1 mn time scale, the spikes are sometimes superposed. However, as mentioned above, the length measurements are completed in a much shorter time, and are not affected.
After the phase and amplitudes measurements of 10,000 full cycles, we proceed to the calculation of 10000 length values 0
( )
t Inter i
L= t
∆ , (see end of Sect. II-D), plotted in Fig. 16.
Figure 16. The result of 10,000 full cycles (a) without and (b) with correction for electronic distortions. For convenience, the length values are shifted
by 7, 492717m
Without correcting for the electronic distortions, Figure 16-a, systematic errors are large (~100 µm), and correlated with the interference fringes, as expected from crosstalk and AM-to-PM coupling, since the interference order strongly modulates the signal amplitude. If electronic defects are corrected for, Figure 16-b, the result is much better, the procedure converges with a rate of 74.5%.
The wrong values (shifted by ±λopt) do not seem to be
randomly scattered. Thus we suspect that more accurate correction of the data would further eliminate systematic effects. To approach 100% convergence, work should focus both on electronic imperfections and on noise.
Figure 17. Same as Fig. 16, except for the νopt frequency update rate, 10 times faster in Fig. 16
2000 full cycles
10000full measurement cycles of length, raw data
10000 full measurement cycles of length, corrected data 50 µm a) b) 10 µm 20 µm 10 µm
5000 full measurement cycles of length, with correction for cross-talk and for stationary and transient AM/PM coupling. 5000 full measurement cycles of length, raw data
9 This operation mode is not acceptable for efficient ranging,
since it considerably slows the measurement rate, but it is a benchmark for quantifying the importance of transient effects in fast acquisition mode.
VI. CONCLUTIONS
With these results we demonstrate that the two-mode interference signal can be exploited for high-resolution, high accuracy absolute distance measurement, if combined with a time-of-flight measurement. This is confirmed, not only by tests (not presented here) performed on simulated data affected by noise, but also by tests on the recorded data. In this work, the specific form and behavior of the signal is thoroughly exploited. The ideally straight “segment” which manifests the interference fringes, was particularly useful to identify, classify, quantify and reduce the various systematics on the ranging signal. It also allows to obtain the "synthetic wavelength" phase measurement 2π∆ /L Λwith an accuracy which is not limited by the long term phase drifts in the two microwave measurement chains. From the observed noise on the two-mode interference signal, we expect a resolution of about 20 pm on a 43 ms signal data set. The measurement update rate is currently ≈60 ms but, at least in principle, nothing prevents from achieving an update every 100 or 200µs with a resolution of about 100pm, provided commercial programmable circuits are powerful enough to complete the data processing required for the determination of the distance.
At the present time, this measurement scheme still has to improve the rejection of the systematics associated with the transient behaviour of the AM-to-PM coupling in the opto-microwave measurement chain. This electronic defect has to be corrected for, otherwise most of the time the procedure will converge to wrong distance values, offset by an integer number of timesλopt 2. The data processing required to correct for transient AM-to-PM effects adds significant complexity to the ranging procedure and introduces additional parameters, yet without completely solving the problem: at fast measurement rate, about 1 measurement out of 4 is wrong by ±λopt 2. The observation [13] that the bias voltage applied to the 20 GHz photodiodes is a critical parameter that governs the properties of the AM-to-PM coupling offers the perspective that this difficulty may be significantly reduced by an appropriate choice of Vbias. We are currently implementing this idea on the
set-up with the perspective that this difficulty may be significantly reduced, and that an instrument with performances similar to, or exceeding those of [5] or [7] can be implemented without the use of a frequency comb.
REFERENCES
[1] Estler W. T. et al., “Large-scale metrology-an update,” CIRP Annals., vol.51(2), pp. 587 –609, 2002
[2] H. Le Coroller, J. Dejonghe, C. Arpesella, D. Vernet, A. Labeyrie, “Tests with a Calina-type hypertelescope prototype”, Astron. & Astrophys, vol.426, pp. 721-728, 2004.
[3] M. Fridlund, "Future space missions to search for terrestrial planets", Space Sci. Rev., vol.135, pp. 355-369, 2008.
[4] C. Courde, M. Lintz, A. Brillet, “High accuracy laser telemetry. Towards sub-micron accuracy in the measurement of kilometer scale distances without interferometry”, Instrumentation, Mesures, Metrologie, vol.10, pp. 81-101, 2010.
[5] Y. Salvadé, N. Schuhler, S. Lévêque and S. Le Floch, “High-accuracy absolute distance measurement using frequency-comb referenced multiwavelength source”, Appl. Opt., vol.47, pp. 2715-2720, 2008. [6] O.P. Lay et al., “MSTAR: a sub-micrometer absolute metrology
system", Opt. Lett., vol. 28, pp 890-892 , 2003.
[7] I. Coddington, W.C. Swann, L. Nenadovic, N.R. Newbury, “Rapid and precise absolute distancemeasurements at long range”, Nature Photonics, vol.3, pp 351-356, 2009
[8] C. Dorrer, D.C. Kilper, H.R. Stuart, G. Raybon and M.G. Raymer, “Linear optical sampling” IEEE Photon. Technol. Lett., vol.15, 1746-1748, 2003.
[9] Etienne Samain, private communication.
[10] J. Fatome, et.al, “Multiple four-wave mixing in optical fibers: 1.5–3.4-THz femto second pulse sources and real-time monitoring of a 20-GHz picosecond source”, Opt. Com., vol .283, pp. 2425–2429, 2010. [11] J. E. Volder, "The CORDIC trigonometric computing technique," IRE
Transactions on Electronic Computers, vol.8, pp. 330-334, 1959. [12] Lévêque, A. Gauguet, W. Chaibi et Landragin A., “Low noise
amplification of an optically carried microwave signal: application to atom interferometry”, Applied Physic B, vol.101, pp 723-729, 2010 [13] D. H. Phung et al., “Dynamics of the Amplitude-to-Phase Coupling in
1.5 µm High Bandwidth Photodiodes”submitted to IEEE Trans. on Microwave Theory and Techniques
Annex: The two-mode interference signal in the presence of a stray optical beam
In the most general case, we suppose that the signal we detect is the interference of N optical beams, each beam being a two-mode beat-note according to:
(
)
( )(
)
(
)
1 l l l l i t c i t c i t i c i t c A e ω − +e ω δ+ − =Ae eω −ω +eδ − (A-1).More generally, (A-1) can be rewritten as iBm iCm
(
1 iDm)
m
A e e− +e , with m = 1 to N, and Bm =ω t, Cm=ωlm c, Dm =δ
(
t−lm c)
.(
)
1 1 m m m m N i iB iC iD m m E A eζ e e− e = =∑
+ , (A-2)one can calculate the intensity at the measurement photodiode:
(
)
1* 2
1 1 1
1 cos 2 cos cos cos
2 2 2 N N N m n m n m n m m m n m m n n m m n m D D D D D D EE A D A A B C B C − = = = + − + − = + + − − + + +
∑
∑ ∑
(A-3).Ideally, we only have two beams, with power fractions of 1−ε2 :ε2, that travel along the reference path of length l and measurement path of length L. If a stray beam (characterized by the beam path length lstray and the power fraction
2 2 2
1−ε :ε :εstray), also interferes, the high-frequency part of the intensity is the sum of six terms, out of which three are
interference terms.
In the complex plane, the vector that describes the microwave signal
(
)
(
)(
)
(
)
( )( )
(
)
(
)
( )( )
(
)
2 2 2 2 2 2 2 ( ) 1 2 1 cos 2 #1 2 1 cos 2 ( ) # 2 2 cos 2 stray stray i l c i L c i l c stray i L l c i L l c stray stray stray a t e e e c L l c e c L l c e c δ δ δ δ δ ε ε ε ε ε ω δ ε ε ω δ εε ω δ + + = − + + + − + − + − + − + + r(
)
( )2( )
( ) i l lstray c #3 stray l−l c eδ + (A-4)includes three interference "segment" terms. Beyond term #1, which corresponds to the main (ideal) segment, interference terms #2 and 3 add perturbations that may distort the segment. Term #2, for instance, can give rise
- to a tilt, or an elliptic distortion of the segment, if lstray <<Lor lstray ≈L
- to a bending of the segment, or figure 8 distortion, if L l− stray ≈ ×2 or (1/ 2)(L l− ) - to an S-shape distortion if L l− stray ≈ ×3 or (1/ 3)(L l− )
- …
Generally speaking, the classification of the Lissajoux curves is appropriate to describe the different types of possible distortions of the segment.