HAL Id: hal-00023855
https://hal-insu.archives-ouvertes.fr/hal-00023855
Submitted on 18 May 2006
HAL is a multi-disciplinary open access
archive for the deposit and dissemination of sci-entific research documents, whether they are pub-lished or not. The documents may come from teaching and research institutions in France or abroad, or from public or private research centers.
L’archive ouverte pluridisciplinaire HAL, est destinée au dépôt et à la diffusion de documents scientifiques de niveau recherche, publiés ou non, émanant des établissements d’enseignement et de recherche français ou étrangers, des laboratoires publics ou privés.
Change in the hydraulic properties of a Brazilian clay
Ferralsol on clearing for pasture.
Luíz Carlos Balbino, Ary Bruand, Isabelle Cousin, Michel Brossard, P.
Quétin, M. Grimaldi
To cite this version:
Luíz Carlos Balbino, Ary Bruand, Isabelle Cousin, Michel Brossard, P. Quétin, et al.. Change in the hydraulic properties of a Brazilian clay Ferralsol on clearing for pasture.. Geoderma, Elsevier, 2004, 120, pp.297-307. �10.1016/j.geoderma.2003.08.017�. �hal-00023855�
Change in the hydraulic properties of a Brazilian clay
Ferralsol on clearing for pasture
L. C. Balbinoa, b, A. Bruand c , I. Cousina, M. Brossardd, P. Quétina and M. Grimaldie
a INRA, Unité de Science du Sol, BP 20619, 45166 Olivet Cedex, France
b EMBRAPA Arroz e Feijão, CP 179, CEP 75.375-000 Santo Antonio de Goiás, GO, Brazil c ISTO, Université d'Orléans, Géosciences, BP 6759, 45067, Orléans Cedex 2, France d IRD/EMBRAPA Cerrados, CP 7091, 71619-970, Brasilia, DF, Brazil
e IRD/FCAP, CP 917, 66077-530, Bélem, PA, Brazil
Abstract
Ferralsols under native vegetation have a weak to moderate macrostructure and a well-developed microstructure corresponding to subrounded microaggregates that are usually 80 to 300 μm in size. The aim of this study was to analyze how the hydraulic properties of a clay Ferralsol were affected by a change of structure when the native vegetation is cleared for pasture. We studied the macrostructure in the field and microstructure in scanning electron microscopy. The water retention properties were determined by using pressure cell equipment. We determined the saturated hydraulic conductivity, Ks, by applying a constant
hydraulic head to saturated core samples, and the unsaturated hydraulic conductivity, K(Ψ), by applying the evaporation method to undisturbed core samples. Results showed a significant decrease in the water retained at −1 and −10 hPa from 0- to 40-cm-depth when the native vegetation is cleared for pasture. That decrease in the water retained was related to a smaller development of microaggregation and greater proportion of microaggregates in close packing. For smaller water potential, there was no difference of water retained at every depth between native vegetation and pasture. Pedotransfer functions established earlier for Brazilian Ferralsols and using clay content as single predictor gave pretty good results but the precision of the estimation decreased when the water potential increased. This decrease in the precision was related to the lack of predictor taking structure into account. Ks and K(Ψ) showed an
upward trend with depth under native vegetation and pasture. Except at 0–7-cm depth between the Brachiaria clumps in the pasture where smaller Ks and K(Ψ) than at the other
depth was recorded whatever land use, we did not record any significant difference of Ks and
K(Ψ) at every depth between native vegetation and pasture. The upward trend shown by the hydraulic conductivity with depth was related to the increase in the development of microaggregation with depth.
Author Keywords: Structure; Bulk density; Microaggregate; Hydraulic conductivity; Water
retention; Pedotransfer function
1. Introduction
Ferralsols (ISSS Working Group R.B., 1998) that correlate to Latosols of the Brazilian soil classification (EMBRAPA, 1999) show little or no distinct horizonation and their macrostructure is weak to moderate. On the other hand, Ferralsols have typically a strong microstructure (Neufeldt et al., 1999 and Westerhof et al., 1999). Microaggregates are near spherical ranging from 80 to 300 μm in size usually. They correspond to the ‘pseudosand’, ‘micropeds’, ‘granules’ described earlier by Kubiena (1950), Brewer (1964) and Trapnell and
Webster (1986), respectively. Thus, Ferralsols porosity is closely related to the arrangement of microaggregates and the packing of clay particles within the microaggregates with a contribution of large pores resulting from biological activity.
The large biological pores and the pores that result from the arrangement of the microaggregates are preferentially affected by compaction when the soil is cleared and then cultivated (Stoner et al., 1991). Several studies showed that other pores than large biological pores alone are affected when the land is cleared for cultivation. Hartmann (1991) showed in Ivory Coast that microaggregation was affected by fertilization practices that induced kaolinite dispersion and consequently a collapse of the microaggregates. Chauvel et al. (1991) showed that after native Amazonian forest clearing, the packing of kaolinite particles within the microaggregates was affected by roots suction of the leguminous cropped. After cultivation, Tavares Filho (1995) and Assouline et al. (1997) recorded a decrease in the porosity that resulted from a change of the microaggregate arrangement both in the topsoil and subsoil. More recently, Balbino et al. (2001) studied Brasilian Ferralsols and showed a dramatic decrease in the porosity after 10 years of pasture but unlike Chauvel et al. (1991), they did not record any variation of the porosity within the microaggregates.
On the other hand, several authors studied the water retention properties (see Balbino et al., 2002a and Balbino et al., 2002b), the saturated hydraulic conductivity (e.g. Stone et al., 1994; Volpe, 1998; Ferreira et al., 1999 and Beutler et al., 2001 and the unsaturated hydraulic conductivity (Stone and Silveira, 1978 and Frizzone and Sobrinho, 1982) of Brazilian Ferralsols but most studies did not associated any detailed description of the structure. The aim of this study is to analyze how the hydraulic properties of a clayey Brazilian Ferralsol are affected when the land is cleared for pasture and to discuss the results in relation to structure.
2. Materials and methods
2.1. The soils
The soils studied are located 30 km North of Planaltina de Goiás in the state of Goiás (15°14′S, 47°42′W) in the Brazilian Savannah biome. These soils had a clay texture (Table 1) and showed little horizonation, no macrostructure and a strong microstructure with near-spherical microaggregates (Balbino et al., 2001). They are Latossolo Vermelho according to the Brazilian classification (EMBRAPA, 1999), Ferralsols according to the ISSS Working Group R.B. (1998). The elevation is 825 m. The climate is characterized by distinct wet and dry seasons, 80% to 90% of the annual rainfall occurring between October and April (Assad et al., 1993). Mean annual rainfall ranges from 1100 to 1200 mm with 4 to 6 months with no rain. The soils developed in fine textured and deeply weathered Meso-neoproterozoic metasedimentary rocks (Paranoá Group) that inherited from the erosion of Precambrian materials (Dardenne and Faria, 1986).
Table 1. Physical and chemical characteristics of the soils studied
The soil under two land uses was studied: (i) under a native vegetation which is a cerrado sensu stricto consisting of the association of tree and shrub species with the development of an herbaceous strata during the wet season (Ribeiro and Walter, 1998) and (ii) under a low productivity pasture sowed in 1990 with Brachiaria brizantha cv. Marandú after clearing the native vegetation in 1989 and lime application at the surface.
2.2. Sampling and methods
Because of the very small cohesion of the soil, undisturbed samples were collected by using copper cylinders 13.8 cm3 in volume to investigate the water retention according to the water potential (Ψ, in hPa) at 0–3, 3–6, 25–32, 33–40 cm where differences of structures were shown by Balbino et al. (2002b) between the soil under native vegetation and the one under pasture. As no difference of structure was recorded by Balbino et al. (2002b) from 50- to 130-cm depth, we collected other undisturbed samples in the same way at 90–97-130-cm depth. Water content at −10, −33, −100, −330, −1000 and −15 000 hPa was measured using pressure apparatus. The samples were placed still in their cylinder on a paste made of <2-μm particles of kaolinite to establish continuity of water between the soils material and the membrane or the porous plate of the apparatus (Bruand et al., 1996). The paste enabled the rewet of the samples by capillarity until equilibrium was reached prior applying the pressure. In that state, the samples were considered as being in equilibrium with Ψ=−1 hPa. The water content (W, in g g−1) was expressed with respect to the dry mass of the sample after oven-drying at 105 °C for 24 h. Six samples were used to determine the mean water content at every water potential.
Other undisturbed samples 7×5×10 cm3 in volume were collected at 0–7-, 25–32-, 33–40- and 90–97-cm depth and impregnated with a polyester resin that was diluted with styrene monomer. Thin sections 4.5×6 cm2 were produced and polished with diamond grains of decreasing size (FitzPatrick, 1984). They were coated with carbon prior examination in scanning electron microscopy using the backscattered electron mode.
The saturated hydraulic conductivity (Ks) was determined on samples collected in duplicate at
0–7-, 25–32-, 33–40- and 90–97-cm depth with cylinders 929 cm3 in volume (H7 cm, 13 cm) except under pasture at 0–7-cm depth where four samples were collected because of structure variation due to the presence of Brachiaria clumps. After saturation, the samples were submitted to a constant hydraulic head gradient in a column maintained at a temperature of 20 °C. The water flow was per ascensum with the sample turned upside down. Ks was
determined by using five different hydraulic head gradients, the volume of water passed throughout the sample being measured after 2 h at every head gradient applied. The unsaturated hydraulic was determined by applying the Wind (1968) evaporation method to undisturbed samples 1236 cm3 in volume (H7 cm, 15 cm). The samples were collected at the same depth than for Ks determination and with similar number of replicates. They were
saturated in the same way than for Ks determination (Wendroth et al., 1993 and Tamari et al.,
1993). The mathematical procedures used to calculate K from Darcy's law, and the procedure used to fit Van Genuchten (1980) model are described in the work of Mohrath et al. (1997). According to the experimental conditions, K(Ψ) was established for −900≤Ψ≤−50 hPa. The soil contained in the cylinders used for saturated and unsaturated hydraulic conductivity measurements was oven dried at 105 °C for 24 h to calculate the bulk density (Db) for every
cylinder.
3. Results
3.1. Structure description in the field
The soil under the native vegetation showed a well-developed crumb macrostructure from 0- to 7-cm depth, a moderate to weak crumb macrostructure from 7 to 20 cm, a weak medium polyedral macrostructure from 20- to 40-cm depth and no macrostructure from 40- to 100-cm depth with numerous large channels and chambers resulting from termite activity. Microaggregates were observed in the first 30 cm located in biological channels and vughs. Deeper in the soil, microaggregation was generalised with well-developed sub-millimetric near-spherical microaggregates. Under the pasture, the soil showed a sealed surface between the Brachiaria clumps and moderate horizontal platy structure from 0- to 3-cm depth, a small to medium well blocky structure from 3- to 18-cm depth, a weak subangular blocky macrostructure from 18- to 46-cm depth and no macrostructure from 46- to 100-cm depth. Microaggregation was much less developed than under native vegetation in the first top 50 cm and located mainly in biological channels and vughs. Deeper in the soil, microaggregation was generalised as it was under native vegetation with numerous large channels and chambers resulting from termite activity.
3.2. Scanning electron microscopy
Under native vegetation, backscattered electron scanning images (BESI) showed at 0–7-, 25– 32- and 33–40-cm depth dense areas with closely packed microaggregates 50 to 300 μm in diameter associated to other areas with similar microaggregates in loose packing (Fig. 1A).
The proportion of the two types of areas appeared to be similar from 0- to 40-cm depth. At 90–97-cm depth, BESI showed a loose packing of microaggregates 50–300 μm in diameter (Fig. 1B) and locally a few areas with similar microaggregates in close packing. Under Pasture, BESI showed fluffy microaggregates 500–2000 μm in diameter in a close packing at 0–10-cm depth (Fig. 1c). Deeper in the soil, BESI showed a microstructure similar to the microstructure recorded under native vegetation but with a greater proportion of dense areas with microaggregates 50–300 μm in diameter closely packed (Fig. 1d). At 33–40-cm depth, about three quarters of the surface area of the thin section corresponded to these dense areas.
Fig. 1. Backscattered electron scanning images from the thin sections showing microaggregates 50–300 μm in diameter in different packing at 33–40 cm depth under native vegetation (a), microaggregates 50–300 μm in diameter in a loose packing at 90–97 cm depth under native vegetation (b), microaggregates 500–2000 μm in diameter grouped together at 0–7 cm depth under pasture (c) and microaggregates 50–300 μm in diameter closely packed at 33–40 cm depth under pasture (d). The black areas are voids occupied by resin, the light grey areas are quartz and the heterogeneous dark areas correspond to clay particles (scale bar: 500 μm).
3.3. Water retention properties using the pressure apparatus
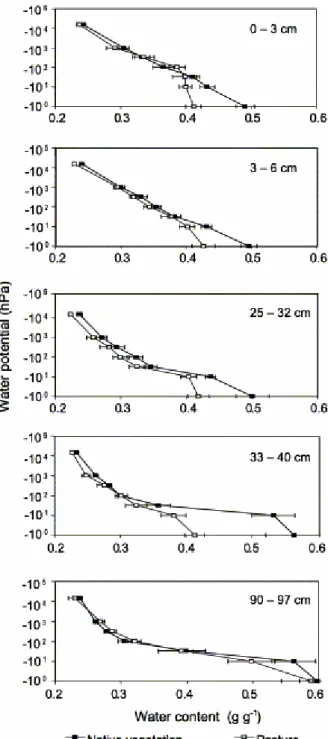
Water contents at the water potential studied are shown in Fig. 2. At −1 hPa, the soil under native vegetation retained much more water than the soil under pasture from 0- to 40-cm depth (Fig. 2). At −10 hPa, the soil under native vegetation still retained more water than under pasture from 0- to 32-cm depth but the difference of water retained was smaller than at −1 hPa. At 33–40-cm depth, the difference of water retained was similar to the one recorded at −10 hPa. Then at smaller water potential, the soil under native vegetation and pasture
showed similar water retention properties. At 90–100-cm depth, the water contents were similar under native vegetation and pasture.
Fig. 2. Water retention properties measured using the small undisturbed samples collected under native vegetation and pasture (horizontal area±standard deviation).
3.4. Saturated and unsaturated hydraulic conductivity
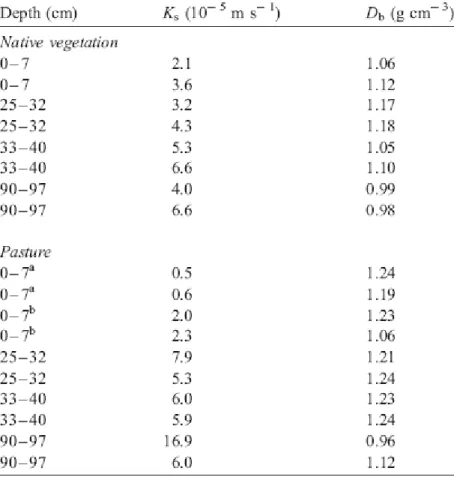
The saturated hydraulic conductivity (Ks) ranged from 2.1×10⁻⁵ to 6.6×10⁻⁵ m s−1 under
native vegetation and from 0.6×10⁻⁵ to 16.9×10⁻⁵ m s−1 under pasture (Table 2). Under native vegetation, Ks significantly increased from 0–7-cm depth to 33–40-cm depth, then there was
no significant difference (P=0.95) at 33–40- and 90–97-cm depth. Under pasture, the smallest Ks was recorded at 0–7-cm depth (0.5–0.6×10⁻⁵ m s−1). Between the Brachiaria clumps, Ks
was smaller than under the clumps (2.0×10⁻⁵–2.3×10⁻⁵ m s−1). Deeper in the soil, K s was
significantly greater (P=0.95) than at 0–7-cm depth between the Brachiaria clumps but it was not significantly different at every depth because of the variability between replicates.
Table 2. Saturated hydraulic conductivity (Ks) and bulk density (Db)
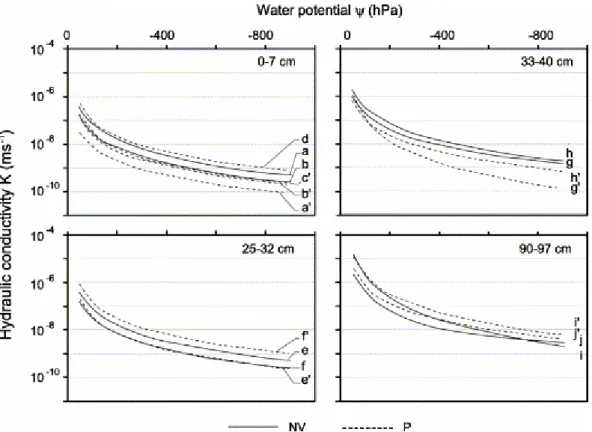
The K(Ψ) curves are shown in Fig. 3 and the parameters of the Van Genuchten (1980) model that were calculated are given in Table 3. As a whole, the curves are similar at every depth between the two land uses because of the great variability of the individual calculated values of K(Ψ) around the mean curve that are shown in Fig. 3. We also calculated K at −50 and −900 hPa that were approximately the maximum and the minimum Ψ for most samples (Table 4). For Ψ=−50 hPa, K ranged from 0.3×10⁻⁷ to 103.1×10⁻⁷ m s−1 and for Ψ=−900 hPa, from 0.9×10⁻¹⁰ to 65.2×10⁻¹⁰ m s−1. At −50 and −900 hPa, K showed an upward trend from 0–7- to 90–97-cm depth under native vegetation and pasture. At every depth, the value of K can be considered as similar under native vegetation and pasture because of the great variability between replicates.
Fig. 3. Hydraulic conductivity, K(Ψ), determined by using the evaporation method on core samples from the soil under native vegetation and under Pasture. (a, b,…, i′ and j′ see Table 3).
aBulk density. - bSaturated water contents used here as fitting parameters. - cResidual water contents used here as
fitting parameters. - d,eAre empirical fitting parameters. - fSaturated hydraulic conductivity calculated for Ψ=0. - gBetween Brachiaria clumps. - hUnder Brachiaria clumps.
Table 3. Parameters of the Van Genuchten (1980) model for the K(Ψ) curves (letters in parentheses enable samples identification, see Fig. 3)
Table 4. Hydraulic conductivity (K) calculated for −50 and −900 hPa (letters in parentheses enable samples identifications, see Table 3 and Fig. 3)
3.5. Bulk density
The values of Db measured with 929 cm3 cylinders showed that under native vegetation, Db
roughly increased from 0–7-cm depth (1.06–1.12 g cm−3) to 25–32-cm depth (1.17–1.18 g cm−3), then decreased to 90–97-cm depth (0.99–0.98 g cm−3) (Table 2). Under pasture, Db was
variable at 0–7-cm depth (1.06–1.24 g cm−3). The smallest D
b was recorded at 90–97-cm
depth. When we compare the soil under native vegetation and under pasture, Db were greater
under pasture than under vegetation at 0–7- and 33–40-cm depth. On the other hand, the values of Db measured with 1236-cm3 cylinders showed that under native vegetation, there
was small variation of Db from the surface to 90–97-cm depth (0.99–1.02 g cm−3) (Table 3).
Under pasture, Db was greater than under native vegetation. The greatest Db was measured in
the 0–7-cm layer (1.28 g cm−3) but that layer showed a Db highly variable. If we except the
1.28 g cm−3 that was recorded in the 0–7-cm layer, Db was great at 25–32-cm depth (1.20–
1.24 g cm−3) with close values at 33–40-cm depth (1.14–1.23 g cm−3) and the smaller values at 90–97-cm depth (1.10–1.02 g cm−3).
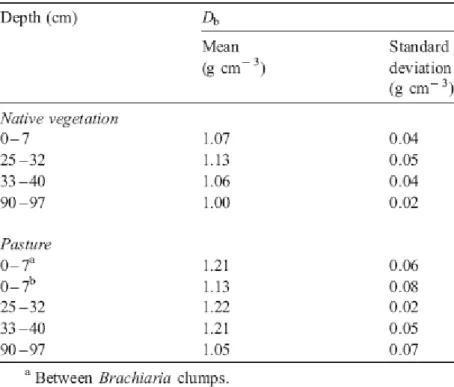
The mean Db was calculated at every depth under native vegetation and pasture using the
whole set of data (Table 5). Results clearly showed that Db at 0–7-cm depth was smaller under
difference (P=0.95) with Db under the clumps. At 23–32- and 33–40-cm depth, Db was
significantly smaller (P=0.95) under native vegetation than under pasture. At 90–97-cm depth, results showed no significant difference (P=0.95) between native vegetation and pasture.
Table 5. Mean bulk densities (Db) measured with the 929- and 1236-cm3 cylinders
4. Discussion
4.1. Water retention and land use
Comparison of the water retention between the two land uses showed that the amount of water retained at −1 and 10 hPa was smaller under pasture than under native vegetation from 0- to 40-cm depth (Fig. 2). Such a difference of the water retention properties is explained by the difference of structure between the two land uses. Indeed, field descriptions and observations in microscopy showed that (i) the microstructure was less developed under pasture than under native vegetation and (ii) the proportion of microaggregates in close packing was greater under pasture than under native vegetation (Fig. 1). Thus, the smaller volume of pores that results from that change of structure is responsible for the difference of water retained at −1 and −10 hPa between native vegetation and pasture. The variation of structure was also consistent with the difference of Db recorded (Table 5), a decrease in Db corresponding to an
increase in the microaggregation development. For Ψ≤−33 hPa, there was no significant (P=0.95) difference of water retained at 0–3-, 3–6-, 25–32- and 33–40-cm depth, thus showing that the difference of microstructure recorded between native vegetation and pasture did not have any measurable consequence on the water retention properties. Finally, at 90–97-cm depth, there was no significant difference (P=0.95) of water content for −15 000≤Ψ≤−1
hPa. This was consistent with the lack of difference of structure and bulk density at that depth between the two land uses (Table 5).
4.2. Prediction of the water retention properties and variation of structure
Using data from the literature and considering that differences of structure were very small between Ferralsols, Balbino et al. (2002a) established pedotransfer functions for Ferralsols from the Brazilian Savannah zone between the gravimetric water content (W) at −15 000, −330 and −100 hPa and the clay content (% clay) alone:
W=0.287 (%clay)+1.4 at Ψ=−15,000 hPa
W=0.330 (%clay)+5.8 at Ψ=−330 hPa
W=0.331 (%clay)+8.3 at Ψ=−100 hPa
We discussed the validity of these pedotransfer function using our results. We calculated the mean error of prediction (MEP) and the standard deviation of prediction (SDP) as follows (Wösten et al., 2001):
where Wm is the measured gravimetric water content, Wp is the predicted gravimetric water
content and n is the number of horizons (n=11). The sign of MEP indicates whether the pedotransfer function overestimated (negative) or underestimated (positive) the water content, whereas SDP measures the precision of the predictions. Results gave MEP=0.008, −0.001 and −0.002 g g−1 at water potentials of −15 000, −330 and −100 hPa, respectively this indicating very small underestimation at −15 000 hPa and very small overestimation at −330 and −100 hPa. Results gave SDP=0.011, 0.025 and 0.031 g g−1 at −15 000, −330 and −100 hPa, respectively. The decrease in the precision when Ψ increases would be related to a variation of the water retained because of the change of structure that was recorded on clearing for pasture. This points out the necessity to take parameters describing soil structure as predictor even for soils that show little difference of structure in the field.
4.3. Saturated and unsaturated hydraulic conductivity
The smallest Ks and K at −50 and −900 hPa were recorded under pasture at 0–7-cm depth
between the Brachiaria clumps. These value of Ks and K were related to the seal surface and
the horizontal platy structure, as well as the close packing of the microaggregates (Fig. 1c). At 0–7-cm depth under Brachiaria clumps and at the other depths, there was no significant difference (P=0.95) of Ks between the soil under pasture and the soil under native vegetation
(Table 3). This lack of difference when variation of microaggregate packing was recorded with depth and land use might be related to the contribution of the biological pores to water flow. At −50 and −900 hPa, the greatest K was recorded at 90–97-cm depth under pasture and
native vegetation (Table 4). This value of K would be related to the greater development of microaggregation recorded at 90–97-cm depth (Fig. 1).
5. Conclusion
Our results showed that clearing the native vegetation for pasture led to a significant change of the structure for the clay Ferralsol studied. That change consisted of a decrease in the microaggregation development and a close arrangement of the microaggregates remaining that was particularly visible at 33–40-cm depth under pasture. That evolution of the structure shown in the field and in microscopy was consistent with the bulk densities recorded at every depth under native vegetation and pasture. That evolution of the structure led to a decrease in the water retained at −1 and −10 hPa from 0- to 40-cm depth under pasture. The greatest difference of water retained between native vegetation and pasture was recorded at 33–40-cm depth where a much greater proportion of areas with microaggregates in close packing was recorded under pasture. For smaller water potential, we did not record any difference of water retained at every depth between native vegetation and pasture. The pedotransfer functions proposed for Brazilian Ferralsols and established with the clay content as single predictor gave pretty good results but the precision of the estimation decreased when the water potential increased. This decrease in the precision was related to the lack of predictor taking structure into account. The values of Ks and K(Ψ) showed an upward trend with depth under native
vegetation and pasture. Except at 0–7-cm depth between the Brachiaria clumps in the pasture where smaller Ks and K(Ψ) than at the other depth was recorded whatever land use, we did not
record any significant difference of Ks and K(Ψ) at every depth between native vegetation and
pasture. The upward trend shown by the hydraulic conductivity with depth was related to the increase in the development of microaggregation with depth.
Acknowledgements
We thank the Empresa Brasileira de Pesquisa Agropecuária (EMBRAPA), the Institut National de la Recherche Agronomique (INRA) and the Institut de Recherche pour le Développement (IRD) for their financial support of the L.C. Balbino's work in France. We thank also Hervé Gaillard, Laurent Raison, Loïc Prud'homme, and Sacha Desbourdes (INRA Orléans) for their help in the laboratory and Sebastião Araujo (EMBRAPA Arroz e Feijão).
References
1. Assad, E.D., Sano, E.E., Masutomo, R., Castro, L.H.R. and Silva, F.A.M., 1993. Veranicos na região dos cerrados brasileiros: freqüência e probabilidade de ocorrência. Pesquisa Agropecuária Brasileira 28, pp. 993–1002.
2. Assouline, S., Tavares-Filho, J. and Tessier, D., 1997. Effect of compaction on soil physical and hydraulic properties: experimental results and modeling. Soil Science Society of America Journal 61, pp. 390–398.
3. Balbino, L.C., Bruand, A., Brossard, M. and Guimarães, M.F., 2001. Comportement de la phase argileuse lors de la dessiccation dans des Ferralsols microagrégés du Brésil : rôle de la microstructure et de la matière organique. Comptes Rendus de l'Académie des Sciences 332, pp. 673–680.
4. Balbino, L.C., Brossard, M., Leprun, J.C. and Bruand, A., 2002. Mise en valeur des Ferralsols de la région du Cerrado (Brésil) et évolution de leurs propriétés physiques: une étude bibliographique. Etude et Gestion des Sols 9, pp. 83–104.
5. Balbino, L.C., Bruand, A., Brossard, M., Grimaldi, M., Hajnos, M. and Guimarães, M.F., 2002. Changes in porosity and microaggregation in clayey Ferralsols of the Brazilian Cerrado on clearing for pasture. European Journal of Soil Science 53, pp. 219–230.
6. Beutler, A.N., Silva, M.L.N., Curi, N., Ferreira, M.M., Cruz, J.C. and Pereira Filho, I.A., 2001. Resistência à penetração e permeabilidade de Latossolo-vermelho distrófico típico sob sistema de manejo na região dos Cerrados. Revista Brasileira de Ciência do Solo 25, pp. 167–177.
7. Brewer, R., 1964. Fabric and Mineral Analysis of Soils. , Wiley, New York.
8. Bruand, A., Duval, O., Gaillard, H., Darthout, R. and Jamagne, M., 1996. Variabilité des propriétés de rétention en eau des sols: importance de la densité apparente. Etude et Gestion des Sols 3, pp. 27–40.
9. Chauvel, A., Grimaldi, M. and Tessier, D., 1991. Changes in soil pore-space distribution following deforestation and revegetation: an example from the Central Amazon Basin, Brazil. Forest Ecology and Management 38, pp. 259–271.
10. Dardenne, M.A. and Faria, A., 1986. Estratigrafia do Grupo Paranoá na Região do Alto Paraíso-GO. In: 2nd Simpósio de geologia do Centro-Oeste. Geologia do pré-Cambiano, Ata, 28 a 31 de maio de 1985, Universidade Federal de Gois Goiânia-GO, pp. 65–71.
11. EMBRAPA, 1999. Centro Nacional de Pesquisa de solos (Rio de Janeiro, RJ). Sistema brasileiro de classificação de solos. Embrapa Produção de Informação, Embrapa Solos, Brasília, DF.
12. Ferreira, M.M., Fernandes, B. and Curi, N., 1999. Influência da mineralogia da fração argila nas propriedades fisica de latossolos da região sudeste do Brasil. Revista Brasileira de Ciência do Solo 23, pp. 515–524.
13. FitzPatrick, E.A., 1984. Micromorphology of Soils. , Chapman & Hall, London.
14. Frizzone, J.A. and Sobrinho, F.C., 1982. Condutividade hidraulica de um solo de cerrado não saturado Latossolo-vermelho escura alico. Cientifica 10, pp. 49–56.
15. Hartmann, C., 1991. Evolution et comportement de sols sablo-argileux ferrallitiques sous culture de palmiers à huile: Cas de la plantation R. Michaux à Dabou (Côte d'Ivoire). Thèse de doctorat, Université de Paris VI.
16. ISSS Working Group R.B., 1998. World reference base for soil resources: introduction. In: , Deckers, J.A., Nachtergaele, F.O. and Spaargaren, O.C., Editors, 1998. International Society of Soil Science (ISSS) (1st ed.), ISRIC-FAO-ISSS-Acco., Leuven 84 p. .
17. Kubiena, M.L., 1950. Zur micromorphologie der braunen and roten tropenboden. In: Transactions of the 4th International Congress of Soil Science, Amsterdam vol. 1, pp. 304–307.
18. Mohrath, D., Bertuzzi, P. and Bruckler, L., 1997. Méthode de Wind, Guide d'utilisation du logiciel, Version. , INRA, Avignon.
19. Neufeldt, H., Ayarza, M.A., Resk, D.V.S. and Zech, W., 1999. Distribution of water-stable aggregates and aggregating agents in Cerrado Oxisols. Geoderma 93, pp. 85– 99.
20. Ribeiro, J.F. and Walter, B.M.T., 1998. Fitofisionomias do bioma Cerrado. In: Sano, S.M. and de Almeida, S.P., Editors, 1998. Cerrado: ambiente E flora, Embrapa CPAC, Planaltina, DF, pp. 89–166.
21. Stone, L.F. and Silveira, P.M., 1978. Condutividade hidráulica de um Latossolo vermelho-amarelo. Pesquisa Agropecuaria Brasileira 35, pp. 1817–1834.
22. Stone, L.F., Silveira, P.M. and Zimmermann, F.J.P., 1994. Caracteristicas físico-hídrícas e quimicas de um latossolo após adubação e cultivos sucessivos de arroz e
feijão, sob irrigaçao por aspersão. Revista Brasileira de Ciencia do Solo 18, pp. 533– 539.
23. Stoner, E.R., Freitas, E., Macedo, J., Mendes, R.C.A, Cardoso, I.M., Amabile, R.F. and Bryant, R.B., 1991. Physical constraints to root growth in savanna Oxisols. In: TropSoils, Bulletin No 91-01, North Carolina State University, Raleigh 28 p. .
24. Tamari, S., Bruckler, L., Halbertsma, J. and Chadoeuf, J., 1993. A simple method for determining soil hydraulic conductivity in the laboratory. Soil Science Society of America Journal 57, pp. 642–651.
25. Tavares Filho, J. 1995. Organisation et comportement de Latosols du Paraná (Brésil). Influence de leur mise en culture. Thèse de Doctorat, Université de Nancy I.
26. Trapnell, C.G. and Webster, R., 1986. Microaggregates in red earths and related soils in East and Central Africa, their classification and occurrence. Journal of Soil Science
37, pp. 109–123.
27. Van Genuchten, M.Th., 1980. A closed-form equation for predicting the hydraulic conductivity of unsaturated soils. Soil Science Society of America Journal 44, pp. 892– 898.
28. Volpe, E., 1998. Sistemas de recuperação direta de Brachiaria decumbens cv. Basilisk, em Latossolo Vermelho-escuro, na região do Cerrados. Dissertaçao de Mestrado. Universidade Federal do Mato Grosso do Sul. 126 p.
29. Wendroth, O., Ehlers, W., Hopmans, J.W., Kage, H., Halbertsma, J. and Wösten, J.H.M., 1993. Reevaluation of the evaporation method for determining hydraulic functions in unsaturated soils. Soil Science Society of America Journal 57, pp. 1436– 1443.
30. Westerhof, R., Buurman, P., Van Griethuysen, C., Ayarza, M., Vilela, L. and Zech, W., 1999. Aggregation studied by diffraction in relation to plowing and liming in the Cerrado region in Brazil. Geoderma 90, pp. 277–290.
31. Wind, G.P., 1968. Capillary conductivity data estimated by a simple method. In: Rijitema, P.E. and Wassink, H., Editors, 1968. Water in the Insaturated ZoneProc.Wageningen Symp. June 1966 vol. 1, IASAH, Gentbrugge, pp. 181–191. 32. Wösten, J.H.M., Pachepsky, Y.A. and Rawls, W.J., 2001. Pedotransfer functions:
bridging the gap between available basic soil data and missing soil hydraulic characteristics. Journal of Hydrology 251, pp. 123–150.