HAL Id: hal-01790809
https://hal.archives-ouvertes.fr/hal-01790809
Submitted on 3 Aug 2020
HAL is a multi-disciplinary open access
archive for the deposit and dissemination of
sci-entific research documents, whether they are
pub-lished or not. The documents may come from
teaching and research institutions in France or
abroad, or from public or private research centers.
L’archive ouverte pluridisciplinaire HAL, est
destinée au dépôt et à la diffusion de documents
scientifiques de niveau recherche, publiés ou non,
émanant des établissements d’enseignement et de
recherche français ou étrangers, des laboratoires
publics ou privés.
from the Oligotrophic to the Ultraoligotrophic
Mediterranean (BOUM cruise)
T. Moutin, L. Prieur
To cite this version:
T. Moutin, L. Prieur. Influence of anticyclonic eddies on the Biogeochemistry from the Oligotrophic to
the Ultraoligotrophic Mediterranean (BOUM cruise). Biogeosciences, European Geosciences Union,
2012, 9 (10), pp.3827 - 3855. �10.5194/bg-9-3827-2012�. �hal-01790809�
www.biogeosciences.net/9/3827/2012/ doi:10.5194/bg-9-3827-2012
© Author(s) 2012. CC Attribution 3.0 License.
Biogeosciences
Influence of anticyclonic eddies on the Biogeochemistry from the
Oligotrophic to the Ultraoligotrophic Mediterranean
(BOUM cruise)
T. Moutin1and L. Prieur2
1Aix-Marseille Universit´e, Universit´e du Sud Toulon-Var, CNRS/INSU, UMR 6535, IRD, Mediterranean Institute of
Oceanography MIO, UM 110, 13288, Marseille, Cedex 09, France
2Laboratoire d’Oc´eanographie de Villefranche, CNRS/INSU UMR 7093, Universit´e Pierre et Marie Curie, Observatoire
Oc´eanologique de Villefranche, Villefranche sur mer, France
Correspondence to: T. Moutin (thierry.moutin@univ-amu.fr)
Received: 1 August 2011 – Published in Biogeosciences Discuss.: 10 August 2011 Revised: 20 July 2012 – Accepted: 10 August 2012 – Published: 8 October 2012
Abstract. We studied a longitudinal transect in the Mediter-ranean Sea (MS) and along this transect, the influence of an-ticyclonic eddies at three long duration (LD) stations. The deep chlorophyll maximum depth, the euphotic layer depth and the top of the nitracline depth are clearly correlated out-side of the eddies, and deepen from the oligotrophic western to the ultraoligotrophic eastern MS. We provide evidence that the locations of the three LD stations studied were near the axis of the eddies. Their diameters were close to 100 km and the studied areas were less than 10 km from the centre of the eddies. The positions of the LD stations are marked by an increase in the flux function and a decrease in apparent oxy-gen utilization (AOU) and in excess density (σ ), as expected for anticyclonic eddies. Integrated mean primary production measured in situ inside the three studied eddies confirms the previous conclusion that integrated primary production
(IPP) about 150 mgC m−2d−1 may appear as a lower limit
for IPP during strong oligotrophic conditions. The mesoscale activity is strong enough to locally modify the very well-documented western-to-eastern gradient of trophic condi-tions in the MS. We proposed a new calculation for mixed layer depths (MLDs) enabling the determination of MLD to take into consideration processes occurring with time scales ranging from a few hours to several days, and also the win-ter MLD. Studying the main physical, chemical and dynam-ical characteristics of the three eddies enables us to consider that the vorticity barrier prevents any strong mixing and ad-vection of outer water inside the eddy and explains why the depth range of eddies starts from the surface. As a first
ap-proximation, the anticyclonic eddies could be considered as closed systems dating back to the previous winter, making possible to draw first-order budgets. The daily new N-input in the photic zone is virtually identical to the N-export mea-sured at 230 m by drifting traps. This means that the eddies are close to an equilibrium state where input is equal to loss. The annual N-input by winter convection, which is a fun-damental criterion for new nutrient availability, may be ex-tremely variable inside eddies, with W-MLD varying from 90.5 m at the western station to 396.5 m at the eastern sta-tion. W-MLDs are always deeper inside the eddies than out-side where they are in keeping with climatological averages. AOU was low inside the eddies; this together with the near-identical export measured at 230 and 460 m seems to indicate that eddy cores are areas where low mineralisation of particu-late organic matter occurs. “In” and “out” AOU comparisons indicate lower mineralisation inside the eddies suggesting a
higher efficiency for CO2sequestration via sedimentation of
particulate organic matter. The three eddies are enriched in
dissolved organic carbon (DOC). Sequestration of CO2 by
vertical export of accumulated DOC therefore seems to be higher inside eddies. The relative importance of DOC trans-port in the biological pump is probably one of the main char-acteristics of low-P low chlorophyll (LPLC) areas, and it is likely to be reinforced inside anticyclonic eddies. The nu-merous anticyclonic eddies in the MS are likely to influence the water masses and their dispersion, and therefore have a strong impact on the biogeochemical properties at the scale of the MS.
1 Introduction
The MS is a semi-enclosed sea with the general circulation resulting in a westward–eastward gradient of nutrient avail-ability in the upper layer (McGill, 1961; Moutin and Raim-bault, 2002) therefore producing a large range of trophic con-ditions. It is also a sea with intense mesoscale activity, as shown by the numerous “quasi”-permanent anticyclonic ed-dies encountered (Puillat et al., 2002, Taupier-Letage, 2008). Such physical structures are known to play a significant role in the biogeochemistry of the sea, although the integrated im-pact of these intermittent events is debated (Jenkins et al., 2008; Ledwell et al., 2008). It is therefore of great interest to study how such mesoscale structures may modify the well-documented gradients in the Mediterranean Sea.
The oligotrophy in the western basin and the ultraoligotro-phy in the eastern basin of the MS are principally the re-sult of small loads and unusual anti-estuarine circulation, in which nutrients are net exported from the basins at the straits, namely of Gibraltar and of Sicily, respectively (Sarmiento et al., 1988; Stratford et al., 2000). A major role of the biologi-cal pump has been suggested for the long-term maintenance of these gradients (Crispi et al., 2001). The MS is also char-acterized by a high N:P ratio in both the mineral and organic pools (Mc Gill, 1961, 1965; Coste et al., 1984; Raimbault and Coste, 1990; Moutin and Raimbault, 2002), which are higher in the eastern than in the western basin (Krom et al., 1991). Three fundamentally different processes have been proposed to explain the typical N:P ratios in the MS. Firstly, there is
the biological process of nitrogen (N2)fixation (Bethoux and
Copin-Montegut, 1986; Bonin et al., 1989; Sachs and Repeta, 1999; Kerherv´e et al., 2001; Pantoja et al., 2002) which may lead to nitrogen accumulation; however, recently acquired data indicate very low nitrogen fixation rates (Ibello et al., 2010; Yogev et al., 2011; Bonnet et al., 2011). Secondly, there is the chemical process of phosphate adsorption onto iron-rich particles which leads to further P-depletion in the Mediterranean Sea (Krom et al., 1991); however, it has been demonstrated that phosphate removal by adsorption from the water column does not represent a significant enough sink for phosphate in the MS to explain the high N:P ratios (Pan et al., 2002; Ridame et al., 2003). The third explanation is that high N:P values are derived from the external nutrient inputs coupled with the very low denitrification rates linked with the oligotrophic status of the MS (Krom et al., 2010).
Fluxes of nutrients from depth are essential to sustain phy-toplankton productivity in the euphotic zone of the olig-otrophic ocean, yet the mechanisms regulating those fluxes remain enigmatic (Ledwell et al., 2008). It was recently demonstrated that mesoscale activities may provide ecologi-cal niches explaining the distribution of specific planktonic species (D’Ovidio et al., 2010) and that this scale should be taken into account in the global biogeochemical budget (Benitez-Nelson and McGuillicuddy, 2008; L´evy, 2008). Be-cause of their relatively simple physical structure,
anticy-clonic eddies have been well studied and their biogeochem-ical role has principally been considered to be that of wa-ter isolation giving rise to more oligotrophic conditions in-side the eddies (Chapman and Nof, 1988; Krom et al., 1992). However, mode-water eddies (McGuillicuddy et al., 1999) tend to produce strong biological responses (McGuillicuddy et al., 2007) and appear to foster a shift in phytoplankton species composition in the Sargasso Sea (Sweeney et al., 2003). The Mediterranean Sea and the Sargasso Sea are typi-cal oligotrophic areas where anticyclonic eddies may play an important role in vertical exchanges of nutrients and organic matter, and subsequently on the biological carbon pump.
The aim of this paper is to describe the water masses and general biogeochemical trends encountered in summer 2008 during the BOUM experiment in the MS, putting particular emphasis on the physical description of the anticyclonic ed-dies studied and their influence on biogeochemical trends, before concluding using first-order biogeochemical daily N-budgets.
The paper is organized as follows. After the introduction (Sect. 1), the material and method (Sect. 2) are limited to a presentation of the BOUM transect in the MS and specific physical methods, while most usual methods for physical and biogeochemical parameters are presented in the Supplement (SM, Part A). The results section (Sect. 3) presents the wa-ter masses encounwa-tered along the longitudinal transect and specifically inside eddies. The main changes in deep and Levantine water properties are particularly pointed out, as well as the anomalies found inside the eddies. The dynam-ical, physical and biogeochemical characteristics of the ed-dies are then described, as well as the very low variability of all parameters in their cores. Finally, a “close to equilibrium” first-order nitrogen budget is presented for each eddy. The discussion (Sect. 4) is focused on specific results in order to better characterize the influence of eddies on the physics and the biogeochemistry of the MS. The origins of the anoma-lies inside the eddies are discussed by using new information from the winter mixed layer depths (W-MLD, SM Part B) in the eddy cores. The conclusion (Sect. 5) establishes the main results on the physics and the biogeochemistry of the MS.
2 Material and methods
2.1 Sampling strategy
The BOUM cruise took place during summer 2008 (from 16 June to 20 July) in the Mediterranean Sea and con-sisted of a 3000 km transect from the Rhˆone river mouth (western Mediterranean) to the Eratosthenes Seamount (east-ern Mediterranean). Along this transect, 27 “short duration” (SD) and 3 “long duration” (LD) stations located in the cen-tre of anticyclonic eddies were sampled (Table 1). The sam-pling strategy and the general characteristics of each station are detailed in Moutin et al. (2012). The locations of stations
T able 1. General ph ysical and biogeochemical char acteristics of the stations in v estig ated along the BOUM transect presented by columns: (1) station number , short duration (SD) or long duration (LD) station; (2) MLD 0 .03 : mix ed layer depth 0 .03 (m); (3) MLD 2d : mix ed layer depth 2 days lagged (dbars); (4) W -MLD: winte r maximum mix ed layer depth (dbars); (5) E ZD: euphotic zone depth (dbars) estimated according to Morel and Maritorena (2001); EZD, mean (6) and sd of the euphotic zone depth (dbars), (7) DCMD: deep chloroph yll maximum depth; (8) DCMC: deep chloroph yll maximum concentration: chloroph yll a concentration at the DCMD (mg m − 3); (9) I chl a , inte gr ated (0–150 dbars) total chl a concentration (mg m − 2); INO 3 (10) and IPO 4 (11): inte grated nitrate and phospha te concentrations (mmol m − 2); (12–19) Dx , Sx , Nx and r 2 x: characteristics of nutriclines (slopes in nM m − 1and depth in m where NO 3 or PO 4 reaches zero, N: number of samples for the linear relationship, r 2: correlatio n coef ficient); (20–21) DTPO 4 : depths before ( ◦) and after (+) a lar ge (> 100 h) increase of phosphate turno v er time. Station MLD 0.03 MLD 2d W -MLD EZD EZD DCMD DCMC I chl a INO 3 IPO 4 DNO 3 SNO 3 NNO 3 r 2 NO 3 DPO 4 SPO 4 NPO 4 r 2 PO 4 D ◦ TPO 4 D + TPO 4 (dbar) (dbar) (dbar) (dbar) (dbar) (m) (m g m − 3) (mg m − 2) (mmo lm − 2) (mmol m − 2) (m) (µmol m − 4) (m) (µmol m − 4) (m) (m) 27 SD 2.0 2.5 98.0 76 27.1 153.6 4.1 25 49.4 5 0.96 17 1 .0 9 0.68 31 40 26 SD 6.7 16.5 1000.0 87 40 1.7 34.2 846.4 29.9 19 144.1 3 0.89 23 5 .0 3 1.00 25 51 25 SD 28.3 29.5 178.5 53 50 1.7 36.2 662.3 24.3 45 149.9 3 0.93 41 4 .7 3 0.99 nm nm 24 SD 8.9 15.5 104.5 77 70 0.75 38.8 327.3 8.5 58 79.8 3 0.85 68 2 .6 3 0.91 76 101 23 SD 20.6 22.5 66.5 85 75 0.72 27.6 313.3 6.1 50 66.0 3 1.00 80 2 .3 5 0.98 74 101 A LD 7.8 13.5 90.5 102 83 ± 2 85 0.7 22.7 49.0 2.2 72 11.8 98 0.76 nc nc nc nc 76 91 22 SD 2.5 14.5 57.5 83 70 0.75 24.4 376.0 15.4 58 93.0 3 0.89 56 3 .4 3 0.83 50 75 21 SD 9.7 16.5 58.5 92 80 0.45 23.0 312.7 14.5 67 92.3 3 0.84 60 3 .0 3 0.83 nm nm 20 SD 8.3 12.5 70.5 81 70 1.17 37.9 347.9 16.1 67 111.0 3 0.92 61 3 .6 3 1.00 75 100 19 SD 5.4 12.5 58.5 79 65 1.05 32.9 432.7 15.5 50 105.6 3 1.00 47 2 .8 3 0.80 nm nm 18 SD 2.8 15.5 68.5 77 80 2 52.6 86.1 2.5 104 17.5 6 0.96 99 1 .6 5 0.89 nm nm 17 SD 5.5 23.5 56.5 86 80 0.77 25.7 57.0 2.1 73 123.9 5 0.85 71 3 .4 5 0.84 nm nm 16 SD 7.7 9.5 81.5 95 75 0.63 30.6 117.7 3.9 70 34.0 6 0.99 67 1 .0 6 0.98 76 100 15 SD 4.4 11.5 65.5 101 100 0.43 25.0 58.1 2.7 97 41.1 6 0.99 84 1 .1 6 0.97 75 101 14 SD 4.3 11.5 67.5 109 120 0.25 18.2 42.5 3.4 103 55.6 7 0.98 79 1 .0 7 0.93 75 100 13 SD 4.4 7.5 85.5 107 90/140 0.62/0.70 33.3 79.0 3.3 80 35.7 6 0.94 84 1 .3 5 0.91 73 123 12 SD 3.9 7.5 82.5 114 70–125 0.18–0.25 20.8 16.7 0.6 104 17.5 5 0.98 nc n c nc nc 101 125 B LD 7.2 8.5 109.5 117 104 ± 4 75/140 0.15/0.26 19.7 7.4 0.0 114 15.5 96 0.92 nc nc nc nc 121 141 1 SD 12.2 14.5 89.5 87 75/85 0.68 32.6 22.6 0.0 104 17.5 4 0.99 nc n c nc nc 101 126 2 SD 10.7 13.5 97.5 107 110 0.32 20.0 57.9 0.5 98 36.8 5 0.99 109 0.8 5 0.93 100 125 3 SD 16.4 18.5 81.5 99 110 1.55 31.8 141.8 2.3 88 48.1 4 0.91 102 1.3 4 0.83 100 125 4 SD 16.4 17.5 80.5 107 105 0.4 21.8 161.5 3.1 91 49.4 4 0.95 106 1.4 4 0.93 101 126 5 SD 9.7 17.5 84.5 106 115 0.62 26.0 100.7 1.2 92 56.8 3 0.99 103 1.2 3 0.96 100 126 6 SD 9.7 13.5 221.5 115 110 0.42 22.6 23.9 0.5 96 15.9 3 1.00 nc n c nc nc 125 251 7 SD 10.9 24.5 94.5 101 100 0.4 21.8 84.7 1.6 94 51.7 3 0.98 nc n c nc nc 100 125 8 SD 10.2 23.5 75.5 109 90/100 0.50/0.35 20.6 128.5 2.5 77 51.6 3 0.99 nc n c nc nc 100 125 9 SD 11.1 17.5 90.5 120 125 0.35 18.2 10.9 0.0 95 6.9 5 0.96 nc n c nc nc nm nm 10 SD 4.0 14.5 88.5 119 110 0.32 15.5 28.3 0.5 78 12.6 3 0.98 nc n c nc nc 100 126 11 SD 9.3 12.5 153.5 113 110 0.35 20.1 27.6 0.6 88 12.1 3 0.87 nc n c nc nc 100 125 C LD 10.1 11.5 396.5 103 102 ± 3 110 0.62 25.1 32.4 8.3 93 24.9 71 0.64 nc nc nc nc 101 120 nc: not calculated (linear relationship not estab lished), nm: not measured
Map of absolute dynamic topography merged (cm) ; 29 Jun 2008 [Aviso] 0 5 10 15 20 25 30 35 32 34 36 38 40 42 44 30 cm/s boum 2008 bins 1 - 7 27 26 25 24 23 A 22 21 20 19 18 17 16 15 14 13 12 B 1 2 3 4 5 6 7 8 9 10 11 C Coast 200 m 1000 m 2000 m 3000 m 32 32.2 32.4 32.6 32.8 33 33.2 33 33.2 33.4 33.6 33.8 34 30 cm/s
Eddy C boum 2008, bins 1 - 7
18 18.2 18.4 18.6 18.8 19 33.7 33.8 33.9 34 34.1 34.2 34.3 34.4 34.5 34.6 34.7 30 cm/s
Eddy B boum 2008, bins 1 - 7
4.8 5 5.2 5.4 5.6 5.8 6 6.2 6.4 6.6 6.8 38.4 38.6 38.8 39 39.2 39.4 39.6 39.8 30 cm/s
Eddy A boum 2008, bins 1 - 7
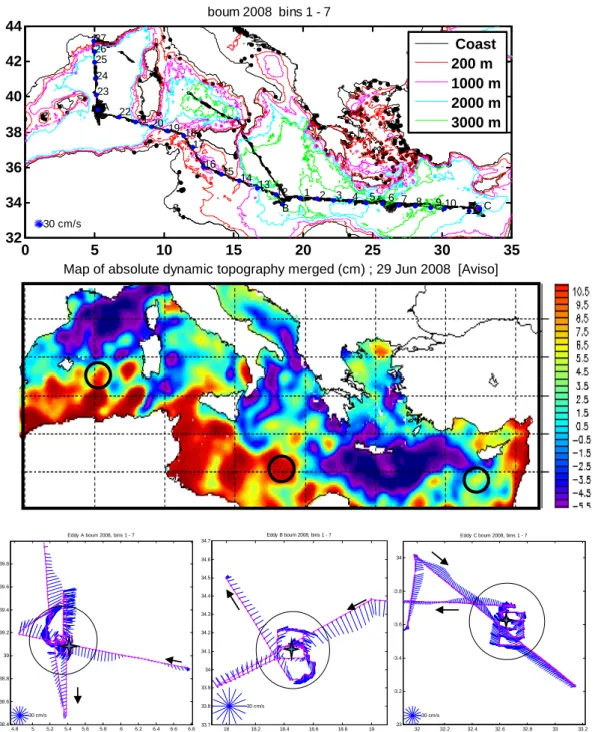
Fig. 1. Top: map of the bathymetry (GEBCO 1998) together with the mean velocities measured with the ship ADCP along the transect between 29 and 125 m depth (scale is indicated in blue in the lower left corner). The numbers along the transect correspond to the SD stations numbers indicated Table 1. Middle: map of the sea surface dynamic topography obtained from AVISO on 29th June 2008 and redrawn in Mercator coordinates (colour scale in cm). Location of each eddy is indicated by a black circle around the local maximum. Bottom: details of ship course (pink) and mean ADCP currents measured around the three eddies, A, B, and C. Ship ADCP vectors are drawn each 10 min of cruise time from vessel location (velocity scales are indicated in the left corner of each map). The circles of diameters rVazMax(Table 2)
are positioned at the centre location of each eddy (shown by a blue star), as estimated before the beginning of LD stations.
along the transect are indicated in Fig. 1 (top) by number for SD stations or eddy name (A, B or C) for LD stations, together with bathymetry and ship mounted ADCP surface current data. The eastern part of the section (SD 1 to 11)
was sampled first, then LD station C and LD station B. The central section (SD 12 to 22) followed by LD station A was then sampled, and the cruise ended with the last five stations (SD 23 to 27). The black circles on the map of sea surface
topography (Fig. 1 middle) contour the high levels induced by the three eddies (LD station A in the western MS, LD sta-tion B in the Ionian basin between the western and Levantine basins, and LD station C in the Levantine basin of the east-ern MS). The well-known Ierapetra anticyclonic eddy (Fusco et al., 2003) located to the south-east of Crete island (near
34◦N, 26◦E) was also traversed, (see ADCP currents, Fig. 1
top), but is weakly signed on absolute topography (Fig. 1 middle).
The detailed description of the usual methods for physical and chemical parameters measurements is presented in SM (Part A). All data and metadata are available at the follow-ing web address: http://www.obs-vlfr.fr/proof/php/x datalist. php?xxop=boum&xxcamp=boum.
2.2 Specific physical characteristics
Specific characteristics of the three studied eddies were cal-culated and are reported Table 2. It concerns (1) general prop-erties obtained from direct observations, (2) anomalies de-termined from two “in” and “out” casts for each eddy, and (3) dynamical properties calculated from observations of a vessel-mounted ADCP (see SM including a comparison be-tween the observations and the simulated eddy A).
2.2.1 General characteristics
The general characteristics of the eddies are reported
Ta-ble 2. Dbottom is the bottom depth, and Drange is the range
of depth where eddy influence is marked on any or some properties; these depth ranges start at the surface as all ed-dies are strongly signed by circular-like surface currents and end at depth where anomalies are very weak. T20/850 dbars are baroclinic geostrophic transport at 20 dbars using a refer-ence depth at 850 dbars and geopotential differrefer-ences between “in” and “out” casts. For eddies A and B, this is only slightly less when using 1500 dbars. 1X is the distance between the “in” cast and the “out” cast used as a reference to determine anomalies at constant depth while 1H is the depth
deepen-ing of the maximum anomaly isopycnal σMaxAnoE from “out”
to “in” casts (see SM).
2.2.2 Characteristics of the anomalies
Anomaly is the difference at constant depth between “in” and
“out” profiles for the selected parameter, with E for eddy.
DE
TopAnois the depth of the top of anomaly, i.e. that anomaly
weakens upwards. DEMaxAnois the depth where the absolute
anomaly is maximum, and DEBotAno is the depth of the
bot-tom of anomaly, i.e. that anomaly weakens downwards. The depths recorded here were taken with excess density (σ ), but some weak variations were observed for other
parame-ters: σMaxAnoE (σ at DEMaxAno), SEMaxAno (ibid for S), θMaxAnoE
(ibid for θ ), AOUEMaxAno (ibid for AOU), δσE (anomaly in
σ observed at DEMaxAno), δSE (ibid for S), δθE (ibid for θ ),
δAOUE (ibid for AOU). The depth-integrated anomalies for
σ, S, θ and AOU between 0 and 850 dbars are also reported
in Table 2.
2.2.3 Dynamical Characteristics
δGMax is the maximum value of geopotential difference as
observed between “in” and “out” profiles using a reference
depth at 850 dbars, and DGMax is the depth of δGMax and
VazMax. VazMaxis the azimuthal velocity maximum; by
con-vention, the azimuthal velocity is negative in an anticyclonic
eddy. VazMaxis inferred from VMADCP, and rVazMaxis the
distance of an eddy diameter between the 2 VazMax. This
dis-tance should correspond to L√2 where L is the Rayleigh
distance (see SM). ω(Tr) rotation pulsation is always nega-tive (number of days for one complete rotation). f (lat) is the
Coriolis parameter which is depending on latitude. ζmin/f is
the ratio of the minimum relative vorticity occurring close to the eddy axis to the Coriolis parameter. This negative param-eter, calculated as 2ω/f , indicates the strength of the eddy which isolates the eddy core in solid rotation from outside advection (see also SM, Part C).
2.2.4 Flux function
The flux function is calculated for each cast by the integra-tion of the geopotential anomaly referenced at 850 dbars. This function F is very useful because the difference between 2 points, whatever their distance apart, is ex-actly equal to the baroclinic geostrophic transport with a sign directed positively and perpendicularly at the tran-sect on the right. As an example, for eddy B (cast 115, X = 1808 km), F = −28.437 Sv; for the next cast along the transect (cast 2, X = 1939 km), F = −31.880; thus, δF =
−28.437 + 31.880 = 3.443 Sv, a value of transport reported
for eddy B at line T20/850 in Table 2.
2.3 Daily N-budget at the LD stations
A first-order daily N-budget was carried out at the three LD stations. As a first approximation in this paper, we will con-sider that these eddies are in solid body rotation and are closed systems similar to giant mesocosms for biological and biogeochemical process studies. In this budget, we consider nitrogen input at the top and the bottom of the 0–150 m water column, the total primary production within the water col-umn and particulate export at 230 m.
The materials collected on the two PPS5 sediment traps deployed at 230 and 460 m depths over three days at each LD station were analyzed daily according to the methods de-tailed on the French national “traps” web site (http://www. obs-vlfr.fr/LOV/Pieges) for dry weight and specific C, N and
P composition. Results are converted in mg m−2d−1and the
particulate C:N:P ratio calculated from the means obtained with the three 1-day values (Table 3). The standard deviation (sd) values are in italics under the corresponding means.
Table 2. Specific depth characteristics of the three studied eddies at the three LD stations A(130;186), B(2.71) and C(17.71). Numbers in brackets correspond to CTD casts “in” (i.e. near eddy axis) and “out”, respectively. As eddy B shows two pycnostads and an S anomaly (S Ano) sign change, two parts, surface and deep, were distinguished. See Material and Methods for a detailed description of all specific characteristics.
Specific characteristics LD Stations
Units A Bsurf Bdeep C
General DBottom dbars 2758 3070 3070 923 Drange dbars 0–420 0–250 250–1200 0–800 T 20/850 dbars Sv 2.40 3.45 (1.70)* 3.45 (1.75)* 3.04 1X km 142 128 128 71 1H m 91 70 330 231 Anomalies DETopAno dbars 90 95 300 120 DEMaxAno dbars 160 135 600 380 DEBotAno dbars 420 250 1200 800 σMaxAnoE kg m−3 28.202 28.433 29.012 28.84 SMaxAnoE no dimension 37.68 38.44 38.96 39.39 θMaxAnoE ◦C 14.27 15.86 15.06 17.2
AOUEMaxAno µmol kg−1 13 5 21 12
δσE kg m−3 –0.66 –0.32 –0.134 –0.251
δSE PSU –0.65 –0.28 +0.14 +0.388
δθE ◦C 0.75 0.5 1.04 2.35
δAOUE µmol kg−1 –50 0 –30 –40
Integrated σ Ano (0–850 m) kg m−2 –120 – –108 –48.2
Integrated S Ano (0–850 m) (psu) m−2 –126.1 – 28.3 111.4
Integrated θ Ano (0–850) ◦C m 122 555 580
Integrated AOU Ano (0–850 m) µmol m−2 –9328 – –9771 –7665
Dynamical Characteristics δGMax m2S−2 1.26 0.42 0.98 (0.58) 0.65 DGMax dbars 40 30 30 (250) 90 VazMax ms−1 –0.33 –0.20 – –0.20 rVazMax km 58 42.5 – 48 ω(Tr) 10−5rad/s (days) –1.8181 (4) –1.212 (6) – –1.3222 (5.5) f(lat) 10−5rad/s (◦N) 9.1531 (39.1) 8.1542 (34.1) 8.1542 (34.1) 8.0699 (33.7) ζmin/f no dimension –0.3973 –0.2973 – –0.3277 DEWML 2008 dbars 90.5 109.5 109.5 396.5 DWML 2008 OUT dbars 57.5 89.5 300* 153.5
*Numbers inside brackets for eddy B refer to the transport corresponding to depths between 20 and 250 dbars (Bsurf)and between 250 and 850 dbars (Bdeep).
All the pertinent information to calculate the daily
N-budget is presented in Table 4. The top nitracline (DNO3)
is reported directly from Table 1, along with the slope of
the nitracline (SNO3). N-input by upward diffusion, from the
bottom of the water column, is the product of the eddy
dif-fusion coefficient (Kz)measured at the level of the shallow
nitracline (Cuypers et al., 2012) by the concentration
gradi-ent SNO3. The overall averaged Kz found in each eddy and
within eddies between the pycnocline basis and 100 m depth
is ≈10−5m2S−1(i.e. 0.86 m2d−1). This Kz value, with an
estimated error of about 40 % (Table 2 in Cuypers et al.,
2012), was considered constant. N-input by N2 fixation is
the mean integrated value measured in the photic zone, and atmospheric deposition is a mean value taken in the absence of rain (Bonnet et al., 2011 and further references herein, Ta-ble 1). The estimated errors could be 30–40 % (Bonnet et al., 2011, their Table 1). New N-input corresponds to the sum of these three N-fluxes, because other possible inputs
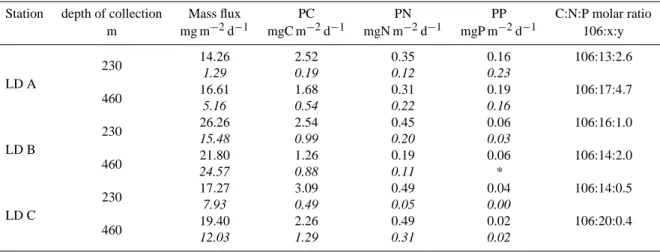
Table 3. Sediment trap data at the LD stations. Depth of collection, mean mass flux in mg m−2d−1of matter (DW) and for each elements C, N and P (sd in italics), mean C:N:P molar ratio.
Station depth of collection Mass flux PC PN PP C:N:P molar ratio
m mg m−2d−1 mgC m−2d−1 mgN m−2d−1 mgP m−2d−1 106:x:y LD A 230 14.26 2.52 0.35 0.16 106:13:2.6 1.29 0.19 0.12 0.23 460 16.61 1.68 0.31 0.19 106:17:4.7 5.16 0.54 0.22 0.16 LD B 230 26.26 2.54 0.45 0.06 106:16:1.0 15.48 0.99 0.20 0.03 460 21.80 1.26 0.19 0.06 106:14:2.0 24.57 0.88 0.11 * LD C 230 17.27 3.09 0.49 0.04 106:14:0.5 7.93 0.49 0.05 0.00 460 19.40 2.26 0.49 0.02 106:20:0.4 12.03 1.29 0.31 0.02
* one extremely high value was discarded; no SD can be calculated.
Table 4. Daily N-budget at the three LD stations A, B, and C.
Specific characteristics LD Stations
Units A B C
DNO3 m 72 114 93
SNO3 µmol m
−4 11.8 15.5 24.9
Input by diffusion µmol m−2d−1 10.1 13.3 21.4 Input by nitrogen fixation µmol m−2d−1 12.5 15.2 0.2 Input by atmospheric deposition µmol m−2d−1 25.0 18.5 18.5 Input of new nitrogen µmol m−2d−1 47.6 47.0 40.1 N export at 230 m µmol m−2d−1 25.3 32.0 34.8 Integrated gross N-primary production µmol m−2d−1 3470 4130 3560
Export vs. total production % 0.9 0.8 1.0
Regenerated vs. total production % 98.6 98.9 98.9
are neglected and also because the eddies are presumed to be horizontally closed systems once formed. The sum of errors is estimated to be 70 % using the square root of the mean variance of the three N-fluxes. N-export corresponds to the mean value measured on drifting traps at 230 m during the occupation of each site (Table 3) with an estimated error in the range of 40 %. The integrated gross N-primary produc-tion is determined by dividing the integrated gross C-primary production (GPP) by 6.6, the classical C:N ratio of particu-late organic matter. GPP corresponds to 1.72*NPP, the net
primary production (NPP) measured in situ using the 14C
method (Moutin et al., 1999) and reported as integrated (PPp) values in Christaki et al. (2011, their Table 4). The two in-tegrated primary production rate determinations were aver-aged for each eddy. The percentage of export production is calculated by dividing the N-export by the integrated gross N-primary production rate (Table 4). The percentage of pro-duction attributed to nutrient regeneration in the photic zone (regenerated production) is estimated by 100 times the
dif-ference: 1 – (input of new N divided by the integrated gross N-primary production).
3 Results
3.1 Water masses and general biogeochemical trends
3.1.1 Potential temperature (θ ) – salinity (S) diagrams,
a powerful tool to see the progressive modification of LIW from its source
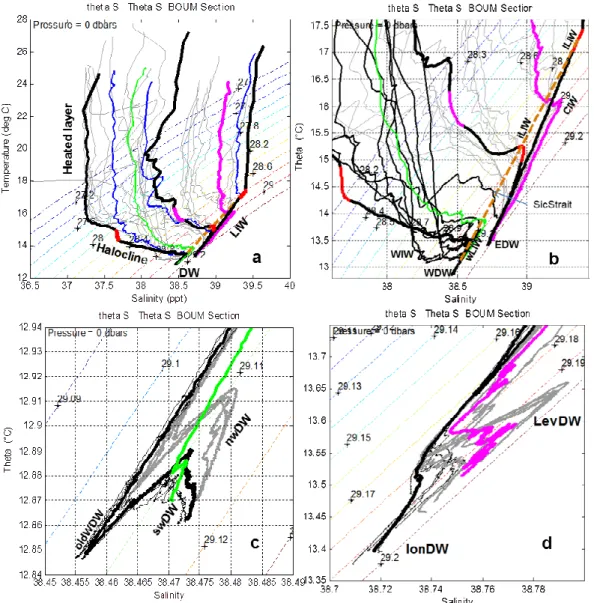
The main Mediterranean water masses encountered along the summer 2008 BOUM cruise transect are identified in Fig. 2 using θ − S diagrams where the 30 θ − S casts are super-imposed (see legend to find the significance of the different
lines). Surface temperature was close to 24◦C at LD station
A, 28◦C in the Ionian basin and reached a maximum value of
27◦C in the eastern MS. Three layers are usually considered
Fig. 2. θ − S diagrams for all the 30 deep casts of the BOUM section. (a) Full range, with indications of heated layer, halocline, LIW layer and deep layer, DW (see text). (b) Zoom in order to show intermediate waters using θ < 17.4◦C and S > 37.5. WIW: winter intermediate water in the western MS. lLIW, iLIW wLIW aligned along the dashed straight ochre line represent the Levantine, Ionian and western LIW, respectively. CIW: Cretan intermediate water. (c) Zoom for the western Mediterranean deep waters; oldWDW, swDW and nwDW stand for old western, southwestern and northwestern deep waters. All these deep waters were thought to have formed in northwestern MS, but the two latter after 2005–2006. (d) Deep layer in the eastern MS; LevDW was observed in the Levantine basin and IonDW in the Ionian basin. Lines: The thick black lines from left to right on panel (a) represent the LD stations A, B and C located at the centre of the eddies. The blue lines represent the closest SD stations investigated outside each eddy. The mauve thick line indicates the Ierapetra eddy (station 6), and the green thick line, the SD station located south of Sardinia (SD station 20). All other stations were drawn in thin grey in (a), in middle black for the western MS with SD station 18 (771 dbars deep) near the Sicilian sill identified as SicStrait in (b). The fine black and middle grey correspond to θ − S profiles in the south and northwestern MS in (c) and in the Ionian and Levantine basins on (d), respectively. The θ − S part at the depth ranges of the pycnostad found for each eddy A, B, C (see Table 1, DETopAnoto DEMaxAno)is superimposed to thick black lines in thick red (panels (a) and (b)). For eddy B, the Bsurfpycnostad was drawn in thick mauve.
surface layer, heated since the previous winter, is seen as an approximately vertical branch almost parallel to the θ axis. This layer corresponds roughly to the 0–70 m depth range and includes the summer mixed layer and the strong thermo-cline. Due to strong evaporation in the MS and the increased modification of Atlantic water entering at the Strait of
Gibral-tar (S = 36.2 and T = 15.5◦C for the 0–100 m depth range),
Svaried between 37.2 at LD station A in the Algerian basin
to 39.4–39.6 at LD station C in the Levantine basin, with val-ues close to 38 in the northwestern MS. A regular increase in
S was observed from the western to the eastern part of the
The intermediate layer (70 to 700 dbars, θ < 17.4◦C) is
better represented in diagram 2b. A strong halocline was found in the western MS, S increasing and θ decreasing with depth down to a first minimum of θ representative of the win-ter inwin-termediate wawin-ter formed in the northweswin-tern MS, and below the well-known Levantine intermediate water (LIW) formed in the Levantine basin and identified with a maxi-mum of θ and S at depths of around 400 dbars. In the Ionian basin, the halocline is strongly attenuated and disappeared in the Levantine basin where the surface layer is connected di-rectly to the LIW. The θ − S properties of LIW are changing along its flow from the Levantine basin (lLIW) toward the Ionian (iLIW) and the western basin (wLIW). The maxima of θ and S strongly decrease westward, but they are approxi-mately on the same straight line, shown in ochre (Fig. 2b).
The deep θ − S layer found at depths below 700 dbars shows similar patterns but for different values of θ and S in the western and eastern basins (Fig. 2c and d for the west-ern and eastwest-ern MS, respectively). A second minimum of
θ was encountered at 1200–1500 dbars in the western MS
and at 1000 dbars in the eastern MS. This minimum corre-sponds to the separation, along the isopycnals 29.106 and
29.180 kg m−3, between the old and new deep waters in each
basin, respectively. In the western MS, the new deep water was thought to have formed during winter 2005–2006 in the northwestern MS. In the eastern MS, the new deep water was thought to have formed in winters of the early 1990s in the Aegean area (EMT period), which replaced the oldest deep water (Lascaratos et al., 1999; Malanotte-Rizzoli et al., 1999; CIESM 2009). However, the 2008 θ −S diagram of the Ionian basin (Fig. 2d) did not exhibit a second minimum of θ , which is interpreted as a recent deepest and densest water formation in the south Adriatic (see discussion), as before the EMT. The cast undertaken in the south of Sardinia is shown in green on Fig. 2a–c because it exhibits particular θ − S properties in deep water which are interpreted as the properties of the flow entering the Algerian basin from the Tyrrhenian basin.
Another type of intermediate water was also encountered along the BOUM section. The Cretan intermediate water (CIW), which is denser than the LIW, was encountered in the south of Crete and observed at the station inside the Ierapetra eddy (thick red). The three anticyclonic eddies (thick black lines on Fig. 2a–d), investigated during the BOUM experi-ment, show different θ − S properties in the different θ − S diagrams, but are not truly different or abnormal in compar-ison to the respective nearest station outside the eddies (thin blue lines on Fig. 2a).
In order to see the progressive modification of LIW from
its source, the maximum S value (Smax), the depth of Smax
and AOU(Smax) of each profile under the thermocline (θ <
17.4◦C) are shown on Fig. 3. The most salty water was
then observed in eddy C with a Smax near 39.4 at a depth
of 150 dbars, i.e. very close from the surface. Progressing
westward, Smaxdecreases stepwise, firstly after the
Ierape-tra eddy, then after eddy B, then after the SIerape-trait of Sicily
and ending near 38.6 in the western MS. Smax depths
con-comitantly increase from 150 dbars to 450 dbars, but peaked in each eddy. The LIW was encountered deeper inside than
outside of each eddy. Another peak of Smaxin depth was also
observed near the Strait of Sicily (X = 1000 km) but cannot be interpreted here.
3.1.2 Main features of deep, intermediate and surface
waters found on sections
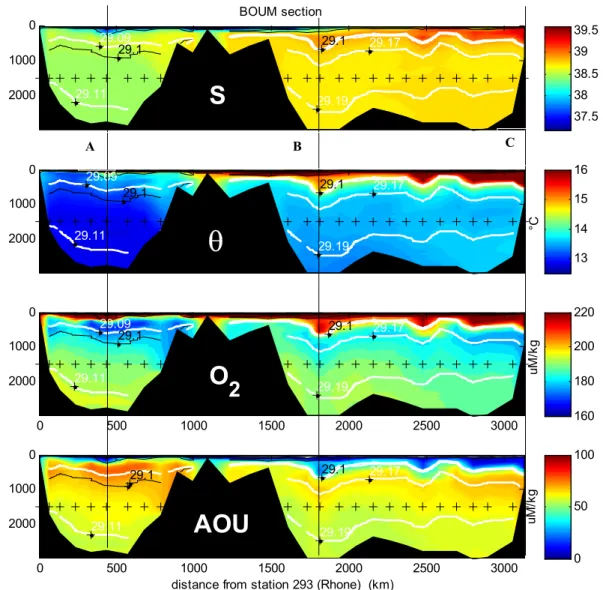
Full depth (0–3000 dbars) sections are presented in Fig. 4 and Fig. 5 from the Rhˆone river mouth in the western MS to the Eratosthenes Seamount in the eastern MS. The deeper waters in the western and the eastern basins are separated by the Strait of Sicily (x-axis at around 1100 km). The black crosses on vertical sections indicate the CTD cast positions. The X-coordinates for LD stations A, B, C are approximately 450, 1750 and 3300 km from the station in the Rhˆone river mouth, respectively. LD station C, in the most eastern sector studied, was above the Eratosthenes Seamount at a depth of
around 900 m. Specific isopycnals (σθ)are drawn (Fig. 4)
on each panel in thick white, 29.09 and 29.11, and 29.17
and 29.19 kg m−3for the western and eastern basins,
respec-tively, and each decreasing at a 0.5 interval from 29.1 in thin black lines. All stations were investigated from the surface to the bottom (Table 1), but two stations in the Ionian basin reached only 3020 dbars due to sensor limitation. The main
features, S, θ , dissolved oxygen concentration (O2)and
ap-parent utilization (AOU), are presented in Fig. 4. The deep
minima in temperature and S (σθ close to 29.18 kg m−3)
which separate, in the more eastern part of the MS, the pre-vious eastern Mediterranean deep water (pEMDW) from the transient eastern Mediterranean deep water (tEMDW) were observed during summer 2008 only in the Levantine basin at around 1000 m (Fig. 4). The tEMDW was still observed by a deep maximum in S and in θ along the 29.19 isopycnal at around 2000 m depth. This water is also marked by a
rela-tively lower O2concentration and higher AOU compared to
the deep waters of the Ionian basin. The deepest waters in the Ionian basin exhibited lower saline, colder temperatures
(Fig. 2d), and higher O2properties (Fig. 4 bottom) could be
interpreted as typical of recent deep waters probably formed in the north Ionian or the Adriatic areas. In the western MS, the deep water density below 2000 dbars was close to 29.11 but sloped up northward in the area of deep water formation
(northwestern MS , X < 300 km) where high O2 and low
AOU were observed.
Above the deep waters, a minimum O2layer (max AOU)
was observed along the entire section. The depth of this layer, close to the 29.17 isopycnal, was as deep as 900 m near LD station C and oscillated between 900 and 600 m through the eastern MS. The maximum AOU layer followed the 29.09
isopycnal and the Smaxdepth layer of the LIW in the western
MS, but these two layers were clearly separated in the
0 500 1000 1500 2000 2500 3000 38.5
39 39.5
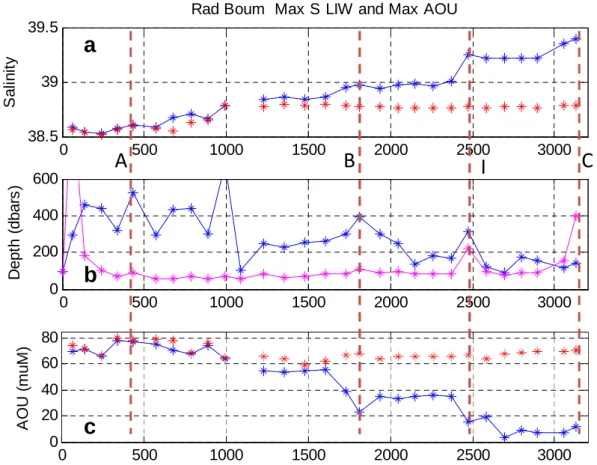
Rad Boum Max S LIW and Max AOU
S a li n it y 0 500 1000 1500 2000 2500 3000 0 200 400 600 D e p th ( d b a rs ) 60 80 A O U ( m u M )
A
B
I
C
a
b
0 500 1000 1500 2000 2500 3000 0 20 40 60 A O U ( m u M )c
Fig. 3. Salinity (a), depth (b, dbars) and AOU (c, µM) values found on each vertical profile along the BOUM section at the maximum of S (blue stars), and Salinity (a) and AOU (c) at the maximum of AOU (red stars). W-MLDs are indicated in mauve stars (b). The dashed vertical lines (red) show the locations of eddies A, B, Ierapetra and C, from left to right respectively. The x-axis is graduated in km of transect from the SD station 27 near the mouth of the Rhˆone river. In the (a) and (c) panels, the stations where bottom depths were <150 dbars were kept out.
isopycnal. This feature is shown on Fig. 3a and c by adding red crosses corresponding to S and AOU values at the maxi-mum of AOU. Maximaxi-mum AOU decreases slightly (70 µM at LD station C to 60 µM at LD station B) in the eastern MS but increases to 80 µM in the western basin (LD station A).
Fig-ure 3c shows more precisely that AOUMaxand AOU at Smax
became close in the westernmost part of the eastern MS (X near 1600 km) before the passage of LIW through the Strait of Sicily. Such a feature will be discussed in Sect. 4.
The anticyclonic eddies A, B and C are easily identified by local deepening of isotherms, isohalines and isopycnals (Fig. 4). At X = 2500 km, the section crossed (SD 6) the Ier-apetra anticyclonic eddy to the south of Crete. The deepen-ings are mainly visible in the first 400 m, but they are still observed at deeper depths, down to 1500–2000 m, indicating a probable deep influence of these physical structures. Anti-cyclonic eddies, Ierapetra included, are characterized by low
AOU values (<20 µmol kg−1)close to the surface and even
deeper down to 200 m, particularly at LD station C (Fig. 4d).
At LD station B, AOU was also low (20 µmol kg−1)near
500 m, but was not as low as at LD station C (10 µmol kg−1).
This indicates the presence of recent Levantine waters deep in eddy B. Deeper still and down to the bottom, AOU was
close to 60 µmol kg−1, a value higher than the 50 µmol kg−1
AOU value characteristic of the recent deep waters surround-ing eddy B in the Ionian basin. This feature could indicate that the new deep water does not penetrate under this eddy or that more organic particulate matter was remineralised there. In any case, eddy B has an influence on the whole water col-umn. Eddy A did not have a deep, strong signature for S and AOU.
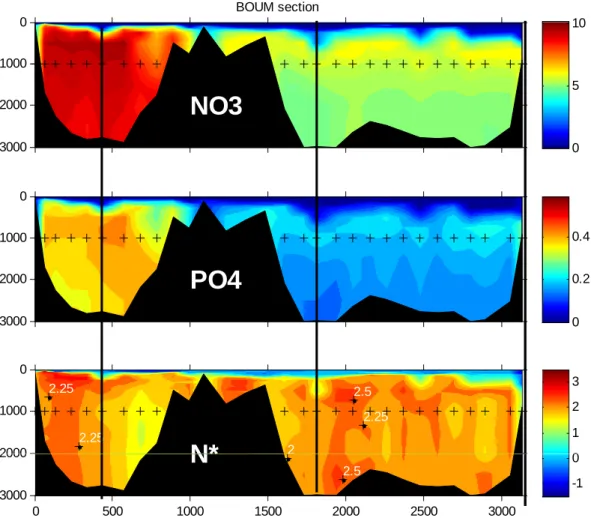
Mineral nutrient concentrations, NO3and PO4(Fig. 5 top
and middle), are close to zero in the upper surface layer (dark blue on the panels) and decrease at depth from west to east in accordance with classical trends in the MS (see Pujo-Pay et al. (2011) for a detailed description). The two colour scales for nitrate and phosphate concentration were chosen in accor-dance with the Redfield ratio (Rr) N/P = 16 (Redfield et al., 1963). Because the colours are not identical for nitrate and phosphate, the strong depletion in P vs. N in the whole MS, which is even higher in the eastern part, can be seen clearly. The bottoms of the nil concentration layers, corresponding
BOUM section 29.1 29.1 29.11 29.09 29.19 29.17
S
0 1000 2000 37.5 38 38.5 39 39.5 °C 29.1 29.1 29.11 29.09 29.19 29.17θ
0 1000 2000 13 14 15 16 uM /k g 29.1 29.1 29.11 29.09 29.19 29.17O
2
0 500 1000 1500 2000 2500 3000 0 1000 2000 160 180 200 220distance from station 293 (Rhone) (km)
uM /k g 29.1 29.1 29.11 29.19 29.17
AOU
0 500 1000 1500 2000 2500 3000 0 1000 2000 0 50 100 A B CFigure 5 Moutin et al.
Fig. 4. Salinity (S, PSU), potential temperature (θ ,◦C), dissolved oxygen concentration and apparent oxygen utilization (O2and AOU,
µmol kg−1)sections along the BOUM transect (0–3000 dbars) from the Rhˆone river mouth in the western part of the MS to the Eratosthenes Seamount in the eastern part. Black vertical lines indicate the location of the three LD stations A, B, and C. Specific isopycnals (σθ)are superimposed in thick white on each panels, 29.09, 29.11, 29.17, and 29.19 kg m−3for the western and eastern basins, respectively, and each decreasing at a 0.5 interval from 29.1 in thin black lines visible only by zooming.
to DNO3 and DPO4 (Table 1), have depths increasing from
the west to the east, in accordance with classical trends from oligotrophy in the western towards ultraoligotrophy in the
eastern basin of the MS. DNO3 may be considered as the
best criterion for defining oligotrophy. DNO3 decreases from
around 50–70 m in the western basin with lower values close to 20 m near the mouth of the Rhˆone river, to around 80– 100 m in the eastern basin with a deeper value of 114 m at LD station B (Table 1). Only weak differences in the top nitracline and phosphacline depths were found when con-sidering changes in phosphate turnover times (Table 1) in-stead of concentrations, when the latter were extremely low values (below 50 nM) measured in the upper waters of the
eastern MS. Deep concentrations of NO3and PO4at 2000–
3000 dbars were circa 9 and 0.38 µM in the western MS and 5 and 0.17 µM in the eastern MS, respectively. Nitrate and phosphate maxima concentrations occurred within the inter-mediate layer between 500 and 1000 m depth, with values of 10.5 µM and 0.42 µM, and 6.5 µM and 0.22 µM, for ni-trate and phosphate, in the western and eastern MS, respec-tively. These maxima are closely related and correspond to the maximum AOU. Mean integrated nitrate concentration
was 382 mmol m−2(sd = 229) in the western basin (stations
19 to 27), and 63 mmol m−2 (sd = 49) in the eastern basin
(stations 1 to 16). The linear regression INO3= 26.75∗IPO4
(r2=0.90, N = 30) indicates the strong relationship between
these two nutrients and a similar decreasing pattern from the west to the east. The three eddies studied, A, B, C, as well
BOUM section
NO3
0 1000 2000 3000 0 5 10PO4
0 1000 2000 3000 0 0.2 0.4 2.25 2.25 2.25 2.5 2N*
0 1000 2000 0 1 2 3 2.5 2N*
0 500 1000 1500 2000 2500 3000 2000 3000 -1 0Fig. 5. Nitrate and phosphate concentrations (µM) and N* (µM) sections along the BOUM transect (0–3000 dbars). N* = NO3–PO4*Rr; Rr = 17.7 following Pujo-Pay et al. (2011). Linear interpolation between bottle data each 10 dbars was used to generate the distribution maps. Colour intervals were 0.25 µM for NO3and N* and 0.025 µM for PO4. Black vertical lines indicate the location of the three LD stations A,
B, and C. The x-axis is graduated in km from SD 27 near the mouth of the Rhˆone river.
as the other eddies crossed during the transect, are also visi-ble in nutrient concentrations by the local deepening of iso-pleths mainly in the 1000 m depth layer. The variable N* was
calculated as N* = NO3– 17.7∗ PO4and plotted in Fig. 5.
The 17.7 factor is the 1NO3:1PO4ratio of particulate
or-ganic matter remineralisation below a depth corresponding
to O2= 195 µmol kg−1(i.e. around 200–250 m) in deep and
intermediate waters of the MS (see Pujo-Pay et al., 2011). N* values were close to zero in surface waters reaching
neg-ative values, but, because PO4measurements are very close
to the detection limit in surface waters, these results should be taken with caution. Positive N* values were measured in deep waters confirming the P-deficiency of Mediterranean waters. Positive N* values of 2.11 µM (sd = 0.25 µM) were surprisingly observed both in the eastern and the western deep Mediterranean waters for depths >200 dbars, indicat-ing that the relative variations of nitrate and phosphate centrations in deep waters occurred in a proportion that
con-serves N*, i.e. with a constant and low variable 1NO3:1PO4
ratio. This feature will be discussed in Sect. 4.
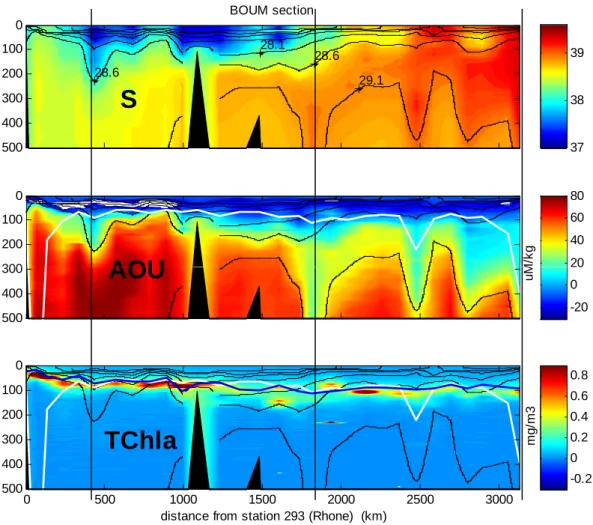
Figure 6 (bottom) illustrates the deepening of the deep chlorophyll maximum (DCMD, Table I) from 50–75 m in the west to 110–120 m in the east. The maximum chl a con-centration (DCMC) did not decrease regularly, despite the
highest value of 1.7 mg m−3being observed in the
northwest-ern MS. The lowest value was measured at SD station 14 in
the Ionian basin (0.2 mg m−3, X = 1500 km). A lower value
of 0.15 mg m−3was observed at LD station B in the centre
of the Ionian basin at 75 m, but with a secondary maximum
of 0.26 mg m−3also observed deeper at 140 m. Two distinct
peaks separated by at least 30 m depth were also observed in the two closest SD stations. After omission of the sta-tions in the Sicilian channel, integrated chl a varied between
38.8 mg m−2in the western basin and 15.5 mg m−2at SD
sta-tion 10 in the eastern basin. An integrated chl a value as low
as 22.7 mg m−2was measured in the western basin while a
BOUM section 29.1 28.6 28.1 28.6
S
0 100 200 300 400 500 37 38 39 u M /k gAOU
0 100 200 300 20 40 60 80 u M /k gAOU
300 400 500 -20 0 20distance from station 293 (Rhone) (km)
m g /m 3
TChla
0 500 1000 1500 2000 2500 3000 0 100 200 300 400 500 -0.2 0 0.2 0.4 0.6 0.8Fig. 6. Salinity, AOU (µmol kg−1)and “Chlorophyll” section (in situ fluorescence units) along the BOUM transect (0–500 dbars). W-MLD and the top nitracline (DNO3) are superimposed in white and blue lines on Fig. 6c, respectively. Isopycnals each 0.5 kg m
−3under 29.1 are
drawn in thin black lines.
sector. This value remains somewhat constant, as already ob-served by Moutin and Raimbault (2002). The deepening of DCMD and decreasing in DCMC is classically associated with the increasing trend in oligotrophy, as shown by the
deepening of DNO3 drawn in thick blue line (Fig. 6 bottom).
The euphotic zone depth (EZD) estimated from the discrete measurements of chl a varied between 53 and 120 m (Ta-ble 1), with the deeper depths being obtained in the eastern MS in accordance with the eastwardly increasing oligotro-phy. It is not possible to exhaust the nitrate deeper than the EZD, because it is directly linked to photosynthesis. Thus,
the DCMD, the EZD and Dchlorophyll aare clearly correlated,
and deepen from the west to the east of the MS. This is nei-ther the case in the NW MS nor inside the eddies, the results of which will be discussed in Sect. 4.
The finest scale of depth (0–500 dbars) in Fig. 6 compared to Fig. 4 clearly shows the surface layer strongly influenced by low salinity waters (S < 38) originating from the Atlantic Ocean between X = 300 and X = 1400 km. LIW, shown by the already described deepening of salty water from the east
to the west, is also better visible. LIW, represented by a max-imum of S, is located close to 150 dbars from the eastern Levantine basin to the Ionian basin where it deepens to 300– 400 dbars before reaching the Sicilian channel. The surface S was maximum and as high as 39.65 in eddy C at the eastern end of the section. The eddies are clearly marked by a deep-ening of the isohalines and particularly by the deepdeep-ening of the 29.1 isopycnal in the eastern MS and 28.6 in the west-ern MS (Fig. 4 and Fig. 6). These two latter isopycnals were also drawn for the AOU and T chl a sections (Fig. 6 middle and bottom). A strong deepening of AOU and isopycnals at Ierapetra eddy location (X ≈ 2450 km) and near 2800 km, which might be the Mersa-Matruh eddy (Robinson et al., 1991), were observed.
MLD2d (Table 1), representative of summer MLD,
var-ied between 7.5 and 29.5 m during the BOUM cruise, after the omission of the very coastal SD station 27. AOU (Fig. 6 middle) is slightly negative in the mixed layer which
corre-sponds to a slight O2oversaturation of 6–10 µmol kg−1, as
-20 0 20
AOU depth averaged, 20-850, deviation; mean = 48.2217 muM/kg
m u M /k g -0.2 0 0.2
RAU depth averaged, 20-850, deviation; mean = 29.0076 kg/m3
k g /m 3 -0.5 0 0.5
SAL depth averaged, 20-850, deviation; mean = 38.7748
-2 0 2 4 6
geoflux deviation Sv 20dbars,ref 850 dbarsBOUM section
S
v
0 500 1000 1500 2000 2500 3000
-4 -2
BOUM section distance from station 293 (Rhone) (km)
-10 0 10
DOC depth averaged 20-500 m deviation, mean =50.0957muM
m u M 0 500 1000 1500 2000 2500 3000 -40 -20 0 20
DIC depth averaged 20-500 m deviation, mean =2306.8791muM/kg
m
u
M
/k
g
BOUM section distance from station 293 (Rhone) (km)
Fig. 7. Deviation between depth-averaged (20–850 dbars) values and the mean depth-averaged values for the whole transect of the fol-lowing parameters: AOU (µmol kg−1); S (PSU); σ (kg m−3); deviation to the mean of the baroclinic geostrophic flux function F (Sv) at 20 dbars when considering a reference depth at 850 dbars (0 Sv); deviation of depth-averaged (20–500 dbars) to mean value of dissolved organic carbon (DOC µmol kg−1)and dissolved inorganic carbon (DIC µmol kg−1)along the BOUM transect. The mean integrated values for the transect are respectively mean(AOU) = 48.2 µmol kg−1, mean(S) = 38.775, mean(σ ) = 29.008 kg m−3, mean(DOC) = 50.1 µM and mean(DIC) = 2306.9 µmol kg−1. The positions of eddies A, B, and C are indicated with red crosses and the positions of the nearest casts are indicated by black crosses. No values were obtained when bottom depths were <850 dbars (or <500 dbars), as occurred near the Rhˆone river mouth or in the Sicilian channel.
−20 µmol kg−1 below the pycnocline (around 30 m) under
the influence of the spring net community production which occurs after the stratification of the water column (strong
de-celeration of oxygen transfer towards the surface) and the heating by penetrating solar radiation which accounts for
in July in the MS. AOU reaches positive values at approx-imately the DCMD. This latter depth also corresponds ap-proximately to the W-MLD (Table 1) and to the depth of the top of the nitracline, except in areas of strong W-MLD (northwestern MS and eddy C). The fact that W-MLD cor-responds to a depth where AOU is nil (Fig. 6) indicates that lower depths are ventilated during winter with a positive net community production when stratification occurs, whereas deeper depths show AOU>0, indicating more mineralisation than production (negative net community production) for the same period of time (between winter and summer).
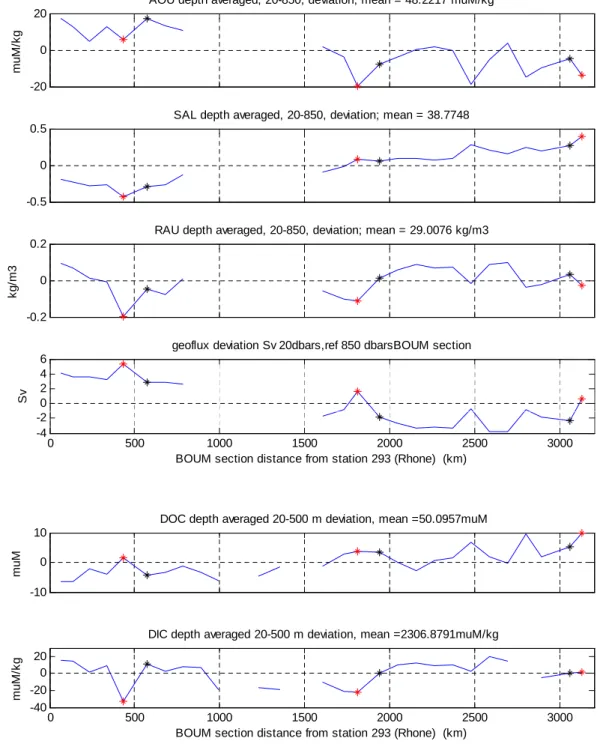
3.1.3 West-east trends and impact of eddies on
integrated contents
Integrated (20–850 dbars) contents were quantified in order to show the deep depth impact of the eddies on physical and biogeochemical variables along the BOUM section (Fig. 7). The three upper panels represent differences between depth-averaged values (20–850 dbars) and the mean values for the whole transect (reported in the title of each panel) for AOU
(µmol kg−1), S and σ (kg m−3). The fourth panel shows the
variations of the flux function F . Each peak of the func-tion F (X) indicates the presence of an anticyclonic eddy be-tween two adjacent stations, or possibly the presence of me-anders, but this could be disregarded when considering sur-face ADCP currents (Fig. 1 bottom). The two lowest
pan-els show integrated DOC (µM) and DIC (µmol kg−1)using
discrete sampling and 10-m interpolation intervals. On each panel, the LD stations A, B and C are marked by red crosses and the closest SD stations by black crosses. The variables (Fig. 7) show trends indicating general features of the MS, and distinctive spikes indicating the presence of eddies and how much regular trends are therefore modified. Mean S in-creased by more than 0.5 towards the east and reached its maximum value in the Levantine basin, as expected. Over-all sea level decreased due to waters below 200 dbar being denser and saltier in the eastern basin than they are in the western basin (Fig. 1 middle). This corresponds to a decreas-ing trend in flux function as seen in Fig. 7. It is less well-known that AOU is lower in the east than in the west at the same water level. The trend for DOC is positive with circa –5 µM in the western basin to more than +5 µM in the Lev-antine basin. Excess density (σ ) and DIC did not exhibit sig-nificant trends. The positions of the LD stations A, B and C are marked by a maximum in F (X) greater than 2 Sv, which indicates a high transport between the eddy centre and the adjacent SD stations, and a circular anticyclonic flow around the axis of the eddy. A decrease in AOU and in σ , as expected for anticyclonic eddies, was observed at the same locations (Fig. 7). However, a decrease in S was observed at LD station A, while an increase was observed at LD stations B and C: this will be explained later when considering water masses and the structure of each eddy. The transect also crossed eddies that had not been chosen for the process study such
as the Ierapetra anticyclonic eddy to the south-east of Crete (X ≈ 2450 km) with its strong AOU anomaly, and the more easterly (X ≈ 2800 km) Mersa-Matruh eddy. An increase in dissolved organic carbon (DOC) was observed inside each eddy we crossed. This was generally associated with a de-crease in dissolved inorganic carbon (DIC) except in the case of eddy C. Almost each spike corresponds to an
iden-tified eddy and has a significant value, e.g. >10 µmol kg−1
in AOU, >1 Sv in transport. The co-occurrence on each vari-able of these spikes superimposed on trends, even if some ap-pear relatively weak for some variables, is a strong indication that each of the five identified eddies has a significant impact on physical and biogeochemical trends along the transect.
3.2 Main characteristics of the three anticyclonic eddies
(A, B, and C)
On board measurements of the mean ADCP currents (Fig. 1, top and bottom), taken along the ship transect at depths be-tween 29 and 125 m, indicate that the three sites were inside anticyclonic eddies. Figure 1 (bottom) provides evidence that locations of the LD stations were near the axis (<10 km) of the eddies, but drifted with the drift of the centres. Analysis of the drifting of the mooring lines and of the float trajecto-ries (not shown) indicates that the R/V was located less than 3 km from the centres of each eddy at the beginning of the LD stations. Their diameters were close to 100 km and the studied areas were under 10 km from the centre of the ed-dies. The positioning near the centres of anticyclonic eddies is also confirmed by the particular variations of several inte-grated variables along the BOUM transect (Fig. 7).
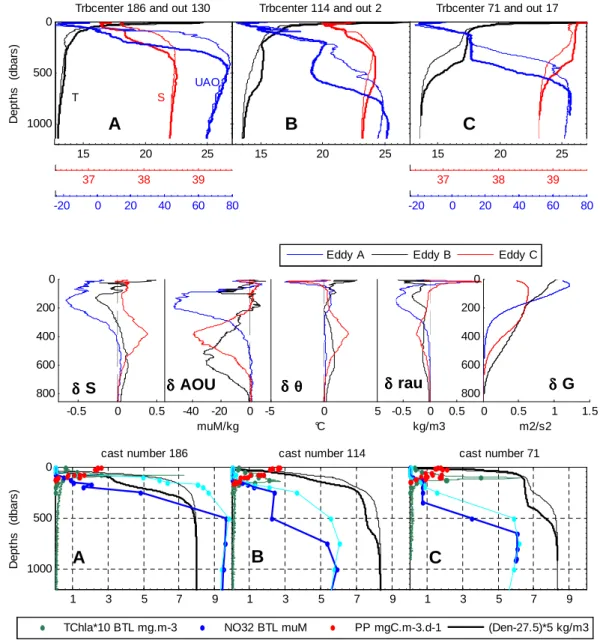
The main physical, chemical and dynamical characteris-tics of the three studied eddies are synthesized in Fig. 8 (mid-dle) and Table 2. Figure 8 shows the superimposed vertical profiles of two casts for each eddy: one cast very close to the eddy axis (<10 km from axis, casts 186, 114 and 71 for LD stations A, B and C, respectively), which is later called “in” profile, and one cast outside the eddy (>70 km from axis, casts 130, 2 and 17 for SD stations 22, 1 and 11, respec-tively), which is later called “out” profile. Fig. 8 shows the vertical profiles of T , S and AOU (top), those of the anoma-lies as will be defined below (middle) and those of primary
production, Chl a, σθ, NO3(bottom).
3.2.1 Dynamical characteristics and anomalies as
typical properties of each eddy
Before presenting the specific characteristics of each eddy (Table 2), we briefly give a reminder of the dynamical speci-ficity of mesoscale anticyclonic eddies. A general descrip-tion of a typical anticyclonic eddy is presented in SM, Part C. Horizontal anomalies are determined by comparing “in” and “out” depth profiles of all observed parameters.
Horizontal anomalies are conserved inside the body of wa-ter around the axis, because it is isolated from mixing and
0 500 1000 D e p th s (d b a rs ) T S UAO
A
Trbcenter 186 and out 130
15 20 25
37 38 39
-20 0 20 40 60 80
B
Trbcenter 114 and out 2
15 20 25
C
Trbcenter 71 and out 17
15 20 25 37 38 39 -20 0 20 40 60 80 -0.5 0 0.5 0 200 400 600 800 δδδδ
S
-40 -20 0 δδδδAOU
-5 0 5 δδδδ θθθθ -0.5 0 0.5 δδδδrau
0 0.5 1 1.5 0 200 400 600 800 δδδδG
Eddy A Eddy B Eddy C
1 3 5 7 9 0 500 1000 D e p th s (d b a rs ) cast number 186
A
1 3 5 7 9 cast number 114B
1 3 5 7 9 cast number 71C
TChla*10 BTL mg.m-3 NO32 BTL muM PP mgC.m-3.d-1 (Den-27.5)*5 kg/m3
-0.5 0 0.5 -40 -20 0 muM/kg -5 0 5 °C -0.5 0 0.5 kg/m3 0 0.5 1 1.5 m2/s2
Fig. 8. Top: vertical profiles of θ (◦C in black), S (PSU in red) and AOU (µmol kg−1in blue) vs. pressure (0–1500 dbars) inside the eddies (thick lines; casts 186, 114 and 71 for LD stations A, B and C, respectively) and outside but from the closest SD station (thin lines; casts 130, 2 and 17 for SD stations, respectively). The same scales for each LD station A, B, and C with the corresponding colours are reported below. Middle: vertical profiles of S, AOU, θ and G anomalies from left to right. Depths of top and bottom anomalies indicated in Table 2 are clearly shown by values close to zero. Bottom: vertical profiles of primary production (*: mgC m−3d−1), total chlorophyll a * 10 (green ∗for HPLC measurements and – for fluorescence converted measurements: µg L−1)and density ((ρ – 27.5)*5, – : kg m−3)vs. pressure (dbars) at the three LD stations (same casts as for Fig. 8 (top) but with rosette sampling except for density). Primary production was measured twice during the LD station occupation. Vertical profiles of nitrate concentration (µmol kg−1)vs. pressure inside (dark blue∗)and outside (light blue∗)the eddies for the same cast and station as for AOU in the top figure.
advection from surrounding waters during the lifetime of the eddy. This is due to the strong influence of ζ on potential vor-ticity conservation (see SM treating the shape of such a body of water). Thus, the so-called anomalies are typical proper-ties of each eddy and are easy to observe from CTD casts. They also provide information about the period and location of the eddy formation. It is interesting to note (Table 2) that inferred ζ , <0, remains a sizeable fraction of f roughly –0.3
to –0.4 f , and is of the same magnitude as that observed for meddies, smeddies or swoddies (Pingree and Le Cann 1992, 1993).
200 300 400 500 In te g ra te d P ri m a ry P ro d u ct io n ( m g m -2 d -1) WB IB LB WB IB
Oligotrophic to ultraoligotrophic areas
MS
MINOS cruise (summer 1996) Sampling at ramdom
}
MS
BOUM cruise (summer 2008) Sampling at the center of
}
0 100 200
0 75 150 225 Depths of the top of the nitracline (m)
In te g ra te d P ri m a ry P ro d u ct io n ( m g m IB LB SP Gyre
Sampling at the center of anticylonic eddies
}
Fig. 9. Integrated primary production vs. depth at the top of the nitracline. Data from the MS in the western basin (WB), the Ionian basin (IB) and the Levantine basin (LB): MINOS cruise (Moutin and Raimbault, 2002) and BOUM cruise, and data from the most oligotrophic area in the world ocean, the South Pacific gyre (SP: T. Moutin, unpublished data).
3.2.2 Observed anomalies on physical and
biogeochemical properties, and time and location during formation
Table 2 reports, in addition to general properties as 1H cor-responding to the significant deepening of a specific isopy-cnal, the extreme values observed as δ differences between “in” and “out” casts for σ , θ , S and AOU. Figure 8 (middle) shows the depth profiles of each anomaly and the geopoten-tial (δG). The maximum anomalies are also indicated and
noted, as for example σE
MaxAno, without taking into account
the real sign of the anomaly which is <0 for σ , θ , AOU and
>0 or <0 for S. The depths of observed maximum anomalies
are also indicated in Table 2 using the depths of maximum density anomalies, without taking into account the possible deviations to real depths for each parameter. These changes are in any case weak (Fig. 8 middle). Higher anomalies ap-peared on S and AOU, but they are also significant on θ and
σ.
θ − Sproperties of anomalies are indicated in thick red in Fig. 2a and b for the depth range between the top and the maximum of anomalies. This shows that the depth ranges of significant anomalies are in the non-warmed part of the θ −S diagrams but not far beneath this. However, in the case of eddy B, it appeared that 2 eddies were positioned one above
the other. These 2 parts of eddy B were named Bsurfand Bdeep
for convenience. The maximum depths of anomalies corre-spond to the densest waters and the lower extremities. These
extremities are close (at least for Bdeep and C) to the θ − S
properties of the “out” station but with a difference in depth of 1H m. These anomalies are on the ochre dotted line
rep-resentative of LIW (Fig. 2b) for eddies C and Bdeep, and in
the range of winter modified Atlantic water (MAW) θ − S
properties for eddies A and Bsurf. These are indications that
all three eddies formed during a winter period.
Anomalies also help to locate the eddies during the winter of their formation. Eddy C probably formed at the same lo-cation it occupied during summer 2008 because, at the maxi-mum anomaly depth, θ −S properties correspond to the salti-est and warmsalti-est limits known for LIW (Fig. 2). However,
the characteristics of the anomalies for Bdeep cannot
corre-spond to the winter 2008 location, where estimated W-MLD reached only 109 m (Table 2), or about 200 m above the
ob-served depth range of the Bdeepanomaly. Indeed, θ − S
char-acteristics at DEMaxAnoindicate that eddy formation may have
occurred in the northern part of the Ionian basin, near the eastern Greek coast (Pelops area). The deep eddy B formed
in winter before 2008, as confirmed by low AOUEMaxAno
value near 20 µM, which indicates recent ventilation when compared to the station “out” value of circa 50 µM at the
same depth (DE
MaxAno = 600 dbars). The strong δAOUE of
around –30 µM observed in summer 2008 is consistent with the drifting of the eddy since its formation southwestwards into an area where the water is older. A 400 km drift prob-ably took more than a year, but its exact duration cannot be
estimated at present. Eddy Bsurfformed with MAW, and the
δAOUE value is consistent with the formation, or at least
ventilation, during winter 2008 when considering W-MLD 2008. Such trapping of surface outer water by an eddy, and intensification of the dynamic properties of an existing deep eddy, cannot be discussed here, but it is probably linked to an interaction between the eddy and the MAW jet. Eddy A clearly formed with MAW generally observed in the Alge-rian basin and possibly during winter 2008, considering the low AOU at depth and θ − S properties of anomalies. This eddy is the least deep of the three studied.
One main concern for biological and biogeochemical stud-ies and budgets is to know if eddstud-ies can be considered as hor-izontally closed systems dating back to the previous winter, in particular close to the surface. If anomalies in the 0–100 m range are weak, the main dynamical properties, relative vor-ticity, geopotential (see δG, Fig. 8 middle), are still different from the outer part of the eddies and a potential vorticity bar-rier up to the warmed surface subsists. As already observed by Chapman and Nof (1988), this vorticity barrier prevents any strong mixing and advection of outer water inside the eddy and explains why the depth range of eddies starts from the surface (Table 2 and SM Part C).
The core of each eddy was found at depth (Table 2) where large differences between “in” and “out” casts for S and AOU were observed (Fig. 8 top). At the centre of each eddy, a distinct pycnostad was observed which showed very little
S change against depth (100–250, 300–600, 150–380 dbars
for LD stations A, B, C, respectively). Nevertheless, a slight stratification remains inside the core of the eddies, as is shown by the non-zero T and S vertical gradients. However, for the same depths, AOU is constant (eddy C), slightly de-creasing (eddy B) or slightly inde-creasing (eddy A) while a reg-ular and more classical AOU increase outside the eddies was observed. Below the deeper depth of the core, stratification
26 28 0 100 200 300 400 500 density (k g/m 3) P re . (d b a rs ) 15 20 25 0 100 200 300 400 500 theta (°C) 200 250 0 100 200 300 400 500
oxy gen cal (m uM )
0 0.2 0.4 0 100 200 300 400 500 TChl a (m g/m 3) 0 100 s alinity 0 100 NO3 Is us (m uM ) 0 100 A OU (m uM ) 0 100 Cp (m -1)
B
26 28 0 100 200 300 400 500 density (kg/m 3) P re . (d b a rs ) 15 20 25 0 100 200 300 400 500 theta (°C) 150 200 250 0 100 200 300 400 500oxy gen cal (muM )
0 0.5 1 0 100 200 300 400 500 Tchal (mg/m3) 37 38 0 100 200 300 400 500 salinity P re . (d b a rs ) 0 5 10 0 100 200 300 400 500
NO3 Isus (muM )
-20 0 20 40 60 80 0 100 200 300 400 500 AOU (muM) 0 0.05 0.1 0 100 200 300 400 500 Cp (m-1)
A
26 28 0 100 200 300 400 500 dens ity (kg/m 3) P re . (d b a rs ) 15 20 25 0 100 200 300 400 500 theta (°C) 200 220 240 0 100 200 300 400 500 oxy gen c al (m uM ) 0 0.5 1 0 100 200 300 400 500 TChl a (m g/m 3) 39 39.5 0 100 200 300 400 500 salinity P re . (d b a rs ) -2 0 2 4 6 8 0 100 200 300 400 500 NO 3 Isus (m uM ) -20 0 20 40 0 100 200 300 400 500 A OU (m uM ) 0 0.02 0.04 0.06 0 100 200 300 400 500 Cp (m -1) 38 38.5 39 100 200 300 400 500 P re . (d b a rs ) -2 0 2 4 6 8 100 200 300 400 500 -20 0 20 40 100 200 300 400 500 0 0.05 100 200 300 400 500C
Fig. 10. Superposition of all vertical profiles vs. depth (0–500 dbars) obtained during occupation of the LD stations A, B, and C in uppermost position and from left to right: σ (kg m−3), θ (◦C), O2 (µmol kg−1), T chl a (mg m−3), and in lower position: S (PSU), ISUS nitrate concentration (µM), AOU (µmol kg−1)and Cp (m−1). The best x-axis scale is chosen for each station. The 3, 1 and 0.3 % of incident light level were reported on each graph using horizontal lines in red, green and blue, respectively.

![[PDF] Rapport de fin de stage en secrétariat bureautique PDF | Cours Bureautique](data:image/gif;base64,R0lGODlhAQABAIAAAP///wAAACH5BAEAAAAALAAAAAABAAEAAAICRAEAOw==)