- 1 -
Supplementary Material
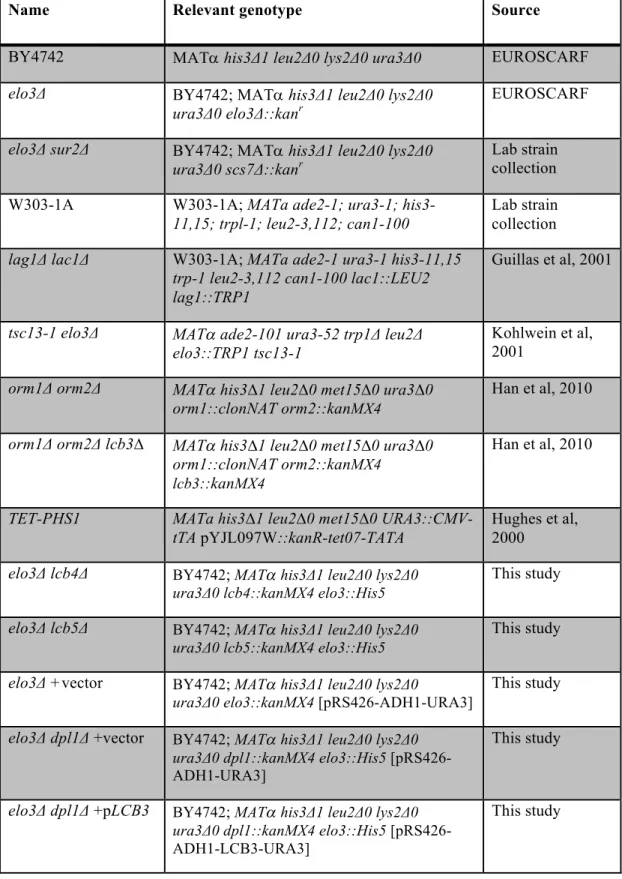
Table S1. Saccharomyces cerevisiae strains used in this study
Name Relevant genotype Source
BY4742 MATa his3Δ1 leu2Δ0 lys2Δ0 ura3Δ0 EUROSCARF
elo3Δ BY4742; MATa his3Δ1 leu2Δ0 lys2Δ0
ura3Δ0 elo3Δ::kanr EUROSCARF
elo3Δ sur2Δ BY4742; MATa his3Δ1 leu2Δ0 lys2Δ0
ura3Δ0 scs7Δ::kanr Lab strain collection
W303-1A W303-1A; MATa ade2-1; ura3-1;
his3-11,15; trpl-1; leu2-3,112; can1-100
Lab strain collection
lag1Δ lac1Δ W303-1A; MATa ade2-1 ura3-1 his3-11,15
trp-1 leu2-3,112 can1-100 lac1::LEU2 lag1::TRP1
Guillas et al, 2001
tsc13-1 elo3Δ MATa ade2-101 ura3-52 trp1Δ leu2Δ
elo3::TRP1 tsc13-1
Kohlwein et al, 2001
orm1Δ orm2Δ MATa his3∆1 leu2∆0 met15∆0 ura3∆0
orm1::clonNAT orm2::kanMX4
Han et al, 2010
orm1Δ orm2Δ lcb3∆ MATa his3∆1 leu2∆0 met15∆0 ura3∆0
orm1::clonNAT orm2::kanMX4 lcb3::kanMX4
Han et al, 2010
TET-PHS1 MATa his3∆1 leu2∆0 met15∆0
URA3::CMV-tTA pYJL097W::kanR-tet07-TATA
Hughes et al, 2000
elo3Δ lcb4Δ BY4742; MATa his3Δ1 leu2Δ0 lys2Δ0 ura3Δ0 lcb4::kanMX4 elo3::His5
This study
elo3Δ lcb5Δ BY4742; MATa his3Δ1 leu2Δ0 lys2Δ0 ura3Δ0 lcb5::kanMX4 elo3::His5
This study
elo3Δ +vector BY4742; MATa his3Δ1 leu2Δ0 lys2Δ0
ura3Δ0 elo3::kanMX4 [pRS426-ADH1-URA3]
This study
elo3Δ dpl1Δ +vector BY4742; MATa his3Δ1 leu2Δ0 lys2Δ0 ura3Δ0 dpl1::kanMX4 elo3::His5
[pRS426-ADH1-URA3]
This study
elo3Δ dpl1Δ +pLCB3 BY4742; MATa his3Δ1 leu2Δ0 lys2Δ0 ura3Δ0 dpl1::kanMX4 elo3::His5
[pRS426-ADH1-LCB3-URA3]
- 2 -
Wild Type +vector BY4741; MATa his3Δ1 leu2Δ0 met15Δ0
ura3Δ0 [pRS416, CEN-URA3]
This study
acs2Δ +pACS2 BY4741; acs2::HygMX [pHT112-1,
ACS2-CEN-URA3]
Takahashi et al, 2006
acs2Δ + pACS2-1ts BY4741; acs2::HygMX [pHT215, ACS2-1ts CEN-URA3]
Takahashi et al, 2006
acs1Δ acs2Δ +pACS2-1ts
BY4741; acs1::HIS3 acs2::HygMX [pHT215, ACS2-1ts CEN-URA3]
Takahashi et al, 2006
dpl1Δ +pRSB1 BY4742; MATa his3Δ1 leu2Δ0 lys2Δ0
ura3Δ0 dpl1::kanMX4 [pRS426,
ADH1-RSB1-URA3]
A
C
B
Supplementary Figure S1. High resolution mass spectra of [M + H]+ ions at m/z 344 of PHS vinyl ether.
A) High resolution MS2 mass spectrum of [M + H]+ ions at m/z 344 of PHS vinyl ether. B) MS3 spectra of ions at m/z 282 (344 → 282). C) MS3 spectra of ions at m/z 300 (344 → 300).
m /z 1 0 0 1 2 0 1 4 0 1 6 0 1 8 0 2 0 0 2 2 0 2 4 0 2 6 0 2 8 0 3 0 0 3 2 0 3 4 0 0 5 0 1 0 0 3 4 4 .3 3 2 6 2 8 2 3 0 8 2 6 5 3 0 0 R e la ti v e I n te n s it y ( % ) 8 0 1 0 0 1 2 0 1 4 0 1 6 0 1 8 0 2 0 0 2 2 0 2 4 0 2 6 0 2 8 0 3 0 0 0 5 0 1 0 0 2 6 4 2 5 2 2 6 5 1 3 5 2 5 4 1 2 1 1 0 9 1 4 9 2 4 7 9 5 2 8 2 R e la ti v e I n te n s it y ( % ) 8 0 1 0 0 1 2 0 1 4 0 1 6 0 1 8 0 2 0 0 2 2 0 2 4 0 2 6 0 2 8 0 3 0 0 0 5 0 1 0 0 3 0 0 2 7 0 2 6 4 2 5 4 2 4 0 1 3 5 1 0 9 1 2 3 1 4 9 2 8 2 R e la ti v e I n te n s it y ( % )
MS of m/z 344
2MS of m/z 282
3MS of m/z 300
3A
C
B
Supplementary Figure S2. High resolution mass spectra of [M - H]- ions at m/z 342 of PHS vinyl ether.
A) High resolution MS2 mass spectrum of the [M - H]- ions at m/z 342 of PHS vinyl ether. B) MS3 spectrum of ions at m/z 255 (342 → 255). C) MS4 spectra of ions of m/z 225 (342 → 255 → 225).
6 0 8 0 1 0 0 1 2 0 1 4 0 1 6 0 1 8 0 2 0 0 2 2 0 m /z 0 5 0 1 0 0 1 9 7 1 8 3 2 2 3 2 2 1 6 0 8 0 1 0 0 1 2 0 1 4 0 1 6 0 1 8 0 2 0 0 1 8 3 8 3 1 9 5 9 7 1 6 9 8 1 1 1 1 1 5 5 1 8 1 6 9 1 9 7 1 4 1 1 2 5 1 3 9 1 0 0 1 2 0 1 4 0 1 6 0 1 8 0 2 0 0 2 2 0 2 4 0 2 6 0 2 8 0 3 0 0 3 2 0 3 4 0 0 5 0 1 0 0 3 4 2 .3 2 2 5 3 0 6 1 1 6 2 0 8 3 2 4 2 5 5 7 0 9 0 1 1 0 1 3 0 1 5 0 1 7 0 1 9 0 2 1 0 2 3 0 2 5 0 0 5 0 1 0 0 2 5 3 2 3 7 1 9 7 2 2 5 2 2 3 2 2 5 2 5 5 R e la tiv e In te n si ty ( % ) R e la tiv e In te ns ity ( % ) R el at iv e In te n si ty ( % )
MS of m/z 342
2MS of m/z 255
3MS of m/z 225
4High resolution CID LIT MS
2spectrum of the [M – H]
-ion of C2-sphinganine at
m/z 342
080416-1_4 #17-34 RT:0.49-0.97 AV:18 SB:7 0.20-0.38 NL:6.45E6
T:FTMS - p ESI Full ms2 [email protected] [90.00-400.00]
100 120 140 160 180 200 220 240 260 280 300 320 340 360 m/z 0 5 10 15 20 25 30 35 40 45 50 55 60 65 70 75 80 85 90 95 100 R e la tive A b u n d a n ce 310.2762 C19H36O2N = 310.2752 239.2391 C16H31O = 239.2380 294.2814 C19H36O N = 294.2802 342.3026 C20H40O3N = 342.3014 268.2656 C17H34O N = 268.2646 100.0415 125.7616 172.9032 184.9722 C15H214.283534= 214.2666 324.2923 C20H38O2N = 324.2908 300.2919 C18H38O2N = 300.2908
A
B
Supplementary Figure S3. High resolution mass spectra of C2-dihydroceramide.
A) High resolution MS2 mass spectrum of the [M - H]- ions at m/z 342 of C2-dihydroceramide and proposed fragmentation scheme. B) High resolution MS2 mass spectrum of the [M + H]+ ions at m/z 344 of C2-dihydroceramide and proposed fragmentation scheme.
MS of m/z 342, C2-dihydroceramide
2High resolution CID LIT MS
2spectrum of the [M + H]
+ion of C2-sphinganine at m/z 344
080416-1_2 #1-14 RT:0.00-0.36 AV:14 NL:1.40E7
T:FTMS + p ESI Full ms2 [email protected] [90.00-360.00]
100 120 140 160 180 200 220 240 260 280 300 320 340 360 m/z 0 5 10 15 20 25 30 35 40 45 50 55 60 65 70 75 80 85 90 95 100 R e la tive A b u n d a n ce 326.3066 C20H40O2N = 326.3054 308.2962 C20H38O N = 308.2948 266.2854 C18H36N = 266.2842 108.7453 123.2134 148.7100 210.1897 C13H24O N = 210.1852 171.1908 C11H25N = 171.1982 344.3172 C20H42O3N = 344.3159 284.2960 C18H38ON = 284.2948
MS of m/z 344, C2-dihydroceramide
2 [M + H]- = 344 326 308 -H2O - CH2=C=O 284Scheme S2 The fragmentation pathways proposed for the [M + H]+ ions of C2-sphinganine ceramide at m/z 344
O NH2 C CH3 O H OH 1 2 3 4 -H2O -H2O 266 [M - H]- = 342 - (H2 + H2CO) 310 239 -H2O 324 O - CH2=C=O 300 324 268 294 OH N O H C CH3 O H 4 3 2 1 N C CH3 O O O NH - CH2=C=O OH NH2 O 4 3 2 1 N C CH3 O O - H2CO N C CH3 O C2-C3 bond cleavage O NH O C CH3 O H 1 2 3 4