HAL Id: hal-02382200
https://hal.archives-ouvertes.fr/hal-02382200
Submitted on 27 Nov 2019
HAL is a multi-disciplinary open access
archive for the deposit and dissemination of
sci-entific research documents, whether they are
pub-lished or not. The documents may come from
teaching and research institutions in France or
abroad, or from public or private research centers.
L’archive ouverte pluridisciplinaire HAL, est
destinée au dépôt et à la diffusion de documents
scientifiques de niveau recherche, publiés ou non,
émanant des établissements d’enseignement et de
recherche français ou étrangers, des laboratoires
publics ou privés.
Proprioceptive Inputs by Persistent Inward Currents in
Spinal Motoneurons
Marin Manuel, Claude Meunier, Maud Donnet, Daniel Zytnicki
To cite this version:
Marin Manuel, Claude Meunier, Maud Donnet, Daniel Zytnicki. Resonant or Not, Two Amplification
Modes of Proprioceptive Inputs by Persistent Inward Currents in Spinal Motoneurons. Journal of
Neuroscience, Society for Neuroscience, 2007, �10.1523/JNEUROSCI.3299-07.2007�. �hal-02382200�
Behavioral/Systems/Cognitive
Resonant or Not, Two Amplification Modes of
Proprioceptive Inputs by Persistent Inward Currents in
Spinal Motoneurons
Marin Manuel, Claude Meunier, Maud Donnet, and Daniel Zytnicki
Laboratoire de Neurophysique et Physiologie, Centre National de la Recherche Scientifique/Universite´ Paris-Descartes, Unite Mixte de Recherche 8119, 75270 Paris Cedex 06, France
Why do motoneurons possess two persistent inward currents (PICs), a fast sodium current and a slow calcium current? To answer this question, we replaced the natural PICs with dynamic clamp-imposed artificial PICs at the soma of spinal motoneurons of anesthetized cats. We investigated how PICs with different kinetics (1–100 ms) amplify proprioceptive inputs. We showed that their action depends on the presence or absence of a resonance created by theIhcurrent. In resonant motoneurons, a fast PIC enhances the resonance and amplifies the dynamic component of Ia inputs elicited by ramp-and-hold muscle stretches. This facilitates the recruitment of these motoneurons, which likely innervate fast contracting motor units developing large forces, e.g., to restore balance or produce ballistic movements. In nonresonant motoneurons, in contrast, a fast PIC easily triggers plateau potentials, which leads to a dramatic amplifica-tion of the static component of Ia inputs. This likely facilitates the recruitment of these motoneurons, innervating mostly slowly con-tracting and fatigue-resistant motor units, during postural activities. Finally, a slow PIC may switch a resonant motoneuron to nonreso-nant by counterbalancingIh, thus changing the action of the fast PIC. A modeling study shows thatIhneeds to be located on the dendrites to create the resonance, and it predicts that dendritic PICs amplify synaptic input in the same manner as somatic PICs.
Key words: proprioception; subthreshold resonance; persistent sodium current; persistent calcium current; hyperpolarization activated mixed cationic current; dynamic clamp
Introduction
The persistent sodium current (INaP) is ubiquitous in neurons
(Crill, 1996; D’Angelo et al., 1998; Kay et al., 1998). It activates below the spike threshold with a time constant of the order of the millisecond (Crill, 1996). It amplifies synaptic inputs (Schwindt and Crill, 1995) and promotes spike initiation (Kuo et al., 2006), repetitive firing (Lee and Heckman, 2001; Harvey et al., 2006a), and bursting (Wu et al., 2005). It may also enhance subthreshold resonances (Gutfreund et al., 1995; Hutcheon et al., 1996; Hutch-eon and Yarom, 2000). Many neurons (Sayer et al., 1993; Moris-set and Nagy, 2000; Kononenko and Dudek, 2006) are also en-dowed with a persistent calcium current (ICaL), mediated by
L-type channels. This current was first described in spinal mo-toneurons. As INaP, it activates below the spike threshold, but it is
slower (Schwindt and Crill, 1984; Carlin et al., 2000; Mermelstein et al., 2000; Li and Bennett, 2003). It is responsible for plateau potentials in motoneurons (Schwindt and Crill, 1980; Conway et
al., 1988; Hounsgaard and Mintz, 1988) and causes a counter-clockwise hysteresis of their current–frequency relationship (Conway et al., 1988). It is located not only in the dendrites but also in the soma (Ballou et al., 2006).
Both persistent inward currents (PICs) may augment the ef-fective synaptic current that reaches the spike initiation zone of motoneurons (Powers and Binder, 2001; Prather et al., 2001; Lee et al., 2003), thereby increasing the firing frequency (Lee and Heckman, 2000; Hultborn et al., 2003; Lee et al., 2003). In cat spinal motoneurons, they can amplify synaptic inputs elicited by muscle stretches or tendon vibration (Bennett et al., 1998; Lee and Heckman, 2000; Jones and Lee, 2006). This raises the ques-tion of the respective contribuques-tions of the two PICs to the ampli-fication of synaptic inputs. To what extent is this ampliampli-fication determined by PIC kinetics? How do fast and slow PICs interact to amplify Ia monosynaptic excitatory inputs, which arise from spindle primary endings and constitute the main proprioceptive input to motoneurons?
These issues required the comparison of EPSPs recorded with and without PICs in the same motoneuron. Moreover, the effects of fast and slow PICs had to be tested separately and concurrently. In in vivo experiments, this cannot be achieved by manipulating the natural PICs pharmacologically. We relied on dynamic-clamp experiments to add artificial currents that mimicked PICs to motoneurons of anesthetized cats, in which the natural PICs were strongly depressed (Guertin and Hounsgaard, 1999; Lee and
Received July 20, 2007; revised Sept. 14, 2007; accepted Oct. 6, 2007.
This work was supported by the Association Franc¸aise contre les Myopathies (Maladies neuromusculaires 2 2004, Grant 10737) and by the Ministe`re de la Recherche (Action Concerte´e Incitative “Neurosciences Inte´gratives et Computationnelles”). M.M. was a research fellow of De´le´gation Ge´ne´rale pour l’Armement. We are indebted to Herve´ Suaudeau for his invaluable technical assistance.
Correspondence should be addressed to Dr. Marin Manuel, Laboratoire de Neurophysique et Physiologie, Unite´ Mixte de Recherche 8119, Centre National de la Recherche Scientifique/Universite´ Paris-Descartes, 45 rue des Saints-Pe`res, 75270 Paris Cedex 06, France. E-mail: [email protected].
DOI:10.1523/JNEUROSCI.3299-07.2007
Heckman, 2000). The conductance and activation kinetics of ar-tificial PICs could be modified at will, and we assessed how the amplification of synaptic input depended on the activation time constant of the current. Our study unravels how slow and fast PICs control the amplification. Amplification involves a reso-nance created by Ih. The analysis of a simple motoneuron model
further suggests that the resonance occurs only if the dendrites are endowed with Ihcurrent and that dendritic PICs have similar
effects as somatic ones.
Materials and Methods
Animal preparation. Experiments were performed on 17 adult cats (3.2– 4.1 kg) deeply anesthetized with sodium pentobarbitone (Pentobarbital; Sanofi Recherche, Montpellier, France). In accordance with French leg-islation, the investigators had valid licenses to perform experiments on live vertebrates delivered by the Direction des Services Ve´te´rinaires (Pre´-fecture de Police, Paris, France). The animal house and the experimental room had received the agreement of the same authority. Anesthesia was induced with an intraperitoneal injection (45 mg/kg), supplemented whenever necessary (usually every 2 h) by intravenous injections (3– 6 mg/kg). Animals were paralyzed with Pancuronium Bromide (Pavulon; Organon, Puteaux, France) at a rate of 0.4 mg/h and artificially ventilated (end-tidal PCO2maintained at⬃4%). A bilateral pneumothorax
pre-vented movements of the rib cage. The adequacy of anesthesia was as-sessed on myotic pupils and on the stability of blood pressure (measured in the carotid) and of heart rate. At the onset of experiment, amoxicillin (500 mg; Clamoxyl; Merieux, Marcy l’Etoile, France) and methylprenid-solone (5 mg; Solu-Medrol; Pfizer, New York, NY) were given subcuta-neously to prevent the risk of infection and edema, respectively. The central temperature was kept at 38°C. Blood pressure was maintained above 90 mmHg by perfusion of a 4% glucose solution containing NaHCO3(1%) and gelatin (14%; Plasmagel, Roger Bellon Laboratories,
Neuilly, France) at a rate of 3–12 ml/h. A catheter allowed evacuation of urine from the bladder. At the end of the experiments, animals were killed with a lethal intravenous injection of pentobarbitone (250 mg).
The following nerves were cut, dissected, and mounted on a pair of stimulating electrodes to identify recorded motoneurons: anterior biceps and semimenbranosus taken together (ABSm), posterior biceps and semitendinosus taken together (PBSt), the plantaris nerve, the remaining part of the tibialis nerve (Tib), and the common peroneal (CP) nerve. The gastrocnemius medialis together with gastrocnemius lateralis and soleus nerves [Triceps surae (TS)] were carefully dissected and left unin-terrupted. They were mounted on a monopolar electrode for stimulation and electroneurographic recordings. The Achilles tendon, along with a bone fragment from the calcaneus, was fastened to a muscle puller (310B muscle lever; Aurora Scientific, Aurora, Ontario, Canada). This device also allowed us to record the passive muscle force. The lumbosacral spinal segments were exposed by laminectomy, and the tissues in hind-limb and spinal cord were covered with pools of mineral oil kept at 38°C. In one experiment, we injected intrathecally ZD-7288 (4-ethylphenylamino-1,2-dimethyl-6-methylaminopyrimidinium chlo-ride), a selective blocker of the Ihcurrent (Harris and Constanti, 1995;
Pape, 1996). The catheter was inserted through the dura under the ven-tral side of the spinal cord, slid at the L5 level, and gently pushed back-wards until its end reached approximately the L6/L7 limit. In in vitro preparations, concentrations of 100 –200MZD-7288 are usually ap-plied to the bath to block the Ihcurrent (Kiehn et al., 2000; Chevallier et
al., 2006). We used a much higher concentration (10 mM) because in our experimental conditions the drug was drained by the CSF and had to diffuse through a thick layer of myelinated fibers before reaching the motoneuron pools in the ventral horn.
Recordings. Part of motoneuron recordings were done using micropi-pettes (tip diameter, 2.0 –2.5m) filled with KCl at 3M(resistance, 2– 4 M⍀). It proved rather difficult to avoid spiking in these conditions. Therefore, we also used micropipettes filled with a mixture of QX-314 [2(triethylamino)-N-(2,6-dimethylphenyl) acetamine] (100 mM; Sigma, St. Louis, MO) and KCl at 3M(resistance, 3– 8 M⍀) to block sodium currents. Similar results were obtained in both cases, and therefore we
pooled the data together. Intracellular recordings of motoneurons were made using the Axoclamp 2B amplifier (Molecular Devices, Palo Alto, CA) connected to a Power1401 interface and using the Spike2 software (Cambridge Electronic Design, Cambridge, UK).
After impalement, identification of motoneurons rested on the obser-vation of antidromic action potentials in response to the electrical stim-ulation of their axon in a peripheral nerve, before blockade by QX-314. All motoneurons retained for analysis had a resting membrane potential more hyperpolarized than⫺50 mV, which varied by ⬍5 mV over the recording session. The axonal conduction velocity was computed from the latency of the antidromic action potentials. A series of small ampli-tude (⫺5 to ⫹5 nA by 1 nA increments) 500 ms square current pulses were used to measure the peak input conductance and the plateau con-ductance of the neuron. The “sag ratio” of the voltage response was then computed as the ratio of the plateau conductance over the peak conduc-tance (Manuel et al., 2005).
Dynamic-clamp-generated PICs. Recordings were done using the dis-continuous current-clamp mode (7–9 kHz) of the amplifier because it allows for reliable measurements of the membrane potential, even when large currents are injected (Brizzi et al., 2004; Prinz et al., 2004). The dynamic-clamp current IPICwas injected into the motoneuron soma
through the recording micropipette. It was computed by a personal com-puter running RT-Linux (a Linux kernel modified to achieve hard real-time processing) and the dynamic-clamp software MRCI (Raikov et al., 2004). The system allows the computation at a speed of 10 kHz of the equations IPIC⫽ gPIC⫻ w ⫻ (EPIC⫺ V),PIC⫻ dw/dt ⫽ w⬁( V)⫺ w, and w⬁( V)⫽ 1/1 ⫹ exp((V ⫺PIC)/kPIC, where gPICis the maximal conduc-tance of the PIC current, w is its activation variable, EPICits reversal
potential, V is the membrane potential,PICis the activation time
con-stant, w⬁( V) is the steady-state activation curve, PIC is the
half-activation voltage, and kPIC determines the slope of the activation
current.
We did not attempt to use supposedly realistic values for parameter-izing PICs. Indeed, PICs parameters have never been firmly established. Moreover, they are likely to vary from one motoneuron to the other. Rather, we used reasonable values allowing for a sufficient activation of IPICin response to sinusoidal currents and EPSPs generated by muscle
stretching. We set EPIC to⫹80 mV, kPIC to⫺4 mV, and the
half-activation voltage,PIC, to⬃10 mV above the resting membrane
poten-tial (Schwindt and Crill, 1984; Li and Bennett, 2003). With these param-eters, 8% of the PIC is activated at rest in steady-state conditions and 12% when the motoneuron is depolarized by 2 mV. The overlap between the activation curves of PICs and Ih, which is also partially activated at rest,
was then sufficient to allow these currents to interact. We choose gPICin the range of 25–150 nS. These values were large enough to produce substantial amplification of inputs yet small enough to avoid plateau potentials in the motoneurons that displayed substantial sag in their response to current steps.
Everything being equal, we tested the effect of artificial PICs when the activation time constant,PIC, was varied between a short value (1 ms)
and large values (up to 100 ms). The shortest time constants (1–2 ms) are comparable with the activation time constant of the persistent sodium current. Larger time constants (20 –100 ms) covered the probable range of the natural calcium persistent currents. We also successfully investi-gated the combined effect of a slow (50 or 100 ms) and a fast PIC (1 ms) in a few motoneurons in which recording conditions remained excep-tionally stable.
Muscle stretches. The triceps surae muscle was stretched with the mus-cle puller. The initial length, l0, corresponded to a passive force of 0.3 N
and was within the physiological range (Fetz et al., 1979). Two stretching protocols were used. In the sinusoidal protocol, the amplitude was con-stant (⫾0.5 mm around l0, i.e., 1 mm peak-to-peak), and, after each
cycle, the frequency of the sine wave was incremented by 1 Hz to explore the range of 1–25 Hz. We checked in four motoneurons that decrement-ing the stretch frequency from 25 to 1 Hz did not affect the results. In the ramp-and-hold protocol, the muscle was stretched, starting from l0, with a ramp of 10 mm/s until the muscle was lengthened by 1 mm. The muscle length was then held for 2 s before the muscle was shortened back to l0
to check that the two protocols efficiently activated spindle afferents. A ramp velocity of 10 mm/s was chosen because it elicited a substantial dynamic discharge of primary endings (Matthews, 1963). Recordings in motoneurons were made while the muscle was stretched, in control dition (without PIC) and for each value of the artificial PIC time con-stant. In each condition, two to five sequences of stretches were applied to the muscle with a delay of 2 s between the end of a sequence and the beginning of the next. The recordings were averaged off-line before any measurement.
Frequency–response curves. We used the impedance amplitude profile (ZAP) method to characterize the resonant behavior of the cells (Puil et al., 1988; Hutcheon and Yarom, 2000). We generated a sine wave current IZAP(t)⫽ a ⫻ sin(btk) of 10 s with the Power1401. The amplitude a was
always set to 2 nA. The frequency, which is the derivative of the phase btk,
increased as t2(k⫽ 3) from 0 to 40 Hz. We verified in five motoneurons
that the results were not affected when the frequency increased linearly (k⫽ 2) and when the frequency decreased in time. We recorded at least three voltage responses in control condition (without artificial PIC) and for each value ofPIC. Each series was averaged off-line. We then
calcu-lated the ratio of the fast Fourier transforms of the voltage response and of the ZAP current input, and we plotted its modulus against the fre-quency, yielding the frequency–response curve (FRC). This curve was smoothened by a running average with a window of 2 Hz. A resonance of the neuron corresponded to a peak of the FRC at a preferred frequency (Hutcheon and Yarom, 2000). The acuity of the resonance was quanti-fied by the quality factor Q, defined as the ratio of the frequency response at the resonance frequency to the response at low frequency (in our case, 1 Hz). When there was no resonance, Q was set to 1.0.
Modeling. To investigate how the somatic and dendritic components of Ihand of fast and slow PICs affected the FRC of motoneurons, we
computed the impedance Z() of a motoneuron model. We used a vari-ant of Rall’s model (Rall, 1959) with active conductances. The detailed morphology of the neuron was not taken into account, dendrites being simply described by an equivalent cylinder of diameter d, length l, and axial resistivity Ri, with sealed distal end. The somatic and dendritic
voltages, VSand VD, were governed by the coupled equations: CmS
dVS
dt ⫽ GlSS共VlS⫺ VS兲 ⫹ GhSSzh共Vh⫺ VS兲 ⫹ GPICSSzPIC共VPIC ⫺ VS兲 ⫹d 2 4Ri ⭸VD共0,t兲 ⭸x ⫹ IS共t兲 (1) Cm ⭸VD
⭸t ⫽GlD共VlD⫺ VD兲 ⫹ GhDzh共Vh⫺ VD兲 ⫹ GPICD zPIC共VPIC⫺ VD兲 ⫹4Rd
i
⭸2VD
⭸x2 , (2)
where Cmis the specific capacitance, S is the membrane area of the soma,
and IS(t) is the current injected into the soma through the micropipette.
The somatic and dendritic leak current had conductance per unit area GlS
and GlVand reversal potentials VlSand VlD. The somatic Ihcurrent had
reversal potential Vhand maximal conductance GhS(per unit area). Its
activation variable, zh, followed the kinetic equation:
h
dzh
dt ⫽ zhSS共V兲 ⫺ zh, (3)
where zhSS( V) was the steady-state activation of the current. The dendritic
Ihcurrent had same kinetics. Its conductance was uniform and equal to
GhD. Similarly, the somatic and dendritic components of the PIC had
maximal conductance GPICS,Dand reversal potential VPIC. The evolution of
the activation variable zPICwas governed by: PIC
dzPIC
dt ⫽ zPICSS共V兲 ⫺ zPIC. (4)
We adjusted GlS,Dand VlS,Dto guarantee that the resting potential of the
soma and dendrites was the same (VS⫽ VD⫽ 0) and that the resting
conductance (per unit area), GlS,D⫹ GhS,D⫻ zSSh(0)⫹ GPICS,D⫻ zPICSS (0),
took the same value, Grest, everywhere. The space constant of the
den-dritic cable was then
⫽
冑
d/4RiGrest,and its electrotonic length L⫽ l/.
Because the injected current distributes in the soma and in the den-drites, the admittance Y() ⫽ 1/Z() of the motoneuron model is the sum of the admittances of the soma and of the dendrites. The admittance of the soma YS共兲 ⫽ G restS共1 ⫹ im兲 ⫺ GhSS dzhSS共0兲 dV Vh 1 1⫹ ih ⫺ GPICSS dzPICSS共0兲 dV VPIC 1 1⫹ iPIC , (5)
was computed by linearizing Equations 1– 4 around the resting state and taking the Fourier transforms of the resulting equations. Because the contribution of Ihwas determined not only by its contribution to the resting conductance Grest but also by its driving force Vh and by its propensity to deactivate during membrane depolarization, the strength of the somatic Ihis quantified by the dimensionless parameter KhS⫽
(GhS/G
rest)(dzh
SS(0)/dV )V
h. This parameter is negative because Ihopposes
membrane depolarization. Similarly, the strength of the somatic PIC is quantified by KPICS ⫽ (G
PIC
S /G
rest)(dzPIC
SS (0)/dV )V
PIC, which is positive
because membrane depolarization increases the activation of PICs. A similar procedure yielded the admittance of the dendritic cable at its proximal end (Jack et al., 1983; Koch, 1984). Introducing the dimension-less parameters KhDand K
PIC
D , which are the dendritic equivalents of K h S
and KPICS , we obtained
YD共兲 ⫽ G
restdq共兲tanh共q共兲L兲, (6)
where
q共兲 ⫽
冑
1⫹ im⫺ KhD/1⫹ ih⫺ KPICD/1⫹ iPIC.The slope conductances, GS⫽ G
rest S (1⫺ K h S⫺ K PIC S ) and GD⫽ G
restd
冑
1⫺ KhD⫺ KPICDtanh共L冑
1⫺ KhD⫺ KPICD兲,of the soma and dendrites were obtained by setting to 0 in Equations 5 and 6.
If the current is injected in the dendrites, the voltage response of the soma is given by the transfer impedance of the model. Assuming uniform current injection and defining the transfer impedance as the ratio of the somatic depolarization to the current injected per space constant of den-drite, we obtained Ztrans共兲 ⫽ R⬁ q2共兲
冉
1⫺ 1 cosh共q共兲 L兲 ⫻ YS共兲 YS共兲 ⫹ YD共兲冊
,where R⬁⫽ 1/dGrestis the input resistance of a semi-infinite cable with membrane conductance Grest.
In addition, we computed the sag produced by Ih. In the absence of PICs, the sag ratio, R, is the ratio of the slope conductance of the mo-toneuron, GS⫹ GD, which takes into account the deactivation of I
h, to
the resting conductance GrestS⫹ Grestdtanh(L), which does not take that deactivation into account. It follows that
R⫽ 共1 ⫹兲共1 ⫺ Kh
S兲
1⫹共1 ⫺ KhS兲tanh共L兲/
冑
1⫺ KhDtanh共L冑
1⫺ KhD兲,
where the coefficient of dendritic dominance is the ratio GD/GSof the
input conductance of the dendrites at their proximal end to the input conductance of the soma alone.
Results
Fast and slow PICs amplify EPSPs in different frequency bands
In a first step, we investigated how the amplification of EPSPs by PICs depended on their time course and on the kinetics of the PICs. We ap-plied a series of sinusoidal stretches to the tendon of the TS while inject-ing an artificial PIC at the soma of a TS motoneuron. The frequency was increased from 1 to 25 Hz by steps of 1 Hz (Fig. 1). Because of the high dynamic sensitivity of muscle spin-dles, Ia afferents discharged at a higher rate (Fig. 1, inset) and more synchronously as the stretch fquency was increased. This was re-flected in the time course of the EP-SPs elicited in TS motoneurons, which changed from slowly varying, low-amplitude EPSPs at the lowest stretch frequencies to narrow, high-amplitude EPSPs at the highest fre-quencies (Fig. 1 A1).
For the first stretch cycle (1 Hz), the peak-to-peak amplitude of the EPSP increased from 1.5 mV in con-trol condition (no PIC) to 2.0 mV when a slow artificial PIC (gPIC⫽
100 nS,PIC ⫽ 50 ms) was added
(Fig. 1 A2). The gain of the
amplifi-cation, defined as the ratio of the EPSP amplitude in the presence of PIC to the control EPSP amplitude, was⬃1.4. As shown in Figure 1B, it
steadily declined as the frequency increased from 1 to 4 Hz. Above 4 Hz, EPSPs were barely amplified. In contrast, with a faster PIC (PIC⫽ 10 ms) (Fig. 1A3), the gain was⬃1.4 over most
of the frequency range, decreasing to 1.2 only above 20 Hz. A still faster PIC (PIC⫽ 1 ms) (Fig. 1A4) amplified all EPSPs by⬎1.5.
Interestingly, the maximum amplification (2.1) was reached for intermediate frequency stretches (15 Hz in this case) (Fig. 1 A4,
arrow).
We recorded the responses of 10 TS motoneurons to sinusoi-dal stretches. In nine of them, artificial PICs with a time constant of 1 ms produced the maximal amplification at stretch frequen-cies between 7 and 15 Hz (12⫾ 3 Hz). The maximal gain ranged from 1.3 to 3.2 (2.1⫾ 0.6). In the 10th motoneuron, the gain was ⬃1.9 at all frequencies. In contrast, for slow PICs, amplification was always maximal at the lowest frequency (1 Hz) and remained moderate. ForPIC⫽ 100 ms, it ranged from 1.1 to 1.4 (1.2 ⫾ 0.1)
in the 10 motoneurons. APICof 50 ms was also tested in six of
them, leading to similar results. The amplification at 1 Hz ranged from 1.2 to 1.4 (1.3⫾ 0.1).
A slow PIC, mimicking a persistent calcium current, thus acts as a low gain and low-frequency amplifier. In contrast, a fast activating PIC, mimicking a persistent sodium current, operates over a broad frequency range and strongly amplifies the EPSPs elicited by stretches in the 7–15 Hz range.
The remainder of Results analyzes the mechanisms and the functional consequences of this differential amplification of
in-puts by fast and slow PICs. We first show that most spinal mo-toneurons display a resonance attributable to the Ihcurrent. We
then investigate, in resonant motoneurons, how fast and slow PICs modify the resonance properties, and we study the conse-quences on the amplification of the dynamic and static compo-nents of Ia inputs elicited by ramp-and-hold muscle stretches. We then study the case of nonresonant motoneurons and show that input amplification by fast PIC then relies on plateau poten-tials. Finally, we show that, when both PICs operate together in a resonant motoneuron, the slow PIC may cancel the resonance, thus altering the way in which the fast PIC amplifies inputs.
Most motoneurons display a subthreshold resonance
To demonstrate the presence of a subthreshold resonance, we analyzed the voltage response to a ZAP current of time-varying frequency (see Materials and Methods) in 45 motoneurons [15 ABSm, 3 PBSt, 22 TS, 4 CP, 1 Tib, Gin⫽ 0.8 ⫾ 0.3S (0.4–1.8
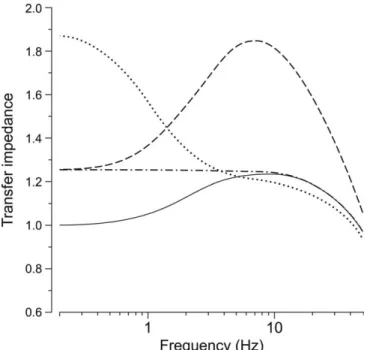
S)] and computed their FRC. A typical example is shown on Figure 2. A sine wave current with a 4 nA peak-to-peak amplitude and a frequency increasing from 0 to 40 Hz in 10 s was injected into the motoneuron. The voltage followed the current varia-tions, but its peak-to-peak modulations were not constant (Fig. 2 A). They increased from 4.0 mV at low frequency to 4.6 mV at 12 Hz and then decreased. Accordingly, the FRC displayed a max-imum (Fig. 2 B), which constitutes the very definition of a reso-nance. The impedance,⬃0.8 M⍀ at 1 Hz, steadily increased with the ZAP frequency until it approached 1.1 M⍀ at the resonance frequency fr⫽ 12 Hz (Fig. 2B, vertical line). Past this frequency,
Figure 1. Amplification of the EPSPs induced by sinusoidal stretches of the TS muscle. A, Control condition (no artificial PIC, A1) and
effect of an artificial PIC (gPIC⫽ 100 nS, A2–A4). Bottom traces, Variations of the muscle length when the frequency increases from 1 to 25
Hz. Top traces, Intracellular record of a TS motoneuron (average of 3 recordings). Dashed line, Resting potential in control condition. Hyperpolarization of the baseline at high frequencies was likely attributable to the deactivation of Ih. B, Amplification gain against stretch
frequency. Filled circles,PIC⫽50ms;opentriangles,PIC⫽10ms;filledtriangles,PIC⫽1ms.Gin⫽1.1S.Axonalconductionvelocity,
90 m/s. Inset, Response of a TS spindle primary ending. Bottom, Muscle length. Middle, Extracellular recording of an Ia afferent within the dorsal column. Top, Instantaneous frequency of the discharge. This afferent fiber was identified as an Ia fiber because: (1) its conduction velocity was 90 m/s; (2) although the receptor was silent at the initial length, a spontaneous stationary discharge at⬃10 Hz was observed when the length was increased by 160m (data not shown); (3) the frequency modulations increased with the stretch frequency because of the dynamic sensitivity of the primary ending.
the impedance dropped rapidly because of passive filtering. In the motoneuron illustrated, the quality of the resonance was Q⫽ 1.3, which is in the same order of magnitude as reported in other types of neurons (Hutcheon et al., 1996). We observed a similar reso-nance in 39 motoneurons (87% of the sample), at a frequency ranging from 6 to 20 Hz (11⫾ 3 Hz) and with a quality factor between 1.1 and 1.7 (1.3⫾ 0.2). The six other neurons, which displayed no resonance, are analyzed in below (see Effects of PICs in nonresonant motoneurons).
The subthreshold resonance is attributable to Ih
In motoneurons, the Ihcurrent, which produces the sag in the
voltage response to current steps (Ito and Oshima, 1965; Taka-hashi, 1990; McLarnon, 1995), is a very likely candidate to induce resonance, because it opposes voltage changes (Hutcheon and Yarom, 2000; Richardson et al., 2003). To test whether it is indeed responsible for the resonance, we applied intrathecally the selec-tive blocker ZD-7288 (see Materials and Methods). We injected five small boluses (⬃200l) over the course of 4 h. During that period, we determined the FRC of six motoneurons (four PBSt, two TS). The first three motoneurons, recorded 30 –50 min after starting the drug injection, displayed a sag in response to hyper-polarizing current steps and a resonance in response to ZAP cur-rents. In sharp contrast, the three following, recorded 70 min to 3 h after the start of the injection, exhibited no sag and their FRC showed no resonance. Given the small fraction of motoneurons that had no resonance in our control sample (13%), the proba-bility to record three consecutive nonresonant neurons by chance was very low (0.002). It is much more likely that the ZD-7288 took⬎1 h to block the Ihcurrent and to suppress the resonance.
To confirm the role of Ih, we studied the voltage dependence
of the resonance by shifting the membrane potential by direct current injection. As shown in Figure 3A, starting from a hyper-polarized level (⫺80 mV), the quality factor decreased as the resting membrane potential became more and more depolarized (from 1.3 at⫺80 mV to 1.1 at ⫺60 mV in the example shown). This trend was seen in 10 of the 12 motoneurons tested (Fig. 3B) and is consistent with the activation curve of the Ihcurrent, which
is only partially activated at the resting potential and is deacti-vated by membrane depolarization. Typically, the resonance was lost when the motoneuron was depolarized by⬎10 mV. The voltage dependence of the resonance excludes that an outward current, such as IM, could be responsible for it. Indeed, the
acti-vation of this current with membrane depolarization would have increased the quality factor (Hu et al., 2002).
Last, we found that the quality factor was strongly correlated with the voltage sag in the population of 45 motoneurons in which the resonance was investigated (r⫽ 0.80; p ⬍ 0.001), as shown in Figure 4. In motoneurons with large sag, i.e., with large
Ihcurrent, the quality factor of the resonance was higher than in
those with small sag. The six motoneurons without subthreshold resonance (open circles) also displayed little to no sag (sag ratio smaller than 1.2). They had a low input conductance [0.5⫾ 0.2 S (0.4–1.0 S); n ⫽ 6]. Therefore, they were likely slow-type motoneurons, innervating slowly contracting muscle fibers (Burke, 1981) and presenting little Ihcurrent (Gustafsson and
Pinter, 1984).
Ihmust be localized in the dendrites to produce a resonance
Motoneurons possess extensive dendritic trees that account for most of the membrane area. Their coefficient of dendritic dom-inance is estimated to be of the order of 10 (Fleshman et al., 1988). Dendrites thus account for⬃90% of the input conduc-tance of motoneurons. Moreover, the electrotonic length of these dendrites, l, is estimated to be of the order of 1.5, which entails that motoneurons are not electrotonically compact. This raises the issue of whether the voltage sag and the membrane resonance observed in motoneurons are attributable to a somatic or to a dendritic Ihcurrent. To investigate this question, we computed
the sag ratio and the impedance curve of the motoneuron model described in Materials and Methods.
We first assumed that dendrites were passive, that the Ih
cur-rent was restricted to the soma, and that no PIC was present in the soma and in the dendrites. When we set the strength KhSof the
somatic Ihto⫺0.5, the impedance curve displayed a very weak
resonance (Q⬇ 1.04) at 5 Hz (Fig. 5A, solid line), and the sag ratio at the soma was only R⫽ 1.03 (Fig. 5B, point a). This is because the somatic Ihcurrent cannot counterbalance the current
leak to the dendrites. When the somatic conductance GhSwas
doubled, R increased only to 1.05. Actually, R was always smaller than 1.1 for ⫽ 10. Thus, when dendrites are passive, the model shows little to no sag, and no clear resonance is observed.
This suggested that the dendrites must be endowed with a substantial Ihcurrent. When Ihwas put in both the soma and the
dendrites of the model, the sag ratio grew with the ratio GhD/GhSof
the conductances of the dendritic and somatic components of Ih,
as shown in Figure 5B. When the somatic and dendritic Ihhad the
same conductance per unit area, the voltage sag measured at the soma was⬃1.3 (Fig. 5B, point b), and the impedance curve dis-played a clear resonance (Fig. 5A, dashed line). Doubling the conductance of the dendritic Ihcurrent increased the sag ratio to
1.5 (Fig. 5B, point c), augmented the quality of the resonance by 17%, and shifted frfrom 9.3 to 10.5 Hz (Fig. 5A, dash-dotted
line). Suppressing the somatic Ihcurrent had a lesser impact on
the resonance, decreasing the quality factor and the resonant frequency by⬍10% (Fig. 5A, dotted line d).
Experimental values of the sag ratio, of the resonance fre-quency, and of the quality factor (1.4⫾ 0.2, 11 ⫾ 3 Hz, and 1.3 ⫾ 0.2, respectively; n⫽ 39) are obtained in the model only if den-drites are endowed with enough Ihcurrent. In addition,
increas-ing the somatic Ihcurrent has little effect on the sag ratio and the
resonance of the model. This is in agreement with dynamic-clamp experiments performed in five motoneurons, in which we added an artificial Ihcurrent at the soma (h⫽ ⫺90 mV,h⫽ 100
ms, kh⫽ 10 mV, Eh⫽ ⫺30 mV, gh⫽ 0.2–0.3S; same equations
as those described in Materials and Methods for PICs). As pre-dicted by the model, the artificial somatic Ihdid not significantly
modify the sag ratios (1.20⫾ 0.05 vs 1.26 ⫾ 0.04; n ⫽ 5; p ⫽ 0.17),
Figure 2. Subthreshold resonance in a motoneuron. A, Voltage response (average of 4 re-cordings, top trace) to a ZAP current (bottom trace) of constant amplitude (4 nA peak-to-peak) and increasing frequency (from 0 to 40 Hz; see Materials and Methods). B, Impedance com-puted as the ratio of the fast Fourier transforms of voltage and current. Peak at 12 Hz indicates the resonance (dashed line). Same motoneuron as in Figure 1.
the resonance frequencies (12⫾ 4 vs 12⫾ 5; n ⫽ 5; p ⫽ 0.60), or the Q factors (1.2⫾ 0.1 vs 1.2 ⫾ 0.1; n ⫽ 5;
p⫽ 0.68).
Fast and slow PICs have opposite effects on the resonance
What is the impact of PICs on the subthreshold resonance? We added an artificial PIC to 22 motoneurons, taken among the 39 that displayed a subthreshold resonance in the con-trol condition. The PIC conduc-tance was chosen in the 25–150 nS range (see Materials and Methods), and we varied its activation time constant from 1 to 100 ms. The ef-fects of such PICs are illustrated in Figure 6. Compared with the con-trol response (Fig. 6 A1), adding a
slowly activating PIC (gPIC ⫽ 100
nS;PIC⫽ 50 ms) induced a slight depolarization of the resting
membrane potential and a visible amplification of the voltage response at low frequency (Fig. 6 A2). The FRC changed from a
curve peaked at the resonant frequency ( fr⫽ 12 Hz) (Fig. 6B,
thin solid line) to an almost flat profile in the low-frequency region below fr(dashed line). Q decreased by 23%, from 1.3 to
1.0. Adding the slowly activating PIC decreased the quality factor in 19 motoneurons of 22. Reductions of 10 –26% were seen in 11 of them, and the resonance was even abolished in six motoneu-rons. In average, Q decreased significantly from 1.3⫾ 0.2 in the control case to 1.2⫾ 0.2 (1.0–1.7) (n ⫽ 22; paired Student’s t test,
p⬍ 0.0001).
Adding a fast PIC (PIC⫽ 1 ms) had a totally different impact
on the voltage response (Fig. 6 A4). All frequencies were amplified
compared with control and particularly the intermediate fre-quencies (Fig. 6 B, thick line). At 1 Hz, the amplification was approximately the same as with a slow PIC (impedance of 1.1 M⍀), but it increased rapidly with the frequency, the impedance reaching 1.6 M⍀ near the resonant frequency. The net effect of adding a fast activating PIC was to enhance the resonance. In the motoneuron illustrated, Q increased by 16%, from 1.3 to 1.5. The enhancement was significant over the whole population tested, the quality factor increasing to 1.4⫾ 0.3 (1.1–2.3) (n ⫽ 22; p ⫽ 0.03). It increased by⬎10% in 10 motoneurons and even reached 78% in one of them. In contrast, the average resonance frequency did not change significantly (11⫾ 3 Hz; n ⫽ 22; p ⬍ 0.001).
As the PIC time constant was varied between 1 and 100 ms, we observed a smooth transition of the FRC between the two ex-treme cases presented above. ForPIC⫽ 10 ms (Fig. 6A3), the
FRC was the same as forPIC⫽ 1 ms for frequencies lower than 4
Hz, but at higher frequencies it lied between the FRCs forPIC⫽
1 ms andPIC ⫽ 100 ms (Fig. 6B, dotted line). As such, two
regimens could be distinguished: the faster PICs (PIC⬍ 20 ms)
enhanced the resonance, whereas the slower PICs (PICⱖ 20 ms)
counteracted the effect of Ihand tended to cancel the resonance.
These two amplification modes can be ascribed to persistent so-dium currents (activation time constant⬃1–2 ms) and calcium persistent currents (activation time constant larger than 20 ms), respectively.
Can we understand the amplification of the EPSPs induced by muscle stretches in resonant motoneurons on the basis of their FRC? To answer this question, we compared the amplification of
EPSPs with the impedance changes that PICs elicited in nine motoneurons, in which we performed both ZAPs and muscle stretches protocols. We characterized the frequency dependence of the amplification of sinusoidal currents by the ratio of the impedance with PIC to the impedance without PIC. As shown in Figure 6C, the amplification of sinusoidal currents displayed striking similarities with the amplification of EPSPs elicited by sinusoidal muscle stretches (Fig. 1 B). In both cases, a slow PIC increased the gain in the low-frequency region, whereas a fast PIC increased the gain over the whole frequency range but preferen-tially around the resonance frequency. The response to an input of given frequency was proportional to that input and to the impedance at that frequency, in accordance with Ohm’s law.
Dendritic PICs have similar effects on the resonance as somatic PICs
We examined in the motoneuron model whether the dendritic component of PICs had a similar effect on the impedance as the somatic component. Current was uniformly injected all along the dendritic cable, and we computed how the transfer impedance from the dendrite to the soma was modified by a dendritic PIC.
Figure 4. Resonance quality was linearly correlated to sag ratio. Quality factor against sag ratio for 45 motoneurons. Dashed line, Best linear fit. Open circles, The six motoneurons without resonance.
Figure 3. Membrane hyperpolarization increases the resonance quality. A, Voltage (top) and modulus of the impedance (IZI) (bottom) in response to the same ZAP (middle) at⫺80 mV (left), ⫺71 mV (resting potential; middle), and ⫺60 mV (right). TS motoneuron; Gin⫽
1.2S; conduction velocity, 100 m/s. B, Quality factor variations (Q ⫺ Qrest)/Qrestagainst holding potential (relative to rest). Neurons are
identified by different symbols (filled circles, neuron in A). For two motoneurons, the resonance was maximal at rest and decreased during hyperpolarization (bottom left quadrant). Ihwas likely fully activated at hyperpolarized levels and became insensitive to voltage changes.
The transfer impedance is plotted in Figure 7 in control con-dition (no PIC), and with fast PIC or slow PIC added. A fast PIC (PIC⫽ 1 ms) of same strength as the dendritic Ihcurrent (KPICD ⫽
0.5) increased the impedance over the whole frequency range displayed, and the quality factor of the resonance augmented by 20% (dashed line) compared with control (solid line). In con-trast, a slow PIC (PIC⫽ 100 ms) of the same strength increased
the impedance below 10 Hz and canceled the resonance (KPICD ⫽
0.5) (dash-dotted line). The impedance was then the same as for a passive membrane. This is because the slow PIC compensates exactly the effect of the Ihcurrent on the dendritic admittance.
When the conductance of the slow PIC was doubled, the transfer impedance was strongly increased at very low frequency, and the impedance curve decreased monotonically as the frequency in-creases (dotted line).
This shows that dendritic PICs have the same effects on the resonance as somatic PICs. These effects are quite substantial when the intensity of the PIC is comparable with the intensity of the Ihcurrent. These results suggest that both the somatic and
dendritic components of PICs affect the resonance properties of motoneurons.
Consequences for the amplification of the dynamic and static components of Ia inputs in resonant motoneurons
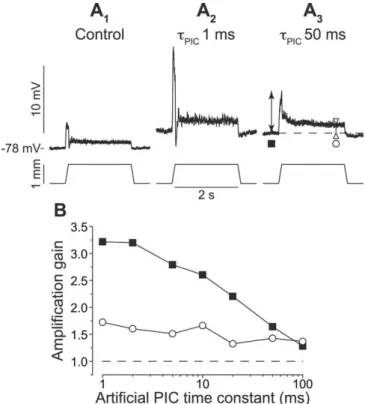
Spindle primary endings exhibit a high dynamic sensitivity to stretches (Matthews, 1964). Accordingly, muscle stretches pro-duce a complex input to motoneurons, displaying both dynamic and static components. We used ramp-and-hold protocols (see Materials and Methods) to separate these two components of the voltage response and to study how each of them was amplified by PICs.
Experiments were performed in 11 resonant TS motoneurons [Gin⫽ 0.9 ⫾ 0.3S (0.5–1.4 S)]. A typical example is shown in
Figure 8. In the control response (without PIC) to a 10 mm/s stretch, the dynamic and static components had respective am-plitudes of 3.9 and 0.9 mV (Fig. 8 A1). A fast PIC (gPIC⫽ 100 nS;
PIC⫽ 1 ms) (Fig. 8A2) strongly amplified the dynamic
compo-nent, which increased to 12.6 mV, more than thrice the control amplitude. The static component was much less amplified, in-creasing only to 1.5 mV, 1.7 times the control response. In con-trast, a slow PIC (PIC⫽ 50 ms) (Fig. 8A3) amplified the dynamic
component by only 1.6, barely more than the static component (1.4). Figure 8 B shows how the amplification of the dynamic and static components depended on the PIC time constant. The static component was amplified by⬃1.5, regardless ofPIC. In sharp
contrast, the dynamic component was less and less amplified as
Figure 5. Modeling the impact of the dendritic Ihcurrent on the resonance properties. A, FRC
curve (semilogarithmic scale). The modulus of the impedance (IZI) is normalized to 1 at zero frequency. It is shown for four distributions of Ihin the soma and dendrites: a, Passive dendrites
(with 5 ms time constant), somatic Ihof strength Kh
S⫽ ⫺0.5, and activation time constant h
⫽100ms(solidline).b,SameconductanceoftheIhcurrent in the soma and in the dendrites (Kh S
⫽ Kh
D⫽ ⫺0.5; dashed line). c, Conductance of the dendritic I
hdoubled (Kh
D⫽ ⫺1;
dash-dotted line). d, No somatic Ih(Kh S⫽ 0, K
h
D⫽ ⫺0.5; dotted line). B, The sag ratio at the soma, R,
is displayed against the ratio of the dendritic and somatic conductances of the Ihcurrent. The
black dots labeled from a to c correspond the first three distributions of Ihconsidered in A.
Figure 6. Changes in FRC elicited by artificial PICs. A1–A4, Bottom, ZAP. Top, Voltage
(aver-age of 3– 4 records). Dashed line, Resting potential in control condition. B, Control FRC (thin solid line) and FRC with PIC.PIC⫽1ms(thicksolidline),10ms(dottedline),or50ms(dashed
line). C, Amplification gain against frequency (ratio of FRC with PIC to control FRC). Same symbols as in B. Horizontal line indicates no amplification. Same motoneuron as in Figures 1 and 2.
Figure 7. Impact of dendritic PICs on the transfer impedance from the dendrite to the soma in the motoneuron model. The transfer impedance ( Ztrans) is plotted against the frequency:
control (no PIC, Kh S⫽ 0, K
h
D⫽ ⫺0.5; solid line), fast PIC (
PIC⫽ 1 ms, KPIC
D ⫽ 0.5; dashed line),
slow PIC (PIC⫽100ms)ofsamestrength(KPIC
D ⫽0.5;dash-dottedline),anddoubledstrength
(KPIC
PICwas increased. For time constants larger than 50 ms, dynamic
and static components were amplified in the same way. Similar results were obtained in the 11 motoneurons investigated. Fast PICs (PIC⫽ 1 ms) preferentially affected the dynamic
compo-nent of the Ia input, which was amplified 1.2–3.4 times more than the static component (mean 1.9⫾ 0.6; n ⫽ 11; p ⫽ 0.0004).
Effects of PICs in nonresonant motoneurons
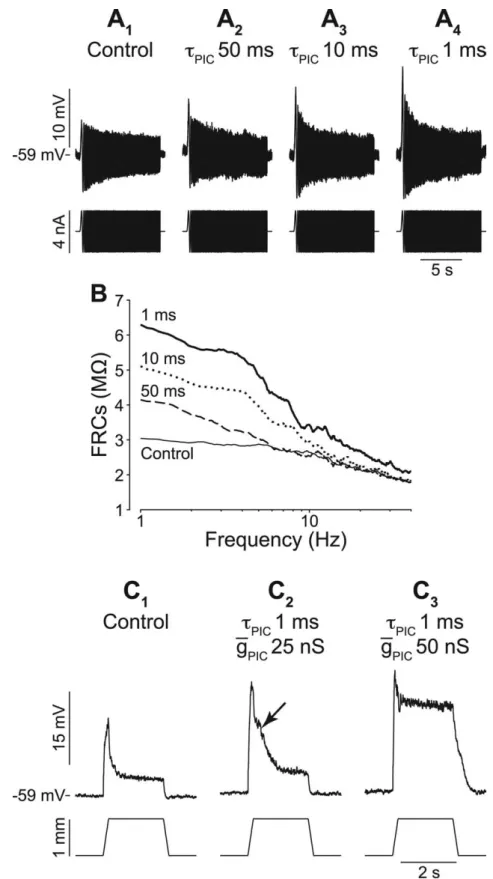
We tested the effect of PICs on four of the six motoneurons that displayed no resonance. As illustrated in Figure 9, the amplifica-tion at low frequency increased as the time constant of the PIC decreased (gPIC⫽ 100 nS) (Fig. 9A,B). The same result was
ob-tained in the four nonresonant motoneurons. This is the opposite of what we observed in resonant motoneurons (Fig. 6 B), in which decreasing the PIC time constant did not affect the gain at low frequency. This strong amplification at low frequency results from a substantial activation of the PIC in nonresonant mo-toneurons, although we used the same relative PIC conductance (gPIC/Gin, 0.13⫾ 0.06; n ⫽ 4) as in the resonant ones (0.11 ⫾ 0.04;
n⫽ 22).
This had a drastic impact on the response to ramp-and-hold stretches. The motoneuron illustrated in Figure 9C is the only nonresonant motoneurons in which we could record responses to ramp-and-hold stretches. A fast PIC (PIC⫽ 1 ms) with a
conductance of 25 nS (Fig. 9C2) amplified only moderately the
dynamic component to 23.2 mV (gain of 1.4). On the falling phase of the dynamic response, a hump (arrow) was visible, be-cause PIC activation outlasted the dynamic component. When the maximal conductance was increased to 50 nS (Fig. 9C3), the
amplification of the dynamic component was almost the same. However, the dynamic component triggered a plateau potential that persisted throughout the hold phase and disappeared only when the muscle was shortened back. This plateau potential led to a strong amplification of the static component (from 3.3 to 17.8 mV). It stemmed from the activation of the voltage-dependent PICs that could not be counterbalanced by the Ih
cur-rent in these nonresonant motoneurons.
Resonant amplification or not? The action of the fast PIC depends on whether or not the resonance is abolished by the slow PIC
In three resonant motoneurons, we could add simultaneously a fast and a slow artificial PIC. The impact of the fast PIC was modified by the slow PIC, as shown in Figure 10. In this TS motoneuron, a slow PIC alone (PIC⫽ 100 ms) with a
conduc-tance of 150 nS abolished the resonance (Fig. 10 A2,B, dashed
line), whereas a fast PIC alone (PIC⫽ 1 ms, gPIC⫽ 50 nS)
en-hanced it (Fig. 10 A3,B, dotted line). When both fast and slow
PICs were added, the maximal amplification no longer occurred at the resonant frequency. The FRC had the same shape as when the slow PIC was acting alone but was shifted upward. The max-imal effect was observed at low frequencies. At 1 Hz, the amplifi-cation factor was 1.7 when both PICs were present compared with 1.3 when the fast PIC was acting alone. We obtained similar results in the two other motoneurons. This suggests that the fast PIC amplify preferentially inputs either around the resonant fre-quency or at low frefre-quency, depending on whether or not the resonance is canceled by the slow PIC.
These modifications of the FRC had a strong impact on the processing of Ia inputs elicited by a ramp-and-hold stretches. Alone, the slow PIC (Fig. 10C2) moderately amplified the
dy-namic and static components of the response with respect to control (1.4 and 1.3, respectively). The fast PIC (Fig. 10C3)
strongly amplified the dynamic component (2.2) but not the static component. When both PICs were present (Fig. 10C4), the
amplification of the dynamic component was little affected (2.1), but an aborted plateau potential was observed during the static response (arrow), which was substantially enhanced. Similar re-sults were obtained in another motoneuron. This indicates that the slow PIC can switch EPSP amplification by fast PICs from a preferential amplification of the dynamic component to a mode in which the static component is also amplified because of the apparition of plateau potentials.
Discussion
We show that most motoneurons display a subthreshold reso-nance attributable to the Ihcurrent. In resonant motoneurons,
PICs do not elicit plateau potentials, and the amplification of synaptic inputs is determined by changes of the membrane im-pedance. A slow PIC, mimicking ICaL, amplifies EPSPs by
increas-ing the impedance at low frequency, reducincreas-ing the resonance. In sharp contrast, a fast PIC, mimicking INaP, acts as a broadband
amplifier with higher gain near the resonance frequency. It am-plifies the dynamic component of the Ia input more than the static response. In nonresonant motoneurons, which innervate slow contracting muscle fibers and are deprived of Ihcurrent, the
fast PIC can trigger plateau potentials. These plateau potentials, sustained by the persistent activation of both INaPand ICaL,
am-plify the static response more than the dynamic one. This also occurs in motoneurons that innervate fast contracting muscle fibers when the slow PIC is strong enough to abolish the resonance.
Figure 8. Differential amplification of dynamic and static components of Ia input elicited by a ramp-and-hold stretch. A1–A3, Bottom, Muscle length. Top, EPSPs (average of 3– 4 records)
in control condition (no PIC, A1) and with a fast (A2) or a slow (A3) PIC. Dynamic response
measured by the peak amplitude (filled arrow). Static response measured by average amplitude over the last 500 ms of holding (open arrow). B, Amplification of dynamic (filled squares) and static (open circles) components againstPIC. TS motoneuron; Gin⫽
Resonance and Ihcurrent
We report for the first time a subthreshold resonance in mam-malian spinal motoneurons and provide evidence that Ih
under-lies this resonance, as in many types of neurons (Hutcheon et al.,
1996; Nguyen et al., 2004; Wu et al., 2005). (1) One hour after the appli-cation of a selective Ihblocker
(ZD-7288), we found no motoneuron displaying a subthreshold reso-nance. (2) Motoneurons without sag did not exhibit a resonance. (3) The quality factor of the resonance was linearly correlated to the sag ra-tio, which quantifies the impact of Ih
on the voltage response. (4) The res-onance diminished or was even abolished when the membrane was depolarized. In contrast, it tended to increase when the potential was hyperpolarized.
Study of a simple model of mo-toneuron suggests that most of the
Ihcurrent is located in the dendrites.
An Ihconductance restricted to the
soma of the model is unable to counterbalance the strong dendritic leak and produces insignificant sag and resonance. In contrast, when the Ihcurrent is distributed all over
the dendrites, the model displays sag ratios, resonance frequencies, and quality factors comparable with the experimental data. This is in keeping with a recent immunocyto-chemical study demonstrating that the HCN channels mediating the Ih
current are located not only at the soma but are also widely distributed in dendrites (Milligan et al., 2006).
In our experiments, QX-314 did not block the Ihcurrent. All 26
mo-toneurons recorded using micro-electrodes filled with QX-314 exhib-ited a slow sag in response to current pulses and a rebound at the pulse offset. Moreover, these rons and the 13 resonant motoneu-rons recorded without QX-314 dis-played no significant difference in their sag ratios [1.4⫾ 0.2 (1.1–1.9) vs 1.3⫾ 0.1 (1.1–1.6)], their quality factors [1.3⫾ 0.2 (1.1–1.7) vs 1.3 ⫾ 0.2 (1.1–1.6)], and their resonance frequencies [11⫾ 3 Hz (6–16 Hz) vs 12⫾ 3 Hz (8–19 Hz); all p ⬎ 0.2]. We also remark that the six motoneu-rons that displayed little to no sag, and accordingly no resonance, were corded without QX-314. These re-sults are in sharp contrast with those obtained in hippocampal (Perkins and Wong, 1995) and neocortical (Hwa and Avoli, 1991) cells in which QX-314 was shown to block Ih. The difference between
motoneu-rons and those other cells might stem from a limited diffusion of QX-314 in the dendrites of motoneurons or the involvement of dif-ferent HCN channels (Santoro et al., 2000; Kaupp and Seifert, 2001).
Figure 9. Input amplification in nonresonant motoneurons. A1–A4, Bottom, ZAP. Top, Voltage (average of 3 records). gPIC⫽ 50 nS. B,
FRC without PIC (thin solid line) and with PIC.PIC⫽ 1 ms (thick solid line), 10 ms (dotted line), or 50 ms (dashed line). C1–C3, Bottom,
Muscle length. Top, EPSPs without PIC (C1), with fast PIC (1 ms), gPIC⫽ 25 nS (C2) or 50 nS (C3). Average of three to five recordings. Note
Effect of an artificial PIC
When cats are anesthetized with barbitu-rates, natural PICs are strongly depressed. Plateau potential or hysteresis of the I–f curve have never been reported in such conditions, and the I–V curves recorded in voltage clamp did not reveal the presence of PICs (Kuo et al., 2003, their Fig. 1 B). This is likely attributable to the very low level of neuromodulation in this state (Lee and Heckman, 2000) and to the blockade of L-type channels by barbiturates (Guer-tin and Hounsgaard, 1999). Furthermore, the QX-314 used in a large number of mo-toneurons effectively suppressed INaPand
contributed to block ICaL(Lee and
Heck-man, 1999).
The natural PICs were replaced by dy-namic clamp-induced artificial PICs. We did not attempt to model with precision the sodium and calcium PICs. Indeed, their characteristics are essentially un-known. In particular, disagreements per-sist on the kinetics of ICaL. Although many
authors agree that it is slow (with an acti-vation time constant of a few tens of milli-seconds) (Carlin et al., 2000; Mermelstein et al., 2000; Li and Bennett, 2003), studies in recombinant cells suggest that its kinet-ics might be much faster (2–3 ms) (Helton et al., 2005). These discrepancies might be attributable to a great diversity in the properties of these channels, related in particular to their subunit composition (Lipscombe et al., 2002). In this work, we varied the PIC time constant over a large range, from 1 to 100 ms, to cover all these situations.
In resonant motoneurons, Ia EPSPs amplification could be accounted for by the impedance changes caused by PICs. Whatever the PIC kinetics, only the ampli-tude of EPSPs was affected and not their time course. This is in keeping with exper-iments performed in decerebrate cats: when PICs were moderately activated, ex-citatory inputs arising during sinusoidal muscle stretches were amplified, but their time course were not altered (Bennett et al., 1998, their Fig. 6). In nonresonant
mo-toneurons, the amplifications could not be accounted for by im-pedance changes: the same artificial PICs as used in resonant motoneurons triggered a plateau potential.
The persistent sodium and calcium currents are both present in spinal motoneurons (Hsiao et al., 1998; Li and Bennett, 2003; Powers and Binder, 2003) and have comparable magnitudes (Harvey et al., 2006a). Our results show that the response to synaptic input depends on the balance between Ihthat creates the
resonance, ICaLthat tends to suppress it, and INaPthat enhances it.
The effect of INaPthus depends on the strength of ICaL. If ICaLis
too weak to compensate the Ihcurrent, the resonance persists and
is amplified by INaP. In contrast, when the resonance is abolished
by ICaL, INaPamplifies the low-frequency response and tends to
trigger plateau potentials. Monoaminergic neuromodulation strongly increases both ICaL(Lee and Heckman, 2000) and INaP
(Harvey et al., 2006b,c) and may thereby switch the motoneuron from a resonant to a nonresonant mode of amplification. This might partly account for the spasticity after spinal lesions. After a chronic spinalization, it was shown that PICs of rat motoneurons become hypersensitive to monoamines (Harvey et al., 2006b,c). They are then strongly facilitated and will produce plateau poten-tials responsible for long-lasting reflexes and muscle spasms (Li et al., 2004).
In our experiments, we imposed PICs by dynamic clamp at the soma. However, electrophysiological and immunohistochemical evidence indicate that fast and slow PICs have a dendritic
com-Figure 10. Slow PIC conditioned the impact of fast PIC. A1–A4, Bottom, ZAP. Top, voltage (average of 3– 4 records). In A4, a
slow PIC and a fast PIC were added concurrently. B, FRC without PIC (thin solid line), with slow PIC alone (dashed), with fast PIC alone (dotted), and with both PICs (thick solid line). C1–C4, Bottom, Muscle length. Top, EPSPs without PIC (C1), with slow PIC (C2),
with fast PIC (C3), and with both PICs (C4). Average of two to five recordings. Arrow in C4points to an aborted plateau potential.
ponent (Hounsgaard and Kiehn, 1993; Bennett et al., 1998; Carlin et al., 2000; Lee and Heckman, 2000; Ballou et al., 2006; Jones and Lee, 2006). Study of a motoneuron model suggests that dendritic PICs also interact with the Ihcurrent and amplify
syn-aptic inputs in the same way as somatic PICs.
Impact of the differential amplification on motoneuron recruitment
Interestingly, the motoneurons endowed with substantial Ihand
displaying a resonance innervate fast contracting motor units developing a large force, either fatigable (FF type) or fatigue re-sistant (FR type). Fast PICs can strongly amplify transient EPSPs to these motoneurons and bring them to their spiking threshold. Fast PICs thus lower the recruitment threshold of FR and FF motoneurons. This increases the overall input– output gain of the motoneuron pool (Heckman, 1994) and helps to produce fast and strong contractions. One might speculate that fast PICs am-plify transient descending commands in fast types motoneurons to produce “ballistic” movements. In addition, our work suggest that, during a rapid muscle stretch, e.g., during a loss of balance, the amplification of dynamic Ia component in motoneurons will help to regain ones equilibrium. Fast PICs thus seem to have the same overall effect as the dynamic␥-motoneurons, which aug-ments the dynamic sensitivity of primary endings and the dy-namic component of the proprioceptive feedback to motoneu-rons (Crowe and Matthews, 1964; Emonet-Denand et al., 1975; Emonet-Denand et al., 1977).
Our study also suggests that, in slow-type motoneurons, the dynamic component elicited by the ramp stretch easily triggers a plateau potential that persists throughout the hold phase. This leads to a strong amplification of the static component. This ef-fect is reminiscent of the action of static fusimotor axons (Emonet-Denand et al., 1977) on primary endings and might help slow motoneurons to discharge during sustained stretches. Because the S motor units are resistant to fatigue, the resulting sustained contraction might contribute to maintain posture. We may also speculate that, when ICaLbecomes strong enough to
abolish the resonance of FR motoneurons, plateau potentials will be triggered, and FR motor units will contribute more efficiently to posture.
References
Ballou EW, Smith WB, Anelli R, Heckman CJ (2006) Measuring dendritic distribution of membrane proteins. J Neurosci Methods 156:257–266. Bennett DJ, Hultborn H, Fedirchuk B, Gorassini M (1998) Synaptic
activa-tion of plateaus in hindlimb motoneurons of decerebrate cats. J Neuro-physiol 80:2023–2037.
Brizzi L, Meunier C, Zytnicki D, Donnet M, Hansel D, Lamotte d’Incamps B, Van Vreeswijk C (2004) How shunting inhibition affects the discharge of lumbar motoneurones: a dynamic clamp study in anaesthetized cats. J Physiol (Lond) 558:671– 683.
Burke RE (1981) Motor units: anatomy, physiology and functional organi-zation. In: Handbook of physiology (Brooks VB, ed), pp 345– 422. Balti-more: Williams and Wilkins.
Carlin KP, Jones KE, Jiang Z, Jordan LM, Brownstone RM (2000) Dendritic L-type calcium currents in mouse spinal motoneurons: implications for bistability. Eur J Neurosci 12:1635–1646.
Chevallier S, Nagy F, Cabelguen JM (2006) Cholinergic control of excitabil-ity of spinal motoneurones in the salamander. J Physiol (Lond) 570:525–540.
Conway BA, Hultborn H, Kiehn O, Mintz I (1988) Plateau potentials in alpha-motoneurones induced by intravenous injection ofL-dopa and clonidine in the spinal cat. J Physiol (Lond) 405:369 –384.
Crill WE (1996) Persistent sodium current in mammalian central neurons. Annu Rev Physiol 58:349 –362.
Crowe A, Matthews PB (1964) The effects of stimulation of static and
dy-namic fusimotor fibres on the response to stretching of the primary end-ings of muscle spindles. J Physiol (Lond) 174:109 –131.
D’Angelo E, De Filippi G, Rossi P, Taglietti V (1998) Ionic mechanism of electroresponsiveness in cerebellar granule cells implicates the action of a persistent sodium current. J Neurophysiol 80:493–503.
Emonet-Denand F, Jami L, Laporte Y (1975) Skeleto-fusimotor axons in the hind-limb muscles of the cat. J Physiol (Lond) 249:153–166.
Emonet-Denand F, Laporte Y, Matthews PB, Petit J (1977) On the subdivi-sion of static and dynamic fusimotor actions on the primary ending of the cat muscle spindle. J Physiol (Lond) 268:827– 861.
Fetz EE, Jankowska E, Johannisson T, Lipski J (1979) Autogenetic inhibition of motoneurones by impulses in group Ia muscle spindle afferents. J Physiol (Lond) 293:173–195.
Fleshman JW, Segev I, Burke RB (1988) Electrotonic architecture of type-identified alpha-motoneurons in the cat spinal cord. J Neurophysiol 60:60 – 85.
Guertin PA, Hounsgaard J (1999) Non-volatile general anaesthetics reduce spinal activity by suppressing plateau potentials. Neuroscience 88:353–358.
Gustafsson B, Pinter MJ (1984) An investigation of threshold properties among cat spinal alpha-motoneurones. J Physiol (Lond) 357:453– 483. Gutfreund Y, Yarom Y, Segev I (1995) Subthreshold oscillations and
reso-nant frequency in guinea-pig cortical neurons: physiology and modelling. J Physiol (Lond) 483:621– 640.
Harris NC, Constanti A (1995) Mechanism of block by ZD 7288 of the hyperpolarization-activated inward rectifying current in guinea pig sub-stantia nigra neurons in vitro. J Neurophysiol 74:2366 –2378.
Harvey PJ, Li Y, Li X, Bennett DJ (2006a) Persistent sodium currents and repetitive firing in motoneurons of the sacrocaudal spinal cord of adult rats. J Neurophysiol 96:1141–1157.
Harvey PJ, Li X, Li Y, Bennett DJ (2006b) 5-HT2 receptor activation facili-tates a persistent sodium current and repetitive firing in spinal motoneu-rons of rats with and without chronic spinal cord injury. J Neurophysiol 96:1158 –1170.
Harvey PJ, Li X, Li Y, Bennett DJ (2006c) Endogenous monoamine receptor activation is essential for enabling persistent sodium currents and repet-itive firing in rat spinal motoneurons. J Neurophysiol 96:1171–1186. Heckman CJ (1994) Computer simulations of the effects of different
synap-tic input systems on the steady-state input-output structure of the mo-toneuron pool. J Neurophysiol 71:1727–1739.
Helton TD, Xu W, Lipscombe D (2005) Neuronal L-type calcium channels open quickly and are inhibited slowly. J Neurosci 25:10247–10251. Hounsgaard J, Kiehn O (1993) Calcium spikes and calcium plateaux evoked
by differential polarization in dendrites of turtle motoneurones in vitro. J Physiol (Lond) 468:245–259.
Hounsgaard J, Mintz I (1988) Calcium conductance and firing properties of spinal motoneurones in the turtle. J Physiol (Lond) 398:591– 603. Hsiao CF, Del Negro CA, Trueblood PR, Chandler SH (1998) Ionic basis for
serotonin-induced bistable membrane properties in guinea pig trigeminal motoneurons. J Neurophysiol 79:2847–2856.
Hu H, Vervaeke K, Storm JF (2002) Two forms of electrical resonance at theta frequencies, generated by M-current, h-current and persistent Na⫹ current in rat hippocampal pyramidal cells. J Physiol (Lond) 545:783– 805.
Hultborn H, Denton ME, Wienecke J, Nielsen JB (2003) Variable amplifi-cation of synaptic input to cat spinal motoneurones by dendritic persis-tent inward current. J Physiol (Lond) 552:945–952.
Hutcheon B, Yarom Y (2000) Resonance, oscillation and the intrinsic fre-quency preferences of neurons. Trends Neurosci 23:216 –222.
Hutcheon B, Miura RM, Puil E (1996) Subthreshold membrane resonance in neocortical neurons. J Neurophysiol 76:683– 697.
Hwa GG, Avoli M (1991) Hyperpolarizing inward rectification in rat neo-cortical neurons located in the superficial layers. Neurosci Lett 124:65– 68.
Ito M, Oshima T (1965) Electrical behaviour of the motoneurone mem-brane during intracellularly applied current steps. J Physiol (Lond) 180:607– 635.
Jack JB, Noble D, Tsien RW (1983) Electrical current flow in excitable cells, Ed 2. Oxford: Oxford UP.
Jones SM, Lee RH (2006) Fast amplification of dynamic synaptic inputs in spinal motoneurons in vivo. J Neurophysiol 96:2200 –2206.