Publisher’s version / Version de l'éditeur:
Vous avez des questions? Nous pouvons vous aider. Pour communiquer directement avec un auteur, consultez la première page de la revue dans laquelle son article a été publié afin de trouver ses coordonnées. Si vous n’arrivez pas à les repérer, communiquez avec nous à [email protected].
Questions? Contact the NRC Publications Archive team at
[email protected]. If you wish to email the authors directly, please see the first page of the publication for their contact information.
https://publications-cnrc.canada.ca/fra/droits
L’accès à ce site Web et l’utilisation de son contenu sont assujettis aux conditions présentées dans le site LISEZ CES CONDITIONS ATTENTIVEMENT AVANT D’UTILISER CE SITE WEB.
The Seventeenth International Conference on Industrial & Engineering
Applications of Artificial Intelligence & Expert Systems (IEA/AIE 2004)
[Proceedings], 2004
READ THESE TERMS AND CONDITIONS CAREFULLY BEFORE USING THIS WEBSITE. https://nrc-publications.canada.ca/eng/copyright
NRC Publications Archive Record / Notice des Archives des publications du CNRC :
https://nrc-publications.canada.ca/eng/view/object/?id=0b2cb583-4359-4c19-9ba6-56a8d1eebb1d
https://publications-cnrc.canada.ca/fra/voir/objet/?id=0b2cb583-4359-4c19-9ba6-56a8d1eebb1d
NRC Publications Archive
Archives des publications du CNRC
This publication could be one of several versions: author’s original, accepted manuscript or the publisher’s version. / La version de cette publication peut être l’une des suivantes : la version prépublication de l’auteur, la version acceptée du manuscrit ou la version de l’éditeur.
Access and use of this website and the material on it are subject to the Terms and Conditions set forth at
Gene Discovery in Leukemia Revisited: A Computational Intelligence
Perspective
Council Canada Institute for Information Technology de recherches Canada Institut de technologie de l'information
Gene Discovery in Leukemia Revisited:
A Computational Intelligence Perspective *
Valdés, J., and Barton, A.
May 2004
* published in The Seventeenth International Conference on Industrial & Engineering Applications of Artificial Intelligence & Expert Systems (IEA/AIE 2004). Ottawa, Ontario, Canada. May 17-20, 2004. NRC 46547.
Copyright 2004 by
National Research Council of Canada
Permission is granted to quote short excerpts and to reproduce figures and tables from this report, provided that the source of such material is fully acknowledged.
Gene Discovery in Leukemia Revisited:
A Computational Intelligence Perspective
Julio J. Valdés and Alan J. Barton
Institute for Information Technology, National Research Council of Canada 1200 Montreal Road, Ottawa, ON K1A 0R6, Canada
{julio.valdes, alan.barton}@nrc-cnrc.gc.ca
Abstract. An approach using clustering in combination with Rough Sets and
neural networks was investigated for the purpose of gene discovery using leukemia data. A small number of genes with high discrimination power were found, some of which were not previously reported. It was found that subtle differences between very similar genes belonging to the same cluster, as well as the number of clusters constructed, affect the discovery of relevant genes. Good results were obtained with no preprocessing applied to the data.
Keywords. computational intelligence, rough sets, clustering, virtual reality,
feed-forward and probabilistic neural networks, data mining, leukemia
1.Introduction
This paper addresses the problem described in [7]: “How could an initial collection of samples from patients known to have certain types of leukemia be used to classify new, unknown samples?”. Related works include [6], [5]. This paper investigates one, of the possibly many, computational intelligence approaches. Partition clustering is combined with rough sets, virtual reality data representation, generation of non-linear features and two kinds of neural networks. The goals are: to get an idea about the behavior of these techniques in the way in which they are combined during the knowledge discovery process, and to make a preliminary comparison of the results from the point of view of the relevant genes found along the process.
2.Data mining and Soft-Computing Techniques
Clustering methods
Clustering with classical partition methods constructs crisp subpopulations (non overlapping) of objects or attributes. Two such algorithms were used in this study: the Leader algorithm [9], and the convergent k-means [1]. The leader algorithm operates
with a dissimilarity or similarity measure and a preset threshold. A single pass is made through the data objects, assigning each object to the first cluster whose leader (i.e. its representative) is close enough w.r.t. the measure and the threshold. If no such object is found, a new cluster is created with the current object as leader. This technique is fast, however, it has several negative properties. For example, i) the first data object always defines a cluster and therefore, appears as a leader, ii) the partition formed is not invariant under a permutation of the data objects, and iii) the algorithm is biased, as the first clusters tend to be larger than the later ones since they get first chance at “absorbing” each case as it is allocated.
The k-means algorithm is actually a family of techniques where a dissimilarity measure is supplied, together with an initial partition of the data (random, the first k objects, k-seed elements, etc). The goal is to alter cluster membership so as to obtain a better partition w.r.t. the measure. Different variants very often give different partition results. However, in papers dealing with gene expression analysis, very seldomly are the specificities of the means clustering used described. Here, the convergent k-means process was used. The advantages of this variant are that the within groups sum of squares always decreases and that the method converges if Euclidean distance is used.
Rough Sets
The Rough Set theory [11] bears on the assumption that in order to define a set, some knowledge about the elements of the data set is needed. This is in contrast to the classical approach where a set is uniquely defined by its elements. In the Rough Set theory, some elements may be indiscernible from the point of view of the available information and it turns out that vagueness and uncertainty are strongly related to indiscernibility. Within this theory, the knowledge is understood as the ability of characterizing all the classes of the classification.
An information system is a pair A=(U,A)where U is a non-empty finite set called the universe and A is a non-empty finite set of attributes such that a:U→Vafor every
A
a∈ . The set Va is called the value set of a. A decision table is any information
system of the form A=(U,A∪{d}), where d∈ is the decision attribute and the A elements of A are the condition attributes. For any B⊆A an equivalence relation
) (B IND defined as ( ) {( , ') 2| a B,a(x) a(x')} U x x B IND = ∈ ∀ ∈ = , is associated.
In the Rough Set Theory each vague concept is replaced by a pair of precise concepts called its lower and upper approximations; the lower approximation of a concept consists of all objects which surely belong to the concept, whereas the upper approximation of the concept consists of all objects which possibly belong to the concept. A reduct is a minimal set of attributes B⊆Asuch that IND(B)=IND(A), i.e. a minimal attribute subset that preserves the partitioning of the universe. The set of all reducts of an information system A is denoted RED( A). Reduction of knowledge consists of removing superfluous partitions such that the set of elementary categories in the information system is preserved, in particular, w.r.t. those categories induced by the decision attribute.
Gene Discovery in Leukemia Revisited: A Computational Intelligence Perspective 3
Virtual Reality Representation Of Relational Structures
A virtual reality visual data mining technique extending the concept of 3D modelling to relational structures was introduced in http://www.hybridstrategies.com and [15]. It is oriented to the understanding of large heterogeneous, incomplete and imprecise data, as well as symbolic knowledge. The notion of data is not restricted to databases, but includes logical relations and other forms of both structured and non- structured knowledge. In this approach, the data objects are considered as tuples from a heterogeneous space [16], given by a Cartesian product of different source sets like: nominal, ordinal, real-valued, fuzzy-valued, image-valued, time-series-valued, graph-valued etc. A set of relations of different arities may be defined over these objects. The construction of a VR-space requires the specification of several sets and a collection of extra mappings, which may be defined in infinitely many ways. A desideratum for the VR-space is to keep as many properties from the original space as possible, in particular, the similarity structure of the data [4]. In this sense, the role of l is to maximize some metric/non-metric structure preservation criteria [3], or minimizing some measure of information loss.
Neural Networks
Two kinds of neural networks were used in this study: a hybrid stochastic-deterministic feed forward network (SD-FFNN), and a probabilistic neural network. The SD-FFNN is a hybrid model based on a combination of simulated annealing with conjugate gradient [10], which improves the likelihood of finding good extrema while containing enough determinism. The Probabilistic Neural Network (PNN) [14] is a model based on bayesian classification using a generalization of Parzen’s method for estimating joint probability density functions (pdf) from training samples. This network is composed of an input layer, a pattern layer, a summation layer and an output layer.
3.Experimental Setup
The dataset used is that of [7], and consists of 7129 genes where patients are separated into i) a training set containing 38 bone marrow samples: 27 acute lymphoblastic leukemia (ALL) and 11 acute myeloid leukemia (AML), obtained from patients at the time of diagnosis, and ii) a testing set containing 34 samples (24 bone marrow and 10 peripheral blood samples), where 20 are ALL and 14 AML. Note that, the test set contains a much broader range of biological samples, including those from peripheral blood rather than bone marrow, from childhood AML patients, and from different reference laboratories that used different sample preparation protocols. Further, the dataset is known to have two types of ALL, namely B-cell and T-cell. For the purposes of investigation, only the AML and ALL distinction was made. The dataset already contains preprocessed intensity values, which were obtained by
re-scaling such that overall intensities for each chip are equivalent (A linear regression model using all genes was fit to the data).
In this paper no explicit preprocessing of the data was performed. That is, no normalization, no background subtraction, no deletions/filtering/averaging of patients/genes or creation of new features, such as through constructive induction or normalization was performed. This choice was selected in order to not help, thereby creating a difficult situation such that the behavior of the data processing strategy, the methods used, and their robustness, could be better exposed.
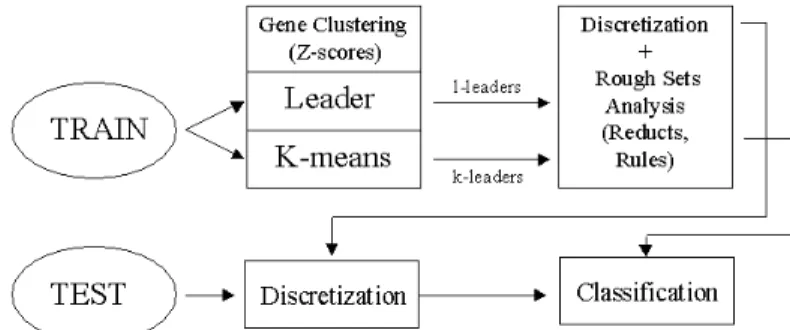
A series of staged experiments were performed, using the training (DTr) and test (DTe) data and are explained in the following subsections. Each stage feeds its results to the next stage of experiments, yielding a data analysis, processing stream. For each clustering solution, training and test subsets of the raw original data were constructed using cluster-derived leaders. The training set was discretized with a boolean reasoning algorithm, and then reducts and decision rules were computed. The test set was discretized according to the training cuts, and the resulting data were classified using the decision rules (Fig-1).
Fig. 1. Data processing strategy combining clustering with Rough Sets analysis.
Stage 1 – Selection of Representative Genes
Experimental Suite (1): [l-leaders]
DTr was transposed and z-score normalized to D’Tr. Then the leader algorithm was applied on D’Tr for the purpose of clustering the genes (using Euclidean distance and the closest leader criterion). A series of distance thresholds were used for cluster formation {0, 0.2, 0.280, 0.2805, 0.2807, 0.3, 0.4, 0.58}. Each of them induce a partition on D’Tr. After that the set of leaders were used for constructing subsets of the training data DTr, referred as DTr,l-leaders. The same was done with the test set, DTe. Experimental Suite (2): [k-leaders]
For this approach D’Tr was used as input to a convergent k-means algorithm with Euclidean distance, and centroid upgrading after each relocation, up to a maximum of only 20 iterations. In order to make the results comparable with those given by the aforementioned l-leaders, the number of clusters formed (k) was chosen to be the
Gene Discovery in Leukemia Revisited: A Computational Intelligence Perspective 5 same as those obtained for the respective l-leader. Then k-leaders are created from the clustering result, by selecting the closest member of the cluster w.r.t. its corresponding cluster centroid. Subsets of the training data DTr we formed, now using the k-leaders. They will be refered to as DTr,k-leaders and the same k-leaders were used for constructing a subset of the test set (DTe,k-leaders).
Stage 2 – Creation of Predictors from Training Data
Experimental Suite (1): Rough Sets methods [l-leaders]
DTr,l-leaders was discretized using a boolean reasoning algorithm with a global method [13], [2] to create cut points (CTr,l-leaders) and a discretized form of the actual training data DdTr,l-leaders. It is known that discretization exerts a large influence on the results of machine learning procedures, but for all the experiments conducted here the discretization method was kept constant. Rough Sets was then applied to DdTr,l-leaders in order to calculate the reducts and their associated rules (RTr,l-leaders) were computed via an exhaustive algorithm seeking full discernibility [2]. Then, the test data DTe described in terms of the same l-leaders was discretized using the cuts found for the training set (CTr,l-leaders) giving a discretized test set D
d
Te,l-leaders. Finally, the rules (R Tr,l-leaders) found with the training data (D
d
Tr) were applied to (D d
Te) in order to perform the classification of the new cases (computation of a confusion matrix). Global accuracies, as well the accuracies related to the individual classes are reported.
Experimental Suite (2): Rough Sets methods [k-leaders]
The same process described in Experimental Suite (1), was performed but with the k-leaders in order to obtain CTr,k-leaders, DdTr,k-leaders, and the resultant RTr,k-leaders.
Stage 3 – Virtual Reality Representation of Data Sets
Two experiments were made:
Experiment (1): A VR-space with the union of the training (DTr) and the test (DTe) sets was computed. The class membership information (ALL/AML) as well as the training/test kind of sample was included in the visualization. This representation is a 3-dimensional version of the original 7129-dimensional space with the raw unprocessed data. The dissimilarity measure on the original space was ((1/g)-1), where g is defined in [8], with a representation error defined in [12].
Experiment (2): A VR-space with the union of the sets DTr,l-leaders, DTe,l-leaders was computed (i.e. a subset of the original gene expressions that were measured on the patient samples for both training and test). In this case, the visualization includes ALL/AML class membership, training/test data distinction information and convex hulls wrapping the AML and ALL classes allowing a better appreciation of the discrimination power of the selected genes w.r.t. the classes. The information system in the VR-space formed from the 3D-coordinates (the non-linear attributes derived from those of the original space), and the decision attribute, was used for the next processing stage.
Stage 4 – Building and Applying a Classifier to the Leukemia Data
Experiment (1): A hybrid SD-FFNN with 2 hidden nodes with hyperbolic tangent activation function, and 2 output nodes with a linear activation function was trained using mean squared error on the VR-space information system. The network was then applied to the test data set.
Experiment (2): A probabilistic neural network with 3 inputs and 2 outputs (the hidden layer comprised by each of the examples from the training set), and gaussian kernel with various variances was trained. The network was then applied to the test data set.
4.Results
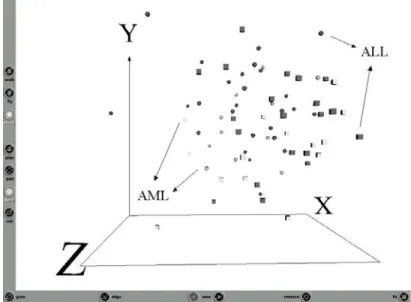
The situation of the raw data (training and test sets together) as given by all of the 7129 genes is shown in Fig-2.
Fig. 2. Snapshot of the Virtual Reality representation of the original data
(training set with 38 samples + test set with 34, both with 7129 genes). Dark objects= ALL class, Light objects=AML class. Spheres = training and Cubes = test. Representation error = 0.143, Relative error = 3.56e-6.
Despite the low representation error associated with the VR-space (which indicates that the VR representation effectively captures the overall data structure), there is no visual differentiation between the ALL and AML classes. Clearly, there are too many noisy and unrelated genes, masking and distorting the potentially relevant ones.
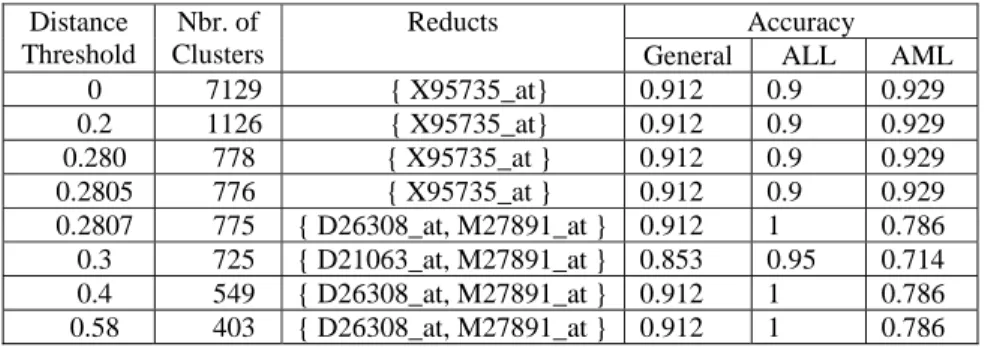
Gene Discovery in Leukemia Revisited: A Computational Intelligence Perspective 7 The results of the Experimental Suite (1) according to the tandem Stage 1- Stage 2 is presented in Table-1. Several distance thresholds were used for partition clustering with the leader algorithm, which induced clusters of different sizes (0 distance implies using all original genes). It is interesting to see that despite the known limitations of the leader clustering, high accuracies are obtained with only four genes. Moreover, some of the genes are able to resolve one of the classes (ALL) perfectly, but care should be taken when interpreting these results, as criticisms questioned the correctness of the class labels of the data.
Table 1. Leader clustering results on the test set.
Accuracy Distance Threshold Nbr. of Clusters Reducts
General ALL AML
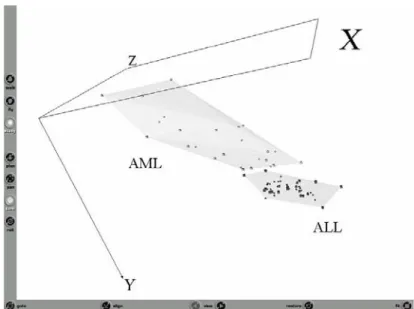
0 7129 { X95735_at} 0.912 0.9 0.929 0.2 1126 { X95735_at} 0.912 0.9 0.929 0.280 778 { X95735_at } 0.912 0.9 0.929 0.2805 776 { X95735_at } 0.912 0.9 0.929 0.2807 775 { D26308_at, M27891_at } 0.912 1 0.786 0.3 725 { D21063_at, M27891_at } 0.853 0.95 0.714 0.4 549 { D26308_at, M27891_at } 0.912 1 0.786 0.58 403 { D26308_at, M27891_at } 0.912 1 0.786 When only four genes are used for describing the original data, as determined by the reducts in Table-1, the VR-space situation w.r.t. class differentiation changes completely (Fig-3). That is, a complete visual separation of the ALL and AML classes is obtained, as shown by the convex hulls wrapping the classes. Upon closer inspection, it is found that the boundary objects in the proximity zone between the two classes are test samples. Therefore indicating that resampling and cross validation could be used to improve classification errors. This is confirmed by the results of the SD-FFNN and the PNN neural network models applied to the VR-space data. Both of them had a general accuracy of 0.882 with individual accuracies of 0.9 for ALL and 0.875 for the AML classes, respectively.
The VR-space shows that the training set is more compact than the test set, confirming the biological diversity of the latter, which was previously mentioned. As described in Section 3, in this case, the attributes are the non-linear transformation of the four selected genes composed by the union of all reducts found, which minimize the similarity structure difference.
On another note, the results of Table-1 expose the dangers involved in non-careful use of clustering. That is, it is not necessarily true that similar genes imply similar relevance w.r.t. class differentiation; or in other words, just because genes are similarly expressed it does not mean that they may be equally useful in distinguishing between ALL and AML (maybe due to subtle differences between genes). Therefore, clustering can sometimes be misleading (see the differences between a 775 and 776 clustering solution). This effect is even more acute considering the fact that the biological literature tends to report using much smaller numbers of clusters when processing gene expression experiments.
Fig. 2. Snapshot of the Virtual Reality representation of the original data (with
selected genes {X95735_at, D26308_at, D21063_at, M27891_at}). Dark objects= ALL class, Light objects=AML class. Spheres = training and Cubes = test. Representation error = 0.103, Relative error = 4.63e-10.
The results of the Experimental Suite (2) are presented in Table-2. The overall accuracies are higher than those obtained with the leader algorithm. Genes {X95735_at and M27891_at are found again, but two new genes emerged (X55715_at and U89922_s_at). The pair {U89922_s_at, M27891_at} was the best, from the point of view of both the general and the class-wise accuracies. The gene U14603_at is also an important complement to M27891_at, making a second best. Table 2. k-means Clustering Results on the test set
Accuracy Nbr. of
Clusters
Reducts
General ALL AML
7129 { X95735_at} 0.912 0.9 0.929 1126 { X95735_at} 0.912 0.9 0.929 778 { X95735_at} 0.912 0.9 0.929 776 { X95735_at} 0.912 0.9 0.929 775 { X95735_at} 0.912 0.9 0.929 725 { X55715_at, M27891_at } 0.882 0.95 0.786 549 { U89922_s_at, M27891_at } 0.971 1 0.929 403 { U14603_at, M27891_at } 0.941 0.95 0.929
The situation produced by the best gene pair is depicted in Fig-2, showing that a complete class separation is potentially possible using only these two genes.
From the discovered relevant genes, {M27891_s_at} is shared with [5] and [7], {X95735_at} is shared with [7] and [6].
Gene Discovery in Leukemia Revisited: A Computational Intelligence Perspective 9
Fig. 3. Gene U89922_s_at vs. gene M27891_at for all patients in both the training and test sets.
A complete separation of the ALL and AML classes is obtained.
Conclusions
Good results were obtained despite no preprocessing being applied to the data. Subtle differences between very similar genes belonging to the same cluster, as well as the number of clusters constructed, affect the discovery of relevant genes. Representative extraction using l or k-leaders both proved to be effective when used in tandem with Rough Sets methods and a small number of genes with high discrimination power were found. More thorough studies are required to correctly evaluate the impact of both the number of clusters and their generation process on the subsequent data mining steps. Also important, is to determine appropriate ways for using these techniques in order to maximize their combined effectivity.
Visual exploration of the results (when focusing on selected genes) was very instructive for understanding the properties of the classes (size, compactness, etc.), and the relationships between the discovered genes and the classes. The visualization also helped explain the behavior of the neural network models, and suggests the potential for existence of better solutions.
Acknowledgements
This research was conducted within the scope of the BioMine project (IIT-NRC). The authors would like to thank Fazel Famili, Junjun Ouyang and Robert Orchard from the Integrated Reasoning Group (IIT-NRC).
References
1. Anderberg, M.: Cluster Analysis for Applications. Academic Press, 359 pp, 1973. 2. Bazan, J.G., Szczuka S., Wroblewski, J: A New Version of Rough Set Exploration
System. Third. Int. Conf. on Rough Sets and Current Trends in Computing RSCTC 2002. Malvern, PA, USA, Oct 14-17. Alpigini, Peters, Skowron, Zhong (Eds.) Lecture Notes in Computer Science (Lecture Notes in Artificial Intelligence Series) LNCS 2475, pp. 397-404. Springer-Verlag , 2002.
3. Borg, I., and Lingoes, J., Multidimensional similarity structure analysis: Springer-Verlag, New York, NY, 390 p. 1987.
4. Chandon, J.L., and Pinson, S., Analyse typologique. Théorie et applications: Masson, Paris, 254 p. 1981.
5. Deb, K and Reddy, A. R. Classification of Two-Class Cancer Data Reliably Using Evolutionary Algorithms. KanGAL Report No. 2003001.
http://www.iitk.ac.in/kangal/pub.htm February, 2003.
6. Famili, F. and Ouyang, J., Data mining: understanding data and disease modeling. In Proceedings of the 21st IASTED International Conference, Applied Informatics, Innsbruck, Austria, pp. 32-37. Feb. 10-13, 2003.
7. Golub, T.R., etal. Molecular classification of cancer: class discovery and class prediction by gene expression monitoring. Science, vol. 286, pp531-537. 1999. 8. Gower, J.C., A general coefficient of similarity and some of its properties:
Biometrics, v.1, no. 27, p. 857-871. 1973.
9. Hartigan, J.: Clustering Algorithms. John Wiley & Sons, 351 pp, 1975.
10. Masters, T.: Advanced Algorithms for Neural Networks. John Wiley & Sons, pp 431,1993.
11. Pawlak, Z., Rough sets: Theoretical aspects of reasoning about data: Kluwer Academic Publishers, Dordrecht, Netherlands, 229 p. 1991.
12. Sammon, J.W. A non-linear mapping for data structure analysis. IEEE Trans. on Computers C18, p 401-409. 1969.
13. Son H. Nguyen, Hoa S. Nguyen. Discretization Methods in Data Mining. In: L. Polkowski, A. Skowron (eds.): Rough Sets in Knowledge Discovery. Physica-Verlag, Heidelberg, pp. 451-482. 1998.
14. Specht, D.: Probabilistic Neural Networks. Neural Networks 3, pp 109-118, 1990. 15. Valdés, J.J.: Virtual Reality Representation of Relational Systems and Decision
Rules: An exploratory Tool for understanding Data Structure. In Theory and Application of Relational Structures as Knowledge Instruments. Meeting of the COST Action 274 (P. Hajek. Ed). Prague, November 14-16, 2002.
16. Valdés, J.J : Similarity-Based Heterogeneous Neurons in the Context of General Observational Models. Neural Network World. Vol 12, No. 5, pp 499-508, 2002.