READ THESE TERMS AND CONDITIONS CAREFULLY BEFORE USING THIS WEBSITE.
https://nrc-publications.canada.ca/eng/copyright
Vous avez des questions? Nous pouvons vous aider. Pour communiquer directement avec un auteur, consultez la
première page de la revue dans laquelle son article a été publié afin de trouver ses coordonnées. Si vous n’arrivez pas à les repérer, communiquez avec nous à PublicationsArchive-ArchivesPublications@nrc-cnrc.gc.ca.
Questions? Contact the NRC Publications Archive team at
PublicationsArchive-ArchivesPublications@nrc-cnrc.gc.ca. If you wish to email the authors directly, please see the first page of the publication for their contact information.
NRC Publications Archive
Archives des publications du CNRC
This publication could be one of several versions: author’s original, accepted manuscript or the publisher’s version. / La version de cette publication peut être l’une des suivantes : la version prépublication de l’auteur, la version acceptée du manuscrit ou la version de l’éditeur.
Access and use of this website and the material on it are subject to the Terms and Conditions set forth at
LeakFinder - new pipeline leak detection system
Hunaidi, O.; Wang, A.
https://publications-cnrc.canada.ca/fra/droits
L’accès à ce site Web et l’utilisation de son contenu sont assujettis aux conditions présentées dans le site
LISEZ CES CONDITIONS ATTENTIVEMENT AVANT D’UTILISER CE SITE WEB.
NRC Publications Record / Notice d'Archives des publications de CNRC:
https://nrc-publications.canada.ca/eng/view/object/?id=cb9e3faa-4cd9-4cfd-aae7-03a248e5a33e https://publications-cnrc.canada.ca/fra/voir/objet/?id=cb9e3faa-4cd9-4cfd-aae7-03a248e5a33e
LeakFinder - new pipeline leak detection
system
Hunaidi, O.; Wang, A.
A version of this paper is published in / Une version de ce document se trouve dans : 15th World Conference on Non-Destructive Testing, Rome, Italy, 15-21 Oct. 2000, pp.
1-6
www.nrc.ca/irc/ircpubs
LeakFinder – New Pipeline Leak Detection System Osama Hunaidi and Alex Wang
National Research Council Canada, Institute for Research in Construction, Ottawa, Canada, K1A 0R6 [Tel.: +1 (613) 993-9720, Fax: +1 (613) 952-8102]
Abstract
This paper introduces a newly developed system for locating leaks in water distribution networks. The system is based on the cross-correlation method and is realized in software for personal computers (PCs). It utilizes multimedia components of PCs to record and playback leak sounds in water pipes. It also incorporates several signal processing and analysis innovations, in particular an enhanced cross-correlation function. The new system is readily integrated with commercially available wireless data transmission units and vibration sensors to provide a complete leak detection system. Advantages of the new system are low cost, flexibility and improved accuracy. Features of the system, details of its various modules, and a demonstration of its accuracy are presented.
Introduction
Acoustical devices are the principal type of equipment used to locate leaks in water distribution systems. They are non-destructive and non-intrusive and locate leaks by detecting the sound or vibration induced by water leaking from pressurized pipes. Leak sounds are transmitted in the pipe itself for long distances and through the soil close to the leak. In leak detection surveys, simple devices such as listening sticks or aquaphones are first used to roughly identify the position of leaks by listening on all accessible contact points with the distribution system such as fire hydrants and valves. Suspected leaks are then pinpointed by using ground microphones to listen on the ground surface directly above the pipe at intervals of 1 m or less. The operation of listening devices is straightforward, but their effectiveness depends on the experience of the user.
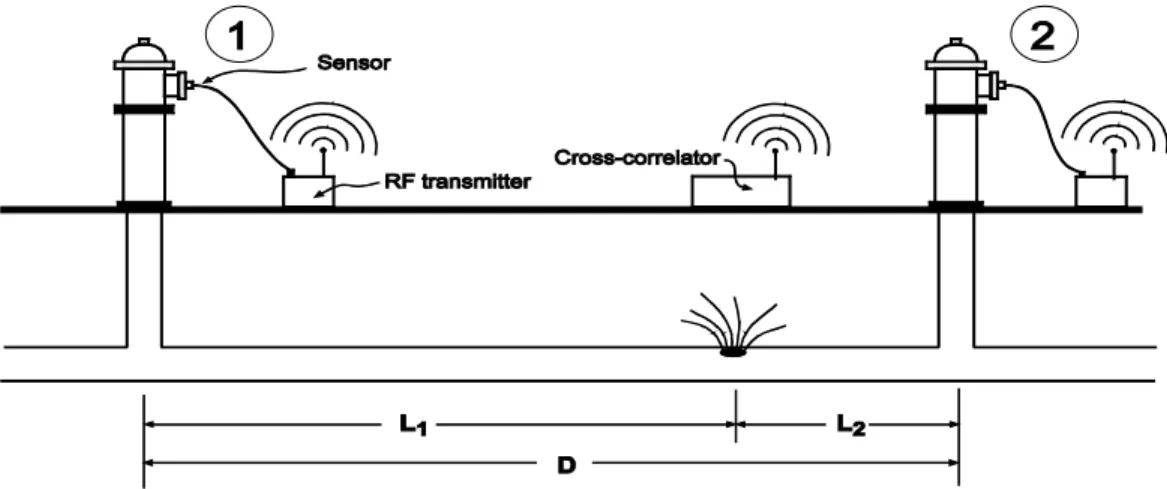
Alternatively, leaks can be pinpointed by using modern leak noise correlators. These are more efficient, yield more accurate results and are less dependent on user experience than listening devices. Leak noise correlators consist of acoustic sensors such as accelerometers and hydrophones, wireless signal transmitters and receivers, and an electronic processing unit. As shown schematically in Figure 1, the sensors are attached at two contact points with the pipe (normally fire hydrants) that bracket a suspected leak. The signals are transmitted from the sensors to the processing unit wirelessly. The processing unit computes the cross-correlation function of the two leak signals to determine the time lag between them. It then calculates the location of the leak based on a simple algebraic relationship between the time lag, sensor-to-sensor spacing, and sound propagation velocity in the pipe. Several makes of leak noise correlators are available commercially.
In this paper a new leak detection system is introduced. The new system, called LeakFinder, is personal computer (PC) multimedia-based and incorporates several new signal processing and analysis innovations. It locates leaks using the cross-correlation method. Advantages of the new system are low cost, flexibility, and improved accuracy. Features of the new LeakFinder system are described in this paper. Details are also presented for its three main modules: data acquisition, signal conditioning, and spectral analysis. The accuracy of the new system is demonstrated using actual leak signals for plastic and metallic pipes.
2
-Figure 1 Schematic illustration of the cross-correlation method
Description of the New System
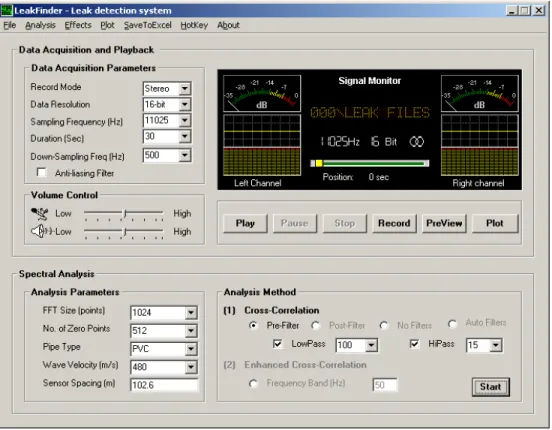
LeakFinder is a software that taps into the capabilities of multimedia components of modern PCs, mainly their sound cards, to record and playback leak signals. It also utilizes the CPU of PCs to perform the computationally-intensive operations of digitally filtering interfering noise and calculating the cross-correlation function. Modern PCs incorporate fast CPUs as well as soundcards having at least a 16-bit numerical resolution. LeakFinder is MS WindowsTM based and runs under either Windows 2000, NT, 98 or 95. It has intuitive user-friendly menus and data displays. The main user interface and output windows are shown in Figures 2 and 3, respectively. The new system is readily integrated with commercially available wireless RF-based data transmitters and leak sensors, such as accelerometers, to provide a complete leak locating system. LeakFinder introduces several improvements including the option of calculating the time lag using an “enhanced” cross-correlation function, finely tunable digital pre- or post-filters for suppression of interfering noise, a wide range of spectral estimates including auto spectra and the coherence function, optional display of leak signals, and permanent storage of leak signals for off-site analysis. LeakFinder is also inexpensive which will help many users, including those in developing countries, who cannot afford existing systems.
Data Acquisition Module
Leak signals are recorded using the soundcard of the PC at any of the card's sampling frequencies, normally between 11,025 and 44,000 Hz. Recorded leak signals can be stored in either standard .wav or .ascii formats. User-specified data acquisition parameters include the following: data recording mode, i.e., stereo or mono, numerical resolution, sampling frequency, duration of recording, and volume controls for recording and playback.
The soundcard should be set to stereo mode (i.e., dual-channel input) unless it is used for recording leak sounds at one point only as in listening surveys. For accuracy, leak signals should be recorded using 16-bit resolution. The sampling rate is set by default to the lowest rate of the soundcard (usually 11,025 Hz) which is high enough for leak signals. Leak signals are usually recorded for a duration between 30 to 60 seconds.
In record mode, the volume control should be adjusted to utilize as much as possible of the soundcard's voltage range, without overloading it, to achieve a high signal-to-noise ratio. The volume control of the record mode can be set to the appropriate level online while checking the
3
-Figure 2 Main graphical user interface
4
-level of leak signals using LeakFinder's preview function. The preview function records and displays leak signals without saving them to disk. Once the recording volume control level is selected, the signals can be recorded and saved to disk using the record function. The complete time history of saved signals can be displayed and printed using Leak Finder's display function. Signal Conditioning Module
In most cases, when the cross-correlation method is used to locate leaks, filtering must be applied to remove high-amplitude narrow-band noise, e.g., resonance response of the pipe and electrical noise. Otherwise, the cross-correlation peak corresponding to the leak position will be obscured or distorted. In LeakFinder, the user has the option of limiting the frequency range of recorded leak signals to suppress interfering noise components by applying low and high-pass digital filters at user-specified cutoff frequencies.
Instead of pre-filtering the leak signals, the user may opt to post-filter the cross-correlation function. Post-filtering is considerably more efficient especially if the leak signals are long or if the cross-correlation function has to be calculated several times for different filter settings in order to find a definite peak. The filters implemented in LeakFinder are of the recursive 4th order Butterworth type. Leak signals are filtered in both the forward and reverse directions to eliminate time delays caused by the response of filters.
A unique feature of LeakFinder is that the speed at which leak signals are played back can be altered. For example, the speed is increased or decreased arbitrarily by simply overriding the sampling frequency at which leak signals were digitally recorded with a higher or lower sampling frequency. This is very useful when playing back leak signals of plastic pipes (or other non-metallic pipes) which only have very low-frequency components, e.g., in the infrasound range, and thus cannot be heard by an unaided human ear. The speeding up of the playback of low-frequency signals shifts their low-frequency content to a higher range at which the sensitivity of human hearing is high enough to detect the leak sound.
Spectral Analysis Module
LeakFinder performs spectral analysis on the filtered (or unfiltered) leak signals and produces the following spectral estimates: (i) auto-spectra, (ii) coherence function, and (iii) cross-correlation function. The auto-spectra provide information about the frequency content of leak signals. The coherence function provides a measure of the relatedness of leak signalsthe closer the coherence function to 1, the more related the signals.
The time lag between leak signals is found from the cross-correlation function. If a leak exists between the two points where leak signals are measured, the cross-correlation function will have a distinct peak and the corresponding time shift (
τ
max) will correspond to the difference in arrival times between measured leak signals. In reference to Figure 1, the time delay between measured leak signals is related to the location of the leak byc L L2 1 max − = τ
where L1 and L2 are the position of the leak relative to sensors 1 and 2, respectively, and c is the
propagation velocity of sound in the water pipe. By substituting L2 = D – L1 in the above
equation, the position of the leak relative to point 1 is found to be 2 max 1 τ ⋅ − = c D L
5
-where D is the distance between the sensors, usually measured on site or read off system maps. The propagation velocity depends on the type and size of the pipe. Velocity values can be obtained from pipe manufacturers or are easily measured on-site using a known in-bracket or out-of-bracket simulated leak.
The time lag between leak signals can also be found using LeakFinder’s enhanced cross-correlation function. For narrow-band leak signals, this function provides improved resolution, i.e., better definition of peaks, in comparison with the standard cross-correlation function. This is helpful in the case of plastic pipes and in situations where leak sensors are closely spaced. Another advantage of the enhanced cross-correlation function is that there is no need to filter leak signals. This eliminates the uncertainty involved in selecting filter cutoff frequencies. The user needs only to specify the frequency above which the amplitude of the auto-spectra of the leak signals becomes insignificant, normally 50 Hz for plastic pipes and 500 Hz for metallic ones. Processing and Analysis Parameters
User-specified parameters and options for digital filtering and spectral analysis of leak signals include the following: ON/OFF and PRE/POST filter switches, cutoff frequencies of low and high-pass filters, number of points in the Fast Fourier Transform (FFT), number of zero-points†, propagation velocity of leak signals in the water pipe, sensor-to-sensor spacing, and modified sampling frequency of leak signals. Default FFT size and number of zero-points are 1024 and 512 points, respectively (corresponding to a rectangular force-window with 50% overlap).
Appropriate cutoff frequencies of low and high-pass filters depend on the type of pipe and sensor-to-sensor spacing and therefore no fixed rules can be specified. Normally, the cutoff frequencies are selected so that they correspond to the frequency range where the amplitude of the auto-spectra of leak signals is significant and the coherence function is high. However, this is not always evident, especially for plastic pipes for which the amplitude of leak signals is very small and their frequency content is narrow. Recommended high and low-pass cutoff frequencies for typical plastic water distribution pipes, e.g., 6" or 8" PVC pipes, are 15 and 100 Hz, respectively. The high-pass limit may need to be increased or decreased in small increments, e.g., 1 or 2 Hz, until a distinct peak emerges in the cross-correlation function. For metallic pipes, leak signals contain much higher frequency components than plastic pipes and consequently a high frequency range may be used for calculating the cross-correlation function, e.g., 200 to 800 Hz.
Leak signals rarely contain frequency components above 1000 Hz in the case of metallic pipes and above 200 Hz in the case of plastic ones. Therefore, in order to speed up digital filtering and spectral analysis of the leak signals, the sampling frequency of recorded signals can be reduced optionally to selected frequencies, e.g., 500 Hz for plastic pipes and 2000 Hz for metallic ones.
Output
Auto-spectra of leak signals, coherence function, and cross-correlation function are output graphically as shown in Figure 3. The results include the time shift corresponding to the peak of the cross-correlation function, the leak position from the point where leak signal No. 1 is measured, and signal processing and analysis parameters. The output can be sent to the default
†
Leak signals are padded with zero-points to avoid distorting the peak of the cross-correlation function due to signal periodicity assumed in FFT calculations.
6
-printer set up under Windows, copied to Windows’s clipboard for pasting in other applications, or exported to an Excel spreadsheet. The graphs have a "zoom" button and a "live" cursor.
Verification of Results
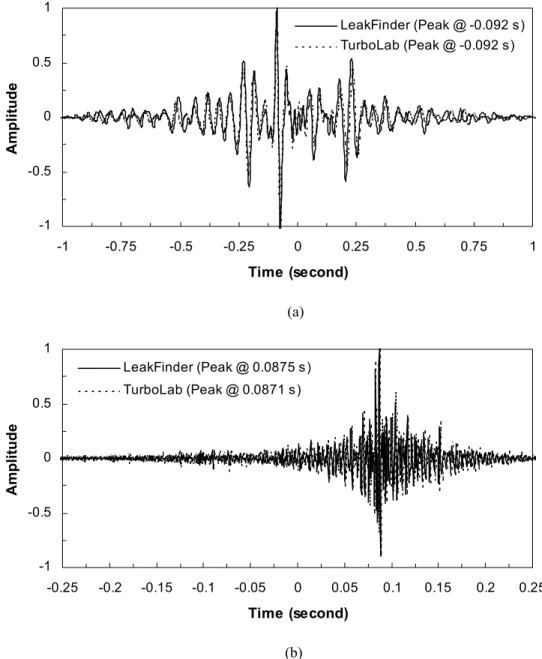
LeakFinder was verified extensively using pure tones, random signals, and actual field data. The results obtained with LeakFinder were compared with those obtained using a data acquisition system consisting of analog-to-digital conversion board, power amplification board, anti-aliasing filters, and third-party spectral analysis software (TurboLab 4.3). Cross-correlation functions of leak signals in plastic and metal pipes obtained with LeakFinder and TurboLab are compared in Figure 4. The peaks of the cross-correlation functions obtained with both systems are almost in perfect agreement. -1 -0.5 0 0.5 1 -1 -0.75 -0.5 -0.25 0 0.25 0.5 0.75 1 Time (second) Am plit ude LeakFinder (Peak @ -0.092 s) TurboLab (Peak @ -0.092 s) (a) -1 -0.5 0 0.5 1 -0.25 -0.2 -0.15 -0.1 -0.05 0 0.05 0.1 0.15 0.2 0.25 Time (second) Am plit ude LeakFinder (Peak @ 0.0875 s) TurboLab (Peak @ 0.0871 s) (b)
Figure 4 Comparison between results obtained using LeakFinder and third-party spectral analysis software (TurboLab 4.3): (a) leak signals in 6” PVC pipe, (b) leak signals in 8” ductile iron pipe