Publisher’s version / Version de l'éditeur:
ASHRAE Transactions, 107, 1, pp. 730-743, 2001-08-01
READ THESE TERMS AND CONDITIONS CAREFULLY BEFORE USING THIS WEBSITE. https://nrc-publications.canada.ca/eng/copyright
Vous avez des questions? Nous pouvons vous aider. Pour communiquer directement avec un auteur, consultez la première page de la revue dans laquelle son article a été publié afin de trouver ses coordonnées. Si vous n’arrivez pas à les repérer, communiquez avec nous à [email protected].
Questions? Contact the NRC Publications Archive team at
[email protected]. If you wish to email the authors directly, please see the first page of the publication for their contact information.
NRC Publications Archive
Archives des publications du CNRC
This publication could be one of several versions: author’s original, accepted manuscript or the publisher’s version. / La version de cette publication peut être l’une des suivantes : la version prépublication de l’auteur, la version acceptée du manuscrit ou la version de l’éditeur.
Access and use of this website and the material on it are subject to the Terms and Conditions set forth at
Sprinklered mercantile fires
Lougheed, G. D.; McCartney, C. J.; Taber, B. C.
https://publications-cnrc.canada.ca/fra/droits
L’accès à ce site Web et l’utilisation de son contenu sont assujettis aux conditions présentées dans le site LISEZ CES CONDITIONS ATTENTIVEMENT AVANT D’UTILISER CE SITE WEB.
NRC Publications Record / Notice d'Archives des publications de CNRC:
https://nrc-publications.canada.ca/eng/view/object/?id=4cf27671-4a4d-4d61-b465-2057e8b49153 https://publications-cnrc.canada.ca/fra/voir/objet/?id=4cf27671-4a4d-4d61-b465-2057e8b49153Sprinklered mercantile fires
Lougheed, G.D.; McCartney, C.; Taber, B.C.
Posting courtesy American Society of Heating, Refrigerating and Air-Conditioning Engineers, Inc. www.ashrae.org Originally published in ASHRAE Transactions
Droits d'auteur : affiché avec la permission de l'American Society of Heating, Refrigerating and Air-Conditionning Engineers Inc. www.ashrae.org
Publié à l'origine dans les transactions ASHRAE.
www.nrc.ca/irc/ircpubs
NRCC-44234
ABSTRACT
This paper presents results of a project initiated by ASHRAE and the National Research Council of Canada to investigate smoke movement resulting from a sprinklered fire in a communicating space into an adjacent large open area, such as an atrium or retail mall. As part of the joint project, a large-scale test facility was established to investigate smoke flow for sprinklered fires.
In this paper, the results of two full-scale fire test series are discussed. In the first series of tests, a propane burner system was used to simulate design fires, which have an initial unsteady stage followed by a fire with a constant heat release rate. A fast t-squared fire was used for the initial fire growth. This fire was allowed to grow to a predetermined heat release rate and subsequently maintained constant.
The second series of full-scale tests were conducted using three fire scenarios simulating typical fire load arrangements found in retail stores. The three scenarios used were as follows: paper towels in cartons, clothing stored in boxes, and children’s toys.
INTRODUCTION
Protecting the occupants of a building from the adverse effects of smoke in the event of a fire is one of the primary objectives of any fire protection system design. Achieving this objective becomes more difficult when dealing with very large spaces, such as an atrium or a mall, where a large number of occupants may be present and the compartment geometries may be complex as well as very large. Because of these diffi-culties, model building codes place restrictions on the use of such spaces in buildings.
Frequently, in buildings with atria or malls, the commu-nicating spaces (shops, walkways, offices, etc.) open onto the interconnected floor space. In NFPA 92B (1995), it is assumed that it will not be possible to manage smoke within the communicating space without the use of physical barriers to limit smoke movement or methods to limit smoke production, such as controlling the fuel or using automatic sprinklers. Although automatic fire suppression is frequently used to reduce smoke production from fires in a communicating space, there are limited data available on the potential size of sprinklered fires and the transport of smoke cooled by sprin-klers. Data such as that produced by Liu (1977) indicate that the smoke from a sprinklered fire may not be buoyant. There are also indications that a sprinklered fire can produce suffi-cient smoke to result in obscurations that exceed normally accepted tenability limits in the compartment of fire origin (Lougheed 1997).
In 1997, a joint research project (ASHRAE Research Project RP-976) was initiated between the American Society of Heating, Refrigerating and Air-Conditioning Engineers, Inc. (ASHRAE), and the National Research Council of Canada (NRC). The objective of this project was to investigate the impact of smoke from a sprinklered fire in a compartment, which is allowed to propagate into a large open area.
Preliminary results of the project were provided in an earlier paper (Lougheed et al. 2000). This paper provided a review of research on the interaction of sprinkler spray with a smoke layer, heat release rate from sprinklered fires, and smoke movement for sprinklered fires. Also, based on tests using steady-state propane fires, approximate heat release rate limits were determined that hot smoke flow was predominant for tests with two and four operating sprinklers.
Sprinklered Mercantile Fires
Gary D. Lougheed, Ph.D.
Cameron McCartney
Bruce C. Taber
Member ASHRAE
Gary D. Lougheed is a senior research officer and Cameron McCartney and Bruce Taber are technical officers in the Fire Risk Management
Program, Institute for Research in Construction, National Research Council of Canada, Ottawa, Ontario.
In this paper, the results of two full-scale fire test series are provided. In the first series of tests, a propane burner system was used to simulate design fires, which have an initial unsteady stage followed by a stage with a steady heat release rate. A fast t-squared fire was used for the initial fire growth. This fire was allowed to grow to a predetermined heat release rate and subsequently maintained constant.
The second series of full-scale tests were conducted using three fire scenarios simulating typical fire loads found in retail stores. The three scenarios used were as follows: paper towels in cartons, clothing stored in boxes, and children’s toys.
The full-scale fire tests were used to investigate sprinkler activation in the test compartment and smoke accumulation in a secondary space representing an atrium or mall. The retail fire scenarios were used to determine the conditions in which nonbuoyant smoke flow would occur. Also, various smoke parameters, including smoke obscuration and CO and CO2 concentrations, were measured in the secondary space to provide data for hazard analysis.
TEST FACILITY
A large-scale test facility was set up to investigate the impact of sprinklers on smoke movement from a compartment into a large adjacent area. This facility was used in the prelim-inary tests with propane-fueled fires to determine the param-eters that affect the smoke temperature (Lougheed et al. 2000). This test made use of a large-scale atrium physical model used for a previous joint project between ASHRAE and NRC (ASHRAE Research Project RP-899). Detailed information
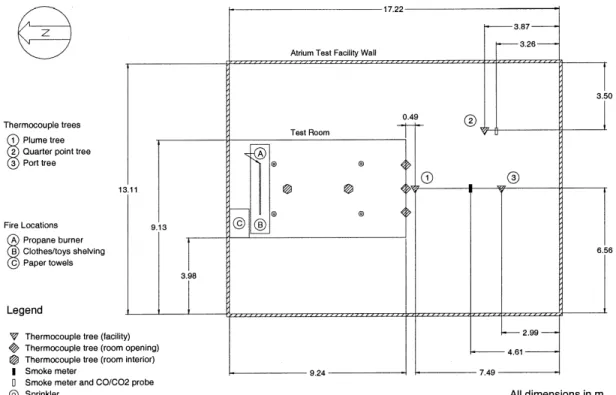
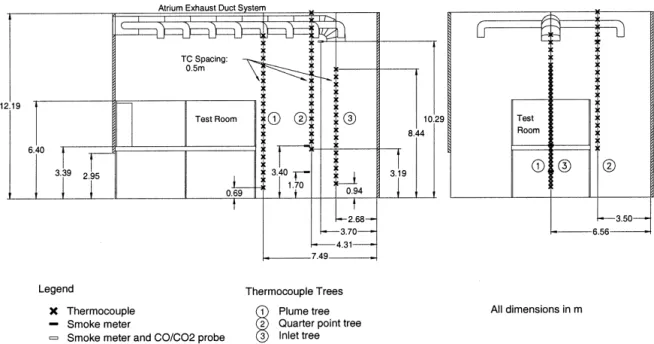
on the atrium physical model is provided in the paper by Lougheed et al. (1999). For this project, a test compartment was constructed inside the atrium facility. A plan and eleva-tion view of the test compartment and the atrium test facility are shown in Figures 1 and 2, respectively. A detailed descrip-tion of the test facility is provided in the paper by Lougheed et al. (2000).
Thermocouple trees were located in the test compartment and the atrium facility. The locations of the thermocouple trees in the atrium facility are shown in Figures 1 and 2.
Three thermocouple trees were installed in the opening in the compartment (Figure 3). These thermocouple trees were located at the 1/4 width, center, and 3/4 width of the opening. In addition, two thermocouple trees, with six thermocouples on each tree, were located inside the test compartment (Figure 3). Detailed information on the location and spacing of the thermocouples is provided in an earlier publication (Lougheed et al. 2000).
In addition to the room and opening thermocouple trees, thermocouples were also installed adjacent to each of the four sprinklers in the test compartment.
Two smoke meters were located in the atrium facility near the compartment opening (Figures 1 and 2). These smoke meters were located 3.3 m from the test compartment at the centerline of the opening and were 1.7 m and 3.7 m above the floor of the main test facility. They were used to determine if the smoke exiting the test compartment was nonbuoyant, resulting in downward smoke flow.
Figure 2 Large-scale atrium facility and instrumentation (elevation).
For all tests with the mechanical exhaust system operat-ing, O2, CO, and CO2concentrations were measured in the exhaust duct. These measurements, combined with tempera-ture and pressure measurements, were used to determine the heat release rate using the oxygen depletion method.
For the mercantile fire tests, the smoke optical density and CO and CO2concentrations were measured near the ceiling of the atrium test facility. The measurement location was at the quarter-point thermocouple tree shown in Figure 1 and was 10.3 m above the floor of the test facility (Figures 1 and 2).
In addition, an FTIR spectrometer was used to provide gas analysis for the mercantile test scenarios. The gas sampling for these measurements varied depending on the test. In the initial tests, the gas was sampled from the exhaust duct at the same location as the gases sampled for the heat release rate measurements. In later tests, the gas sample was extracted from the smoke flow in the upper portion of the test compartment (see Figure 3). The results of these measure-ments will be provided in a subsequent paper.
Two video cameras were located in the atrium facility (Figures 1 and 2). One camera was on the south wall viewing the fire inside the test compartment. The second camera was mounted on the east wall at the same height as the top of the compartment opening and was used to obtain video records of the smoke plume as it exited the test compartment. Video records were also taken of smoke conditions at floor level.
SPRINKLER SYSTEM
A sprinkler system with four pendent sprinklers was installed in the test compartment. The location of the klers is shown in Figure 3. The protection area for each sprin-kler was 12 m2to simulate a sprinkler system in an ordinary hazard occupancy. The distance between the two branch lines was 2.6 m, which is the maximum spacing allowed for an ordi-nary hazard occupancy. The sprinkler spacing on each branch line was 4.6 m. The sprinklers were 2.3 m from the back wall of the test compartment and 1.3 m from the side wall.
Tests were conducted with two water flow rates selected to provide an application density of 6.1 and 8.1 (L/min)/m2, which covers the design range in NFPA 13 (1996) for ordinary hazard occupancies. A pressure gauge was installed in the main sprinkler pipe and was used to monitor the water flow rate during a test. Standard sprinklers with an operating temperature of 74ºC were used for all the tests. Standard sprin-klers were used to provide a worst case situation in terms of sprinkler activation and, thus, the impact of sprinkler suppres-sion on the initial fire development.
FULL-SCALE FIRE TESTS
As discussed in the previous section, the results of the preliminary tests with the propane-fueled burner determined the heat release rates above which the smoke exiting the compartment would be buoyant. The boundary between buoy-ant and nonbuoybuoy-ant flow was dependent on fire location and the sprinkler application density. The results are summarized in Table 1.
The preliminary tests also determined the heat release rate above which more than four sprinklers would be expected to activate. The limits within which further sprinklers might operate in the test configuration ranged from approximately 1500 kW for the low sprinkler application density to approx-imately 2500 kW for the high sprinkler application density.
In this paper, the results of two full-scale fire test series are discussed. The fire loads for these tests were scaled to produce heat release rates in the range determined in the preliminary test series, that is, maximum heat release rates of up to approximately 2500 kW. The setups for these two test series are described in the following sections.
Combination of Unsteady and Steady Fires
For engineering purposes, it is frequently assumed that a fire will grow until it is limited by either fire control activities or the separation distance between neighboring combustibles prevents further fire spread. A t-squared profile is often assumed for the unsteady fire:
(1) where
Q = heat release rate from the fire (kW), t = time after effective ignition (s), tg = growth time (s).
For design fire purposes, the effect of sprinklers is frequently accounted for by assuming the fire stops growing after the sprinklers are activated. That is, it is assumed that the fire will continue to burn at the size at which the sprinklers were activated until the fuel is consumed (NFPA 1995).
For this project, the propane burner used in the steady-state fire tests was used to simulate an initially unsteady fire followed by a steady-state fire. A fast t-squared profile with a growth time tgof 150 s was used for the initial fire growth. The fire was allowed to grow until it reached a predetermined
TABLE 1
Heat Release Rate Limits for Smoke Flow Regimes
Sprinkler Application Density ((L/min)/m2) Burner Location in Test Compartment Upper Limit Cold Smoke Regime (kW) Lower Limit Two-Zone Regime (kW) 4.1 Middle <150 150 4.1 Back <150 300 6.1 Middle 200 750 6.1 Back 300 750 8.1 Middle 500 750 8.1 Back 800 1000 Q 1000 t tg ---- 2 =
heat release rate, Qs. Tests were conducted with Qsvalues of 1000 kW, 2000 kW, and 2500 kW. Based on the previous test series with steady fires (Lougheed et al. 2000), these heat release rates cover the range for which buoyant smoke flow would be obtained for sprinklered fires. The location of the propane burner is shown in Figure 3. This location was also used for the mercantile tests with clothing and toys described in the next section.
The propane burner fire tests were used to investigate the following aspects of sprinklered mercantile fires:
1. the activation of the sprinklers,
2. smoke accumulation in the secondary space without mechanical exhaust, and
3. smoke accumulation in the secondary space with mechan-ical exhaust.
Mercantile Fire Tests
A series of fire tests was conducted simulating fire load scenarios observed in retail stores. The following criteria were used in developing the fire scenarios:
1. The fire loads should be sufficient to produce peak heat release rates, which would activate four sprinklers. However, the peak heat release rates should not exceed 2500 kW for extended periods.
2. The fire location was shielded from direct sprinkler spray. The shielding method was consistent with situations common in occupied areas of stores.
3. The fire loads should be representative of commodities that would be found in retail stores.
Bulk Storage and Display
Frequently, for bulky commodities, such as paper towels and potato chips, among others, a retail outlet will use the orig-inal cartons as part of the display in the occupied area. In this way, the impact of such commodities on limited storage area is minimized. However, such displays can result in a substan-tial localized fuel load in the retail area. For example, stacked paper products with more than 100 cartons were observed in some outlets with the top of the stored items close to the ceil-ing.
Such fuel loads are frequently stored near the store walls in a back corner. The walls are typically lined with a material, such as medium density fiberboard, pegboard (6 mm thick hardboard), or plywood, which are used to hold shelves. All three materials have similar fire growth rates when evaluated using a standard room test arrangement (Torvi et al. 1999). For this project, the area of the test facility used for the fire tests was lined with plywood.
Three fire tests were conducted with 30-40 cartons containing paper towels. Each carton was 381 mm by 510 mm by 572 mm high. The cartons were stacked in a back corner of the test facility (see Figures 1 and 3). The fuel load and arrangement of the cartons for each test are given in Table 2.
The fuel load includes both cartons filled with paper towels, the plywood lining the walls of the test facility, and wood pallets. For the test arrangement, the width refers to the number of stacked cartons parallel to the back wall of the test compartment.
For the first test, the cartons were not restrained and the boxes fell over during the test, allowing the sprinkler spray access to the fire. In the subsequent tests, the cartons were restrained using wires. This simulated a situation in which the fuel package was part of a larger fuel load.
Shelving Storage
Retail outlets frequently store excess stock in the retail area utilizing the shelving units used for display. One approach is to store the merchandise on top of the shelving. With this approach, a stack of cartons containing merchandise acts as a shield for the displayed items on the shelves. Such storage is most common in retail establishments with high ceiling heights and is thus not typical of the retail areas that were simulated in the test arrangement. As such, this scenario was not evaluated. However, it is a situation that can be found in stores linked to malls and could potentially result in a shielded fire situation. (Note: In retail spaces with ceiling heights of 3-3.6 m, this storage arrangement can result in limited clearance above the stored items. In some cases, the clearance between the sprinkler deflector and the top of the storage does not meet the minimum spacing [457 mm] required by NFPA 13 [1996] resulting in noncode conform-ance.)
A second approach is to use a multi-level shelving unit or tables for both display and storage. The top of the table or upper shelves is used for display and the lower section is used for storage. This was the situation used for the full-scale fire tests. One series of tests was conducted using clothing stored in cardboard cartons as the fuel load. The second series of tests was conducted using toys in their original packaging. In both cases, the fuel load footprint was limited to a 0.91 m by 4.8 m area. The fuel package was at the same location as used for the propane-fueled tests (see Figures 1 and 3).
The fuel loads used for the clothing test are shown in Table 3. The fuel load listed in Table 3 includes the shelving material with 57 kg of melamine painted particleboard used for each level. However, typically only a small amount of shelving material (<10%) was burnt in these tests. The primary fuel was the clothing and cardboard cartons.
TABLE 2
Fuel Load for Paper Towel Fire Tests
Test
Number of Cartons
Carton Arrangement (Width× Depth× Height)
Fuel Load (kg)
75 30 2× 3× 5 208.7 76 32 2× 4× 4 223.2 77 40 2× 4× 5 279.2
Identical fuel packages (95 kg of toys, including packag-ing materials and 114 kg of melamine painted particleboard) were used for the two tests with toys. The toys were selected to provide a range of polymeric materials (polyethylene, polypropylene, polyurethane, and PVC, among others). The fuel load included the particleboard used for the shelving. However, typically only a small amount of shelving material (<10%) was burnt in the shelving tests. The primary fuel was the toys and the packaging materials, including the cardboard cartons.
For the majority of the tests, a single level rack was used for the fuel package. Particleboard painted with melamine was used to hold the fuel 150 mm above the floor. A second level of particleboard located 997 mm above the floor provided shielding from the sprinkler spray. In addition, two tests were conducted using the clothing with a two-tier shelving system. In these tests, the bottom shelving section was identical to that used in the single-tier test. However, in these tests, cartons containing clothing were placed on the second shelving level and particleboard sheets located 1949 mm above the floor were used to provide shielding.
PROPANE BURNER TEST RESULTS
The propane burner fire tests were used to simulate retail fires with an initial fast t-squared fire growth followed by a steady-state fire. The propane flow rate was controlled using a programmable controller for a valve in the propane line.
A total of 16 tests were conducted using the test parame-ters shown in Table 4. The first two tests were exploratory in nature conducted to develop the burner control profile. These tests were conducted prior to calibration and the results are not included in the following discussion.
Sprinkler Activation
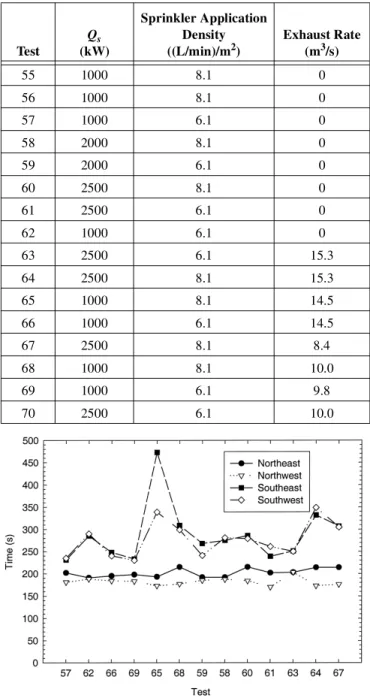
The sprinkler activation times are shown in Figure 4. The test results were sorted according to heat release rate and the sprinkler application density.
The activation times for the northeast and northwest sprinklers, which were closest to the fire, were consistent from test to test. The activation times for the northwest sprin-kler occurred between 170 s and 200 s compared to 190 s and 215 s for the northeast sprinkler. Although the propane burner was symmetrical on the centerline of the test
compart-ment, visual observations indicated a faster fire growth on the west side of the compartment.
The activation time for the southeast and southwest sprin-klers show more dependence on the test conditions and, in particular, on the sprinkler application density. For tests with an application density of 6.1 (L/min)/m2, the second set of sprinklers typically activated between 231 s and 285 s after the start of the fire. With the 8.1 (L/min)/m2application density, the activation times ranged from 275 s to 473 s. However, the extended activation time in test 65 was atypical. The last sprin-kler was usually activated within 350 s.
TABLE 3
Fuel Loads for Full-Scale Clothing Fire Tests
Test
Number of Cartons
of Clothing Shelving Levels
Fuel Load (kg) 78 12 1 344.8 79 13 1 350.1 80 24 2 624.3 83 24 2 607.1 TABLE 4
Full-Scale Propane Fire Tests
Test Qs (kW) Sprinkler Application Density ((L/min)/m2) Exhaust Rate (m3/s) 55 1000 8.1 0 56 1000 8.1 0 57 1000 6.1 0 58 2000 8.1 0 59 2000 6.1 0 60 2500 8.1 0 61 2500 6.1 0 62 1000 6.1 0 63 2500 6.1 15.3 64 2500 8.1 15.3 65 1000 8.1 14.5 66 1000 6.1 14.5 67 2500 8.1 8.4 68 1000 8.1 10.0 69 1000 6.1 9.8 70 2500 6.1 10.0
Figure 4 Sprinkler activation times for propane burner tests.
The sprinkler activation data indicate that fires with heat release rates of approximately 1000 kW or higher would acti-vate four sprinklers. With the fast t-squared fires, the activa-tion times for the sprinklers closest to the burner varied by 25-30 s. There was a larger variation in the activation times for the second set of sprinklers. The predominant effect was due to the sprinkler application density.
Heat Release Rates
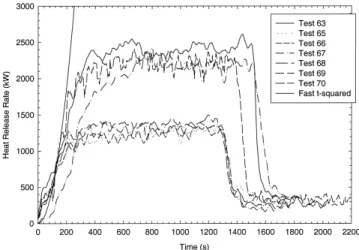
For tests 63-70, a mechanical exhaust system was used to exhaust the smoke from the test facility. An instrumentation station was located in the exhaust duct to measure the heat release rate using the oxygen depletion method. The heat release rates are shown in Figure 5. Also shown are the programmed heat release profiles with the initial t-squared fire growth phase and subsequent steady-state fire.
Two steady-state fire scenarios (approximately 1000 kW and 2500 kW) were used for the tests. The results show good comparison between the measured and programmed curves during the fire growth phase. The measured heat release rates in the steady-state phase were approximately 25% higher for the nominal 1000 kW tests and 10% lower for the 2500 kW tests. This variation in the heat release rates was systematic, indicating it was most likely due to variability in the controller and the propane fuel system. This conclusion is consistent with the opening temperature results discussed in the next section.
Temperatures in the Compartment Opening
In the preliminary tests with a steady-state propane-fueled burner, the variations in the temperatures measured in the compartment opening versus heat release rate were deter-mined (Lougheed et al. 2000). The temperatures were depen-dent on the sprinkler application density, the height above the floor of the compartment, and the heat release rate for the fire.
In Figure 6, the temperatures measured at six levels in the compartment opening during the steady-state phase of the t-squared fire tests are compared with the temperature profiles determined with the steady-state fire tests. The sprin-kler application density was 8.1 (L/min)/m2. The temperature profiles are comparable for the two series of tests.
Smoke Accumulation
For tests 63-70, an exhaust fan was used to vent smoke from the large space adjacent to the test compartment. The fan was operated at two nominal exhaust rates. The mass flow rate measured in the exhaust duct is shown in Table 5. All tests had an extended period with a steady heat release rate (see Figure 5).
The temperatures, measured at the thermocouple tree located at the quarter-point of the large space, were used to determine the height of the smoke layer above the floor. The smoke layer interface height was determined using the 80% temperature rise criteria developed in the investigations on atrium exhaust (Lougheed et al. 1999). This criterion assumes that the smoke layer interface is located at the height at which the measured temperature is 80% of the temperature measured in the smoke layer. The results are shown in Table 5.
The thermocouples used to estimate the smoke layer height were spaced at 0.5 m. Also, with the sprinklered fires, the temperature difference produced in the large space was small. As a result, there is a degree of uncertainty in the esti-mated location for the smoke layer interface.
In addition to the estimates using the 80% criterion, the smoke layer interface was also estimated by determining the height at which the maximum slope in temperature was located. This criterion has been used in some references as the basis for estimating the height of the smoke layer interface (Luo et al. 1997). The smoke layer interface heights estimated using this criterion were consistent with those estimated using the 80% temperature criterion, with the location of the inter-face typically 0.5 m lower using the maximum slope method.
Figure 5 Measured heat release rates for propane burner tests.
There are two methods provided in NFPA 92B for esti-mating the mass flow rate in plumes produced by fires in communicating spaces. The first method assumes the plume is through wall openings, such as windows or doors. In this case, the mass flow rate is determined using an equivalent axisym-metric plume using a correction factor given by the following relation:
a= 2.4Aw2/5Hw1/5– 2.1Hw1/2 (2) where
a = correction factor (m),
Aw = area of ventilation opening (m2), Hw = height of the ventilation opening (m).
The mass flow rate in the plume from the opening is given by
= 0.071Qc1/3(zw+ a)5/3+ 0.0018Qc (3) where
= mass flow rate in plume at height zw(kg/s), a = correction factor (m),
Qc = convective portion of the heat release rate (kW), zw = height above the top of the opening (m).
The mass flow rate at the smoke layer interface height estimated using Equation 3 is shown in Table 5. The top of the opening in the test compartment was 6.4 m above the floor of the atrium test facility (Figure 3). The mass flow rate estimated using Equation 3 is comparable to the mass flow rate measured in the duct. The variation is ±20%, which is reasonable consid-ering the uncertainties in the estimates for the various param-eters.
The data are limited. However, the variation in the mass flow rate does not show any dependence on the major param-eters varied in the test. This includes the sprinkler application density, heat release rate, and exhaust mass flow rate.
The mass flow rate from a communicating space can also be estimated using an equation developed for balcony spill
plumes, if the fire is assumed to be immediately adjacent to the opening. In this case, the mass flow rate is given by
= 0.36(QW2)1/3(Zb+ 0.25H) (4) where
= mass flow rate in plume (kg/s), Q = heat release rate (kW),
W = width of the plume as it spills under the balcony (m), Zb = height above the balcony (m),
H = height of the balcony above the fuel (m).
Mass flow rate estimates using Equation 4 were more than twice the mass flow rate measured in the exhaust duct. As such, this approach did not provide a good estimate of the mass flow rate produced by the sprinklered fires. This is reasonable as the fire location was inside the compartment well away from the opening.
MERCANTILE FIRE TEST RESULTS
A series of full-scale fire tests were conducted with typi-cal fuel loads found in retail stores. This included stacked cartons containing paper towels, clothing in boxes on shelves, and toys in their original packaging. The fuel loads for the tests were scaled such that the maximum heat release rate would be less than 2500 kW. The fire area was shielded using typical situations found in stores. All tests except test 76 with paper towels were conducted using a sprinkler application density of 8.1 (L/min)/m2. For test 76, the sprinkler application density was 6.1 (L/min)/m2.
The mercantile fire tests simulated fire scenarios that would be controlled using four or fewer sprinklers. A detailed description of the test setup was provided in a previous section. In this section, the results of these tests are used to investigate the hazard in a large space as a result of a sprin-klered fire in an adjacent mercantile area.
TABLE 5
Smoke Levels in Steady-State Fire Phase
Test
Heat Release Rate (kW)
Smoke Layer Height (m)
Mass Flow Rate Duct (kg/s)
Mass Flow Rate, Equation 3 (kg/s) 63 2300 8.7 12.8 14.2 64 2300 8.5 12.8 13.4 65 1300 8.5 12.1 10.3 66 1300 8.7 12.1 11.0 67 2300 7.2 7.0 8.9 68 1300 7.5 8.3 7.4 69 1300 8.2 8.2 9.4 70 2300 7.7 8.3 10.5 m· m· m· m·
Heat Release Rates
The heat release rates measured for the mercantile fire tests are shown in Figures 7 and 8. The results for tests 76 and 82 are not included. In test 76, the sprinklers extinguished the fire and the heat release rate was minimal. For test 82, there was a problem with the instrumentation in the exhaust duct, resulting in erroneous data.
In the test procedure, the exhaust system used to simulate smoke management in the large space was also used for the heat release rate measurements. To simulate the automated activation of the system using smoke alarms or other control measures, the exhaust system was not turned on until the first sprinkler was activated. As a result, there was no heat release rate measurement prior to 150-200 s.
The fast t-squared fire curve is also shown. The time scale for the theoretical curve was shifted by 100 s. The fire growth rates for the clothing and toy tests were comparable to the fast t-squared rate after the initial incubation period.
For the tests with the clothing and toys, the heat release rate reached a maximum in the initial 300-400 s followed by a steady-state plateau with heat release rates in the 1000-1500 kW range. In both cases, there was a subse-quent decrease in the heat release rate as the fuel was depleted.
With the toys, the decay phase was relatively short compared with the clothing scenario. In the latter case, the clothing provided a thick fuel bed with the burning predomi-nantly on the exterior surfaces of the fuel. As a result, an extended time was required to fully deplete the fuel load. For example, the heat release rate for test 83 exceeded 500 kW for up to 1000 s after the ignition.
The heat release rate varied from test to test with the paper towel fire load. In test 75, the fire growth was slowed by the initial sprinkler operation. It subsequently increased to a peak of 1200 kW before the boxes fell, exposing the fire to the sprinkler spray.
In test 77, the boxes were held in place using wires. This resulted in an extended test as the fire burrowed into the fuel package. There was a slow increase in the fire for the initial 1200 s followed by a steady phase at a heat release rate of 1300 kW. After 2200 s, there was an extended decay phase until the fire was extinguished at 4600 s. This fire profile is indicative of a buried fire in an extended bulk fuel package.
Sprinkler Activation
The sprinkler activation times for the mercantile fire tests are shown in Table 6.
For tests with toys and clothing, the fire location was the same as used in the propane burner tests (Figure 3). Overall, the activation times for the sprinklers are comparable for the three fuel packages. The initial sprinkler activation was at
165-175 s for the toy tests and at 200-210 s for the clothing tests, and all four sprinklers were activated by 300 s.
For tests with paper towels, the fuel package was located in a back corner of the test compartment. With this location (Figure 3), the distance over which the smoke produced by the fire had to travel through the sprinkler spray was increased, resulting in further cooling of the smoke. As a result, the acti-vation time for the second and subsequent sprinklers was delayed relative to the other three fire scenarios.
For test 77, in which the fire continued to grow after initial sprinkler operation (Figure 7), the sprinklers near the front of the compartment were eventually activated, result-ing in a coolresult-ing of the hot layer exitresult-ing the compartment opening. However, even with the cooling by the water spray over the 9 m length of the test compartment, the tempera-tures near the ceiling remained above ambient and the smoke was buoyant.
Figure 7 Heat release rates for paper towel and toy fire tests.
Smoke Accumulation
An exhaust fan was used to vent smoke from the large space adjacent to the test compartment. The fan capacity for the mercantile fire tests was the same as the lower condition used for the propane burner simulations. The mass flow rate measured in the exhaust duct is shown in Table 7.
The volume of the test facility above the top of the open-ing was limited. As a result, there was a rapid fillopen-ing (<90 s) with smoke even though the exhaust fan was operating. With the limited temperature increase produced by the sprinklered and the large (0.5 m) spacing between the thermocouples, it was impossible to determine the smoke filling versus time profile. However, a minimum smoke layer height during the steady heat release phase could be determined. The results are shown in Table 7. As with the propane burner tests, this height was estimated using the temperatures measured by the
ther-mocouple tree located at the quarter-point of the large volume space.
The smoke mass flow rates estimated using Equation 3 are also shown in Table 7. The calculated mass flow rates are based on the measured heat release rates and the minimum smoke layer heights. As with the propane burner tests, there is a good comparison between the measured flow rate in the exhaust duct and the estimated smoke mass flow rate for those cases.
The major differences occur in those cases in which an extended plateau in the heat release rate was not observed. In these cases, using the peak heat release rate in Equation 3 will result in a high estimated smoke mass flow rate.
Overall, the estimated and measured mass flow rates differed by 10-25%. Considering the uncertainties in the measurements, this is a reasonably good comparison, indicat-ing that the smoke flow rate from the test compartment
TABLE 6
Sprinkler Activation Times for Mercantile Fire Tests
Test Fuel NE Sprinkler (s) NW Sprinkler (s) SE Sprinkler (s) SW Sprinkler (s)
75 Paper Towels 338 184 n/a* n/a 76 Paper Towels 297 n/a n/a n/a 77 Paper Towels 401 246 n/a 1171 78 Clothing 205 199 n/a 243 79 Clothing 219 211 246 238 80 Clothing 265 198 299 284 81 Toys 197 165 234 256 82 Toys 178 175 272 277 83 Clothing 199 199 247 246 * n/a—not activated TABLE 7
Smoke Levels in Mercantile Fire Tests
Test
Peak Heat Release Rate (kW)
Smoke Layer Height (m)
Mass Flow Rate Duct (kg/s)
Mass Flow Rate, Equation 3 (kg/s) 75 1500 8.7 11.8 11.7 76 n/a* 8.7 13.6 n/a 77 1300 8.2 10.8 9.5 78 1250 8.7 11.5 10.8 79 1000 8.7 11.2 9.8 80 1650 7.7 8.8 8.9 81 1400 7.7 9.0 8.2 82 n/a 7.2 7.7 n/a 83 1550 7.7 8.8 8.6 * n/a—not available
produced by the sprinklered fire can be approximated, assum-ing the relationship developed for smoke flow through an opening (Equation 3).
Smoke Measurements in the Upper Layer
For the mercantile fire tests, CO and CO2concentrations and smoke obscuration were measured in the upper layer in the secondary test space at the location shown in Figures 1 and 2. The smoke density measurements are shown in Figure 9. The CO and CO2concentrations are shown in Figures 10 and 11, respectively.
The peak smoke obscurations ranged from approximately 0.1 OD/m for tests 78 and 79 to a maximum of 0.8 OD/m in test 81. (The smoke data are not available for tests 82 and 83. However, the CO2results for these tests are comparable to those measured in tests 80 and 81. It is expected that the smoke densities should also be comparable.)
For tests 78 and 79, the visibility range was 5-10 m. This is approaching the minimum visibility range, which is gener-ally suggested for occupants familiar with a building or able to dash to safety (3-5 m). However, it exceeds the minimum 15-20 m visibility range (0.04-0.08 OD/m) that is suggested for the safe evacuation of occupants who are not familiar with the building (Tamura 1994).
The maximum smoke density levels of 0.4-0.8 OD/m (1-2 m visibility) measured in the other tests exceed the normal tenability criteria. However, these levels are lower than the 4-10 OD/m, which can be reached under adverse fire conditions.
The maximum CO concentrations were in the range of 0.02-0.08% (Figure 10). These levels are lower than the levels that would cause incapacitation with extended exposure (0.14-0.17% for 30 minute exposures [Purser 1995]). However, with maximum concentrations of 0.08%, the CO levels did approach the tenability limits.
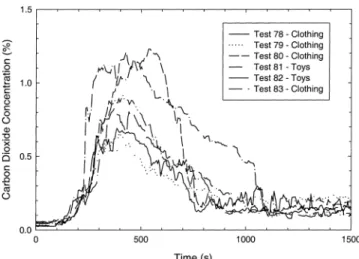
The CO2concentrations are shown in Figure 11. There was a rapid increase in the CO2levels between 200 s and 400 s after the fire was ignited. This is consistent with the fire growth observed during the tests in which there was an initial slow fire development followed by rapid increase in heat release rate (Figures 7 and 8).
Following the initial fire development, the CO2 concen-tration remained constant for up to 300 s. This period coin-cided with the stage of the fire during which the heat release rate was constant and the smoke level was maintained at a fixed height.
There was a subsequent decrease in the CO2 concentra-tions during the decay phase of the fire. The time required for the fire to decay was dependent on the type of fuel. In the toy tests, the fuel load was quickly depleted, resulting in a rapid decrease in fire size. For the test with clothing stored in boxes, a deep fuel bed was formed, resulting in a slower decrease in the fire size. The CO2measurements indicate there was smoke accumulation in the upper level of the secondary space for up to 900 s (15 min).
Figure 9 Smoke obscuration in the upper layer for mercantile fire tests.
Figure 10 Carbon monoxide concentrations in the upper layer for mercantile fire tests.
Figure 11 Carbon dioxide concentrations in the upper layer for mercantile fire tests.
Smoke Obscuration for Nonbuoyant Smoke
In addition to the smoke density measurements in the upper layer of the secondary space, the smoke density was also measured at two heights near the compartment opening (Figures 1 and 2). These devices were used to measure the smoke obscuration in any nonbuoyant smoke produced by the fire.
The smoke densities measured with the device 3.4 m above the floor of the secondary test space are shown in Figure 12. The obscuration levels at the two measurement heights were comparable and the results shown are typical of those measured at the two heights.
During fire development and the steady heat release phase, there was no indication of smoke at the two measure-ment locations. Initial smoke accumulation was 600-900 s after the fire was ignited. This was during the decay of the fire as the heat release decreased below the minimum required to maintain a buoyant smoke flow with the sprinklers operating. The heaviest accumulation of smoke was for the clothing tests in which the fire decay was relatively slow, resulting in extended time during which nonbuoyant smoke was produced.
With the exhaust fan operating, the smoke densities were less than 0.2 OD/m. In test 80, the fan was shut off in the latter stage of the test. The smoke density subsequently increased to 0.6 OD/m.
At 0.2 OD/m (approximately, 5 m visibility range), the smoke densities measured for the nonbuoyant smoke did exceed the levels suggested for occupants unfamiliar with a building. However, the physical extent of smoke outside the test compartment was limited and building occupants could readily move outside the area with nonbuoyant smoke.
The above comment applies only to the smoke in the secondary space. Within the sprinklered compartment, there was a rapid smoke accumulation throughout the test compart-ment with fire decay and the subsequent cooling of the smoke by the sprinkler spray. This is consistent with observations during other full-scale fire tests with sprinklers (Heskestad 1991; Lougheed et al. 2000). This indicates that the nonbuoy-ant smoke produced during the decay phase of the fire is of more concern for occupants in the fire compartment or in confined spaces, such as corridors connected to the fire compartment. In these locations, it is more likely that the occu-pants can become enveloped in the rapidly descending nonbuoyant smoke layer.
For all tests except test 80, the smoke exhaust system was used in the large secondary space. In test 80, the smoke exhaust system was shut off at approximately 1000 s after the fire was started. There was a subsequent increase in smoke obscuration to 0.6 OD/m, indicating an increased smoke accu-mulation near the compartment opening without the exhaust fan. This is consistent with observations on smoke flow made during the tests. The nonbuoyant smoke exiting the compart-ment initially flowed down and away from the opening. However, with the exhaust fan operating, the smoke flow did
not reach the floor of the main facility. Once the smoke flow was 3-4 m from the compartment opening, the general flow pattern was up.
DISCUSSION AND CONCLUSIONS
Fire Size
Because of the size limitations of the test facility, the fuel load and thus the maximum fire size for the tests discussed in this paper were limited. Specifically, only four sprinklers were included in the fire compartment. Based on the prelimi-nary work with steady-state propane burner fires, it was deter-mined that the maximum heat release rate should be less than 2500 kW (Lougheed et al. 2000). Otherwise, the temperature in the smoke layer would exceed 100ºC and more than four sprinklers would be activated. (The temperature in the buoy-ant smoke layer with the sprinklers operating is dependent on a number of factors, including fire location, fire size, ceiling height, and sprinkler application density, among others. The 2500 kW limit is for four operating sprinklers with an appli-cation density of 8.1 [L/m]/m2with the fire located midway between the back wall of the test compartment and the first set of sprinklers as shown in Figure 3.)
There is very limited information in the literature regard-ing the number of sprinklers activated by fires in various occu-pancies. However, indications are that in only 10% of fires or less are more than four sprinklers activated (Johnson 1998). Similar results were found using four years of accumulated data in the U.K. fire statistics for fires in public access areas of retail premises (Morgan 1998). Specifically, it was deter-mined that for 133 fires in such premises, more than four sprin-klers were activated in eight incidents and more than two sprinklers in 52 incidents.
Thomas (1997) provides an overview of the fire statistics for retail premises from the U.S. for the years 1983 to 1993. The results indicate that with sprinklers present and operated, Figure 12 Smoke obscuration below test compartment for
the extent of flame damage was reduced compared to the fires with sprinklers not present. With sprinklers present and oper-ated, the fire extent was limited to the object of origin or to the area of the room of origin for 76% of the fires. Of the remain-ing fires, 14% had flame damage limited to the room of fire origin and the remaining 6% of fires had flame damage extending beyond the room of fire origin. This is compared with about 25% of the fires having flame damage beyond the compartment of fire origin for the case without sprinklers.
Similarly, there was a reduction in the number of fires resulting in smoke damage beyond the room of fire origin for fires with sprinklers present and operated (approximately 34%) compared with 45% for fires with sprinklers not present. By comparison, the fire scenarios used in the full-scale fire tests were able to consistently activate four standard response sprinklers. For the shielded shelving scenarios (toys and clothing), the fire was limited to an approximately 5 m2 area of the test compartment. In terms of fire size (heat release rate), the test scenarios should cover 75-90% of the fires that occur in retail premises.
To summarize, the fire scenarios did not simulate the 5 MW convective heat release rate fires with a fire area of 10 m2that are frequently used as design fires for retail applications (NFPA 1995; Hansell and Morgan 1994). Fires larger than 2500 kW should activate more than four sprinklers and were beyond the limits of the test facility. However, the fire scenarios used in the tests did produce heat release rates of 1000- 2500 kW and results should be comparable to or exceed those produced by most fires in retail mall situations.
Sprinkler Activation
For both the propane burner fires and the mercantile fire simulations, four standard response sprinklers were activated. The response time was dependent on a number of factors, including the maximum heat release rate for the fire and the sprinkler application density.
There was minimal variation in the activation time of the first two sprinklers. The activation of the third and fourth sprinkler showed more dependence on the test scenario. However, even for these sprinklers, there was not a substantial variation in activation times.
Smoke Accumulation
The smoke temperature, and thus its buoyancy, were dependent on the fire size. If the heat release rate for the fire exceeded 1000 kW, a hot upper layer was formed and the smoke flow exiting the compartment was buoyant. The smoke temperature profiles measured in these tests were consistent with those measured using the steady-state propane burner fires discussed in the previous paper (Lougheed et al. 2000).
For both the propane burner fires and the mercantile fires, there was an extended period of time during which the fire heat release rate exceeded 1000 kW. During this phase of the fire, the smoke level in the large secondary space was determined and the smoke mass flow rate into the smoke layer estimated,
using the measured flow rates in the smoke exhaust system. These measured results were comparable to the mass flow rates calculated using the equation provided in NFPA 92B (NFPA 1995) for smoke flow rate into an atrium through an opening. However, the measured mass flow rates were more than 50% lower than the estimates calculated using the equa-tions for balcony spill plume (NFPA 1995).
During the fire decay stage with the mercantile fires, the heat release rate decreased to less than 1000 kW. The smoke in the compartment became nonbuoyant, resulting in smoke accumulation outside the compartment opening. The accumu-lation of nonbuoyant smoke was more extensive for the cloth-ing tests than with the toys. With the clothcloth-ing, a relatively deep fuel bed was formed, resulting in a slower fire decay compared to the tests with toys in which there was a more rapid depletion of fuel.
Smoke Properties
The smoke optical density and CO and CO2 concentra-tions were measured in the upper portion of the large second-ary space. In several of the mercantile fire tests, the CO concentrations and the smoke optical densities approached or exceeded tenability limits. This indicates that for the more severe fires in retail premises, the conditions in the smoke layer during the initial stages of the fire could impede occu-pant egress. However, during this stage of the fire, the buoyant smoke could be removed from the large space using the smoke exhaust system. This system was able to limit the smoke filling in the secondary portion of the test facility.
The smoke optical densities were also measured in the nonbuoyant smoke produced during the fire decay. The smoke levels did approach tenability limits. However, the area encompassed by the nonbuoyant smoke in the larger space was limited. Also, the accumulation of nonbuoyant smoke occurred late in the fire event (after 10-15 min). By this time, the building occupants should have moved away from the fire area.
The accumulation of nonbuoyant smoke was more rapid within the compartment. Although there was no direct measurements of the smoke density, visual observations would indicate that it exceeded the tenability limits. This would suggest that the nonbuoyant smoke could be a greater threat to occupants in confined areas, including the fire compartment and adjacent corridors. However, even in these situations, previous work indicates there should be sufficient time for occupants to safely evacuate the immediate fire (Lougheed 1997).
It was also observed that with the exhaust fan operating, there was a general upward flow of the nonbuoyant smoke once it had moved away from the compartment opening. This resulted in a decrease in the smoke obscuration throughout the large secondary area. As such, a smoke exhaust system could provide an additional level of protection during the later stages of a fire.
REFERENCES
Hansell, G.O., and H.P. Morgan. 1994. Design approaches for smoke control in atrium buildings, BR-258. Garston, U.K.: Building Research Establishment.
Heskestad, G. 1991. Sprinkler/hot layer interaction, NIST-GCR-91-590. Gaithersburg, Md.: National Institute of Standards and Technology.
Liu, S.T. 1977. Analytical and experimental study of evapo-rative and room fire suppression by corridor sprinkler system, NBSIR 77-1287. Gaithersburg, Md.: National Institute of Standards and Technology.
Lougheed, G.D. 1997. Expected size of shielded fires in sprinklered office buildings. ASHRAE Transactions 103(1): 395-410.
Lougheed, G.D, G.V. Hadjisopocleous, C. McCartney, and B.C. Taber. 1999. Large-scale physical model studies for an atrium smoke exhaust system. ASHRAE Transac-tions105(1): 676-698.
Lougheed, G.D., C. McCartney, and B.C. Taber. 2000. Smoke movement for sprinklered fires. ASHRAE Trans-actions106(1): 605-619.
Luo, M., Y. He, and V. Beck. 1997. Application of field model and two-zone model to flashover fires in a full-scale multi-room single level building. Fire Safety Jour-nal29: 1-25.
Johnson, P. 1998. Shattering the myths of fire protection engineering. Fire Protection Engineering, issue 1, pp. 18-27.
Morgan, H.P. 1998. Sprinklers and fire safety design. Fire Safety Engineering5: 16-20.
NFPA. 1995. NFPA 92B, Guide for smoke management sys-tems in malls, atria, and large areas. Quincy, Mass.: National Fire Protection Association.
NFPA. 1996. NFPA 13, Standard for the installation of sprinkler systems. Quincy, Mass.: National Fire Protec-tion AssociaProtec-tion.
Purser, D. 1995. Toxicity assessment of combustion prod-ucts. The SFPE Handbook of Fire Protection Engineer-ing. Quincy, Mass.: National Fire Protection Association.
Tamura, G.T. 1994. Smoke movement and control in high-rise buildings. Quincy, Mass.: National Fire Protection Association.
Thomas, I.R. 1997. Analysis of USA retail fires. Bethesda, Md.: Society of Fire Protection Engineers.
Torvi, D.A., G.D. Lougheed, D.W. Carpenter, P.L. Senez, and H.A. Locke. 1999. Evaluating materials and fire protection systems using full-scale fire tests. Proceed-ings Third International Conference on Fire Research and Engineering, Chicago, Ill., pp. 363-374.