Publisher’s version / Version de l'éditeur:
Polymer Degradation and Stability, 49, pp. 21-28, 1995
READ THESE TERMS AND CONDITIONS CAREFULLY BEFORE USING THIS WEBSITE. https://nrc-publications.canada.ca/eng/copyright
Vous avez des questions? Nous pouvons vous aider. Pour communiquer directement avec un auteur, consultez la
première page de la revue dans laquelle son article a été publié afin de trouver ses coordonnées. Si vous n’arrivez pas à les repérer, communiquez avec nous à PublicationsArchive-ArchivesPublications@nrc-cnrc.gc.ca.
Questions? Contact the NRC Publications Archive team at
PublicationsArchive-ArchivesPublications@nrc-cnrc.gc.ca. If you wish to email the authors directly, please see the first page of the publication for their contact information.
NRC Publications Archive
Archives des publications du CNRC
This publication could be one of several versions: author’s original, accepted manuscript or the publisher’s version. / La version de cette publication peut être l’une des suivantes : la version prépublication de l’auteur, la version acceptée du manuscrit ou la version de l’éditeur.
Access and use of this website and the material on it are subject to the Terms and Conditions set forth at
Surface and bulk analysis of the oxidation of polyolefins
Lacoste, J.; Deslandes, Y.; Black, P.; Carlsson, D. J.
https://publications-cnrc.canada.ca/fra/droits
L’accès à ce site Web et l’utilisation de son contenu sont assujettis aux conditions présentées dans le site LISEZ CES CONDITIONS ATTENTIVEMENT AVANT D’UTILISER CE SITE WEB.
NRC Publications Record / Notice d'Archives des publications de CNRC:
https://nrc-publications.canada.ca/eng/view/object/?id=9898056f-b846-4c3e-88ae-54eef64a3a21 https://publications-cnrc.canada.ca/fra/voir/objet/?id=9898056f-b846-4c3e-88ae-54eef64a3a21
ELSEVIER
Surface and bulk
zyxwvutsrqponmlkjihgfedcbaZYXWVUTSRQPONMLKJIHGFEDCBAPolymer Degradation and Stability 49 (1995) 21-28
0 1995 Elsevier Science Limited
0141-3910(95)00044-5
Printed in Northern Ireland. All rights reserved 0141-3910/95/$09.50
analyses of the oxidation of
polyolefins
J
.Lacoste,*’ Y. Des1andes,2 P. Black’ & D. J. Carlsson*
zyxwvutsrqponmlkjihgfedcbaZYXWVUTSRQPONMLKJIHGFEDCBA ‘Ecole Nationale Suptrieure de Chimie de Clermont- Ferrand et URA CNRS 433, 63177- AubiZre Cedex, France21nstitute for Environmental Chemistry , National Research Council, Ottawa KIA 0R6, Canada (Received 23 December 1994; accepted 5 February 1995)
The non-uniformity of oxidation across polypropylene and polyethylene films has been measured by a combination of X-ray photoelectron spectroscopy (XPS), internal reflection infrared spectroscopy and bulk property measure- ments. Films were photo-oxidized or -y-irradiated in air. Photo-oxidized film showed detectable oxidation at a very early stage in the outermost 70 A of the film thickness (as measured by XPS). Oxidation advanced into the lilms as exposure level increased. Although y-irradiated films also showed enhanced surface oxidation, this was attributed to the reaction of the polymer surfaces with short-lived species such as ozone from the radiolysis of the moist air atmosphere. When films were -y-irradiated and oxidized under conditions which precluded these reactions. oxidation proceeded uniformly throughout the film cross-section.
1 INTRODUCTION
The main mechanisms of the photoinitiated
oxidation of polyolefins are now fairly well
understood and derivatization techniques by
reactive gases have recently allowed a quantita-
tive evaluation of important oxidation products
from differing initiation modes (UV, y or
thermal).‘** Many other approaches for the
evaluation of the oxidation products can be used,
for example oxygen uptake or spectroscopic
methods. Generally, these methods do not take
into account the essential heterogeneity of
oxidation which may result from, for example,
limited oxygen diffusion into the polymer
cross-section, morphology differences or non-
uniform initiation.
Non-uniformity of oxidation has been charac-
terized to a limited extent by several analytical methods including:
(i) the infrared (.IR) analysis of a series of microtomed slices;3
(ii) the analysis of various depths using
* To whom correspondence should be addressed.
photoacoustic IR4 or internal reflection
spectroscopy (IRS)-IR with different inci-
dent angles and/or different crystal$,’
(iii) the determination of an oxidation profile
across a microtomed slice of polymer film
by micro Fourier transform infrared
spectroscopy (FTIR);7-9 (iv) microindentation.”
In addition, theoretical oxidation profiles can
also be derived from the oxygen diffusion
coefficient.”
Surface analysis by X-ray photoelectron
spectroscopy (XPS) can directly measure the
total reacted oxygen content in the first 40-130 8, of a sample. In addition, detailed examination of the carbon (Cls) electron binding energies can
differentiate several types of oxidative products
such as hydroxyl or carbonyl groups for some conditions of oxidation.‘*,13
The aim of the present paper is to compare
XPS analysis of oxidized polyethylene and
polypropylene films with analysis by IR transmis-
sion and internal reflection spectroscopies so as
to give a detailed picture of the spatial
distribution of products. The reliability of XPS as 21
22 J. Lacoste et al.
a non-destructive analysis method for oxidized
surfaces is also examined.
2 EXPERIMENTAL
Linear low density polyethylene (LLDPE) (100
pm, unoriented DuPont Canada, Sclair resin)
and isotactic polypropylene (iPP) (25 pm, un-
oriented homopolymer, Himont Profax) blown
films were acetone extracted (Soxhlet) for 48 h to remove additives and vacuum dried. Prior to use, both films had been stored at room temperature for about 15 years since extrusion.
Photo-oxidations were performed by exposure
to a xenon arc WeatherOmeter (Atlas, 2500 W)
equipped with a light monitor set at 313 nm with an interference filter. The xenon arc emission was filtered with borosilicate inner and outer filters (solarized 24 h before use) to eliminate wavelen- gths below 290 nm. Incident light varied with the
arc and filter age but usually corresponded to
about 0.25 kJ/m’ in each hour at 313 nm. This wavelength was chosen as being most important
for the photo-oxidation of polyolefins. In the
WeatherOmeter, the silver panel temperature
was controlled at 55”C, with a black panel
temperature of 75°C. No additional humidifica-
tion was used.
For comparison purposes, some films were
oxidized by exposure to y-irradiation in an
AECL GammaCell 220 at a dose rate of 0.70
Mrad/h (7.0 kGy/h). To minimize any post-
irradiation effects, all oxidized samples were
either analyzed immediately after 20 h at room
temperature in air or were stored at this point
under vacuum at -80°C until analysis was
possible, to prevent completely further oxidative changes.
Oxidation products were identified and quan-
tified by FTIR. Interference ripples in transmis-
sion spectra were eliminated optically by the
method of Harrick14 (polarized IR radiation with each film tilted at the Brewster angle).
FTIR spectra of the surfaces of photo-oxidized
films were recorded by internal reflection
spectroscopy (IRS) as described previously.’
Films were pressed firmly against either a Ge or a
KRS-5 reflection element (2 X 20 X 52.5 mm) and
then mounted into a Wilks No. 9 IRS attachment
which occupied the sample side of either a
Nicolet 7199 (liquid nitrogen cooled MCT
detector) or a Nicolet 520 G FTIR spectrometer
(TGS detector). Use of these crystals of differing refractive index (although both with 45” facets) allowed the collection of spectra corresponding to polymer surface layers of increasing thickness.
Recording meaningful surface spectra with the
Ge crystal was particularly difficult because of the need for very good contact between the film and
the crystal and because of the difficulty of
removing all absorbed water in the spectro-
meters. Water vapour is removed shortly after sample installation by the dry air purge of the
spectrometer. However, traces of absorbed water
( - 3400 and 1640 cm-‘) on the spectrometer
optics were still visible at the high scale
expansion necessary to detect the weak spectra of
oxidation products on Ge crystals. The water
absorption at 3400 cm-’ overlaps that of -OH
groups in the polymer. This problem was
minimized by purging for a controlled time (2 h) before each spectrum from the bare crystal, or the crystal with film, was recorded. For both Ge
and KRS-5 studies, spectra were recorded on
both the front (xenon lamp facing) and obverse
surface of photo-oxidized films.
XPS spectra were acquired on a Perkin Elmer Physical Electronic’s Model 5500 and on a Kratos Axis HS system. For both cases, photoelectrons were collected normal to the sample surfaces and
‘angle resolved’ measurements were not made.
Typical analytical conditions were as follows. The
size of the analyzed area was about 1 mm2
(Kratos) or 2 X 5 mm (Perkin Elmer). Monoch-
romatized Al Ka radiation was used for
excitation and a 180” hemispherical analyzer with
a three channel detector was employed. The
spectrophotometer was operated in fixed analy-
zer transmission (FAT) mode throughout the
study using electrostatic magnification. Survey
spectra were collected using 160 eV pass energy while 20 eV was used for high resolution. The pressure in the analyzer chamber was 10mx to 10 -‘) torr. An electron flood gun was used to minimize sample charge during a measurement.
However, because of small shifts caused by
residual charging, binding energies were re-
ferenced to the carbon-carbon bond which was
assigned a binding energy of 285 eV. Atomic
compositions were estimated by standard pro-
grams provided with the instruments using the
sensitivity factors supplied by the manufacturers. The surface oxygen content of each oxidized film was the average of a minimum of three analyses on different film areas.
Surface and bulk analy ses
On some samples, total hydroperoxides
(ROOH) were estimated by iodometry as
reported elsewhere.1,2 This method is extremely
sensitive to trace levels of oxidation because of
the very high extinction coefficient of the I,-
product (25 000 (mole/l)-’ cm-’ at 355 nm).
3 RESULTS
3.1 zyxwvutsrqponmlkjihgfedcbaZYXWVUTSRQPONMLKJIHGFEDCBAPhoto-oxidation of polypropylene
Film samples were photo-oxidized for increasing
times in the WeatherOmeter and then analyzed
by XPS, iodometry, transmission IR and IRS-IR (on both Ge and KRS-5 crystals). Fresh film
samples were used for each photo-oxidation time
and for each analytical method.
3.1.1 X- ray photoelectron spectroscopy
Although X-ray excitation generates core electr- ons from atoms located at depths in a sample, only the electrons close to the surface escape the
sample and are detected by the XPS spectro-
meter. For a detector normal to a flat polymer
surface, detected electrons are collected
of the oxidation of poly olefins 23
from a layer having a thickness of about 70 A.13 All elements can be detected except for hydrogen
and helium and have well established binding
energies.12*13 XPS survey spectra of a series of increasingly oxidized iPP films are shown in Fig. 1. In all cases the Cls peak at 285 eV is
normalized to constant height. Compositions of
the 70 8, surface layers can be data by the use of established coefficients.
derived from this atomic sensitivity With XPS it is often possible to resolve spectra
into peaks attributable to specific atomic
linkages. From the ‘high resolution’ XPS
spectrum of the Cls electrons from the most
highly photo-oxidized film shown in Fig. 2, peaks
at +1.6 eV (-C-O-), +2*8 eV (C = 0) and +4*0
eV ( - C( = 0)-O-) can be detected relative to
the dominant combined C-C and C-H peak (at 285 eV). Peaks were assigned from XPS spectra of polymer samples containing specific functional groups. In theory such spectra should allow the
identification and quantification of many of the
groups on the oxidized polymer. In reality this is difficult because of the inherent low resolution of
XPS, peak widths and deconvolution limitations,
and sample sensitivity to X-rays (see below) and zyxwvutsrqponmlkjihgfedcbaZYXWVUTSRQPONMLKJIHGFEDCBA
loo0 900 800 700 600 500 400 30
Binding energy (eV)
Fig. 1. Evolution of oxygen content by XPS (Perkin Elmer XPS) during the photo-oxidation of iPP. Sensitivity factor O/C = 2.4. Cls peak height is normalized to a constant count value (100%). Spectra from survey scans are off-set for clarity.
24 J. Lacoste et al. zyxwvutsrqponmlkjihgfedcbaZYXWVUTSRQPONMLKJIHGFEDCBA
6000 -
Binding energy/eV zyxwvutsrqponmlkjihgfedcbaZYXWVUTSRQPONMLKJIHGFEDCBA
Fig. 2. Maximum resolution XPS spectrum of photo- oxidized iPP (23.8 kJ/m2 exposure). High energy deconvol- uted peaks are absent prior to irradiation (Perkin Elmer
XPS).
at best is only semi-quantitative for the complex
mixtures of oxidation products identified from
oxidized polyolefins.‘2 Deconvolution at low
oxidation levels is at best highly speculative.
Consequently in this study we have simply used
XPS to quantify the total percentage of oxygen
averaged over the surface ( - 70 A) layer.
Concentrations are expressed as oxygen atom to
carbon atom percentages.
One of the dominant oxidation products from
polyolefins, the hydroperoxide group (-OOH), is
expected to be readily destroyed by radiation
(y-rays, fast electrons, X-rays) by analogy with
the behaviour of alcohols.” This raises the
possibility of problems in the quantification of
8- 6- 4-
l
-ewe\ 2- *\., 5-n
=-L.-:.-.._._ I I I I 0 4 8 12 16X-ray exposure time (min)
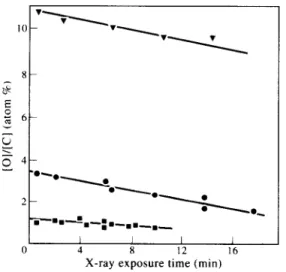
Fig. 3. Oxygen content changes during X-ray exposure by XPS of photo-oxidized iPP films. (Perkin Elmer XPS): n ,
1.3 kJ/m2; 0, 10.3 kJ/m2; ‘I, 29.5 kJ/m’.
the overall surface oxidation because of rapid
-0OH destruction during the duration of an
XPS analysis. This was confirmed by a study of the oxygen atom percentage as a function of XPS
counting time (Fig. 3). The oxygen atom
percentage drops progressively under the X-ray
exposure, levelling off at -60% of the initial
level for extreme exposures (not shown), possibly
corresponding to complete conversion of -0OH
to -OH and carbonyl products. Quoted oxygen
atom percentages were derived by back ex-
trapolation to zero X-ray exposure time (Fig. 3).
Loss of. -OH species at 3400 cm-’ (pre-
dominantly -0OH in oxidized polypropylene)
and formation of carbonyl species (at -1720
cm-‘) during X-ray exposure was clearly
indicated by transmission IR on a photo-oxidized sample after XPS analysis. Care was taken to
examine the film area that had been X-ray
exposed ( - 2 x 5 mm in the Perkin Elmer XPS)
by IR. Destruction of samples during XPS
analysis has been extensively studied.” However,
reported rates of X-ray induced degradation are
very much less than reported here. For example a ‘degradation index’ (atomic percentage loss after 500 min exposure) of 25% is normally considered to be quite high, as found for the [Cl]/[C] of PVC
(Scienta, ESCA300).” I n contrast to Fig. 2, the
‘degradation index’ for [O]/[C] is -250%
calculated in the same way (extrapolated to 500
min) and -80% for the PVC [Cl]/[C] ratio (for the purpose of cross comparison) under our XPS
analysis conditions (Perkin Elmer XPS). (This
‘index’ must be instrument dependent and the
overall result of a complex series of parallel and sequential reactions in an oxidized surface.)
Oxygen atom percentage values from XPS for
a series of increasingly photo-oxidized samples
are shown in Table 1. Some measurements on the
obverse surface (facing away from the xenon arc) of films showed a very similar surface oxidation to the front (Table 1).
3.1.2 zyxwvutsrqponmlkjihgfedcbaZYXWVUTSRQPONMLKJIHGFEDCBABulk oxidation products
Transmission IR and iodometry both detect
oxidation products throughout the total film
cross-section. Values for these techniques are
also shown in Table 1. Iodometry quantifies
hydroperoxide and any peracid or perester. From
previous studies, hydroperoxide is by far the
dominant species.‘*2 Dominant IR absorptions in
Surface zyxwvutsrqponmlkjihgfedcbaZYXWVUTSRQPONMLKJIHGFEDCBAand bulk analy ses of the oxidation of polyolefins 25 zyxwvutsrqponmlkjihgfedcbaZYXWVUTSRQPONMLKJIHGFEDCBA
Table 1. Polypropylene photo-oxidation yields from the various analytical methods”
Incident Oxidation product concentration (mmol/kg) [WC] (at.%)
flUX
(kJ/m’ at [-OOH] -OH >c=o -OH >c=o OH >c=G Bulk -2.0 pm -0.25 pm IO A
313 mm) from oxidationb surface’ surfaced surface’
iodometry From transmission IR From IRS-IR From IRS-IR on
KRS-5145” Gel45 0 0 0.5 0.6 0 0.5 1.3 0.14 00M4 1.2 1.9 066 0~0019 ND 2.2 0.63 13 0 0.0018 0.04 ND 5.1 5.5 54 24 0.015 0.18 1.9 7.8 14.9 12 6.7 63 27 135 0 0.051 0.22 0.38 2.2 10.3 108 89 35 111 40 270 0.35 0.37 0.75 3.5’ 2.68 17.6. 246 220 127 240 157 660 235 0.87 0.9 1.26 5.9 23.8 450 580 507 ND ND 2120 1350 2.0 ND 4.9 8.s’ 8.69 u Blanks indicate undetectable; ND, not determined. b -0OH from iodometry plus total ketones from transmission IR. ’ From -0OH and ketones from IRS-IR on KRSJ. d From -0OH and ketones from IRS-IR on Ge. ’ From XPS. f Front film surface (facing UV).
R Obverse surface.
(- 3400 cm-‘) and ketones (1718-1724 cm-‘).
Many other carbonyl species can be detected, but at levels appreciably below the total ketone level.
Extinction coefficients have been listed
previously.2
3.1.3 IRS- IR
Oxidation products in surface layers can be
quantified by IRS-IR of oxidized films. The
crystals employed have very different refractive
indices which leads to quite different depths of
penetration of the evanescent wave at the
reflection interface.16 Penetration is also depen-
dent on beam polarization and IR wavelength.
Circular polarization of the spectrometer IR
beam has been assumed and average effective
depths are calculated to be 0.18 pm (at 3400
cm-‘) and 0.36 pm (at 1700 cm-l) for Ge at 45”
incidence on polypropylene and 1.3 pm (at 3400
cm-‘) and 2.5 pm (at 1700 cm-‘) for KRS-5 at
45” incidence against polypropylene (refractive
index assumed to be l.5).16 Because of problems with perfection of optical contact between a film
and a crystal (especially for Ge), surface
concentrations of oxidation products were calcu-
lated for -OH and ketonic species by the use of
polypropylene absorptions of known absorption
coefficient measured for each sample to calculate
effective beam penetration. For the -OH
absorption (3400 cm-‘), the 2730 cm-’ absorption
of the polymer was used whereas for ketones
(- 1720 cm-‘), the 1260 cm-’ absorption was
used. Actual spectra of oxidized polyolefins have been shown previously1*2 and are not reproduced
here, However, surface concentrations from
IRS-IR are shown in Table 1.
For comparison with the low resolution XPS
data, all PP photo-oxidation data have been
converted into total oxygen atom to carbon atom
percentages (Table 1). For the IRS-IR data, the
-OH species have been assumed to be all
hydroperoxide. This is consistent with the
reasonable agreement between the iodometric
-0OH level and the -OH concentration from
transmission IR (Table 1).
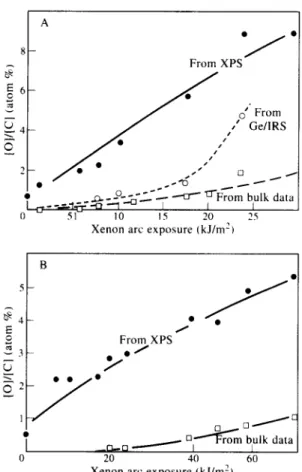
The oxygen to carbon atomic percentage ratio is plotted as a function of UV flux exposure for
polypropylene in Fig. 4(A). Obviously only
concentrations of residual (non-volatile) oxida-
tion products have been estimated. Appreciable
volatilization of low molecular weight scission
products is reported from photo-oxidized
polypropylene.”
3.2 Photo-oxidation of LLDPE
In a more limited study, films of UV-exposed LLDPE were examined by XPS (70 8, surface
oxidation), iodometry (bulk -0OH) and trans-
26 J. Lacoste et al.
Xenon arc exposure (kJ/m’)
I
BI
From XPS
0 20 40 60
Xenon arc exposure zyxwvutsrqponmlkjihgfedcbaZYXWVUTSRQPONMLKJIHGFEDCBA(kJ/ m ’) zyxwvutsrqponmlkjihgfedcbaZYXWVUTSRQPONMLKJIHGFEDCBA
Fig. 4. Oxygen product accumulation in photo-oxidized
polyolefin films: (A) iPP film and (B) LLDPE film.
acid). For ease of comparison, collected data are
expressed again in terms of oxygen atom to
carbon atom percentage ratio in Table 2 and
plotted in Fig. 4(B).
Table 2. Oxygen product yields from LLDPE pboto-
oxidation Incident flux (kJ/m2 at [O]/[C] (at.%) 313 nm) Bulk oxidation 70 A surface”
-0OH” c=o total( %)’
0 0 0.5 7.5 0 2.3 11.4 0.020 0.05 0.07 2.2 17.6 0.032 0.11 0.14 2.3 20.1 0.027 0.18 0.21 2.8 23.8 0.029 0.14 0.17 3.0 39.0 0.084 0.45 0.53 4.1 45.9 0.10 0.68 0.78 4.0 52.6 0.12 0.71 0.83 4.9 63.0 0.14 1.0 1.1 5.4
“From XPS. ‘From iodometry. ‘From transmission IR. ’ -0OH plus ketone and carboxylic acid.
3.3 y-Initiated oxidation
Initiation of oxidation by y-irradiation can be
expected to be uniform across a film cross-
section. In fact for relatively thin films ( 5 120
pm) the bulk oxidation rate of polyethylene and
polypropylene is independent of thickness and
linear in absorbed dose ( - 50 mmol/kg -0OH
per Mrad for polypropylene and 2.2 mmol/kg
-0OH per Mrad for LLDPE) at -0.7 Mrad/h
dose rate.’ At higher dose rates or greater thicknesses, oxygen diffusion limitation will lead to lower oxidation levels in the core as compared
to the surface. Based on this information, a
y-oxidization of thin films would seem to be a
good test vehicle for checking the validity of the
techniques for examining surface/bulk oxidation
effects. However, surprisingly rapid preferential oxidation of iPP and PE films was found by XPS (Fig. 5) in conflict with the expected uniform oxidation. Munro” has reported a similar effect
for y-irradiated LDPE. An additional surprise
was the similarity in the surface oxidation level as seen by XPS for iPP and PE. As already mentioned, for identical rates of initiation, iPP is well known to undergo free radical oxidation at a rate appreciably faster than PE.’ This is clearly
visible from the transmission IR data shown in
Fig. 5.
The enhanced surface oxidation for y-
irradiated polyolefins may result from the well
known production of ozone (0,) and other
short-lived oxygen species in the GammaCell.‘”
0, and other products such as . OH, ‘02, HO, . ,
etc., are produced as a normal consequence of
irradiation of oxygen in air and the familiar
odour related to 0, is always detectable in and
‘t l -
.- zyxwvutsrqponmlkjihgfedcbaZYXWVUTSRQPONMLKJIHGFEDCBA
0 2 4 6 8
y-irradiation dose (Mrad)
Fig. 5. Oxidation product accumulation in y-irradiated
polyolefin films. Surface oxidation from XPS: 0, iPP: A, LLDPE. Bulk oxidation from transmission IR: 0. iPP: &
Surface and bulk analy ses of the oxidation of poly olefins 27
around the equipment. To eliminate these effects, iPP film was placed in borosilicate glass tubes and
y-irradiated at -196°C under vacuum in the
GammaCell. This irradiation generated a frozen
population of carbon centred radicals. The
sample was removed from the GammaCell and
then allowed to react with 0, at -78°C (in dry
ice) to convert these radicals quantitatively to
peroxyl radicals in the complete absence of 0,.19 After 16 h at -78”C, the samples were warmed
to room temperature and then analyzed by XPS
and transmission IR after 20 h. In these samples surface and bulk oxidation levels agreed quite well (O-5 at.% [O]/[C] by XPS and O-3 at.% by iodometry and transmission FTIR). This reaction sequence effectively decouples radical formation
from oxidation and allows for a purely free
radical oxidation without interference from 0,
and any other y-generated gaseous species. 0, is much more reactive than 0, and is reported to
attack unsaturated polymers very rapidly and
saturated polyolefins quite slowly with low
selectivity.20
There is a remote possibility of short-lived
species such as 0, being formed in the xenon arc
WeatherOmeter and causing the observed
surface photo-oxidation effects (Fig. 3). However
a control experiment in which an iPP film was
mounted inside the operating equipment for 48 h, but shielded from the light, showed only a small
change in surface oxidation (-0.3 at.%) in
comparison to samples directly irradiated (3.5
at.% [O]/[C] for 10 kJ/m2 direct exposure for 48 h).
4 DISCUSSION
Polypropylene and polyethylene give quite
different proportions of oxidation products
during photo-oxidation (see Tables 1 and 2). For
the former, hydroperoxide groups clearly domin-
ate over carbonyl species, whereas in poly-
ethylene, carboxylic acid and ketone groups
predominate over hydroperoxide groups.‘q2
Despite this difference, from Tables 1 and 2 and Fig. 4, it is clear that overall oxidation occurs
very rapidly in the surfaces of both
polypropylene and polyethylene films during UV
exposure. Analysis of the obverse surface of
several polypropylene films (i.e. the surface away
form the direct light exposure) showed that this surface also oxidized rapidly (Table 1).
From a comparison of the oxygen atom
percentage values corresponding to the (some-
what approximate) depths sensed by the
analytical methods, it is possible to build up a
series of ‘snapshots’ of the growth of the
oxidation into the polypropylene film. This is
shown in histogram form in Fig. 6.
In the early stages of photo-oxidation, a simple
calculation shows that all of the oxidation is
confined to the back and front -70 A layers. For
example, at l-3 kJ/m* exposure, 1.21 at.%
[O]/[C] in each 70 8, layer represents an
averaged oxidation percentage over the whole
(25 pm) film cross-section of 2 zyxwvutsrqponmlkjihgfedcbaZYXWVUTSRQPONMLKJIHGFEDCBAX 1.21 X 70 X
10p4/25, i.e. -6 X 10p4%. This is slightly greater
than the average level measured by iodometry
(4 X 10p4%). For the higher levels of photo-
oxidation shown in Fig. 4, surface layer oxidation does not account for all of the internal oxidation.
Successive zone concentrations into the interior
have been corrected for the oxidation level in the more highly oxidized outer layers.
Preferential surface oxidation of photo-
oxidized polypropylene has been previously
reported for polypropylene (by IRS-IR).”
5 ORIGIN OF SURFACE OXIDATION
Detection of photo-oxidation products in the
surface by XPS could be attributable to the rapid migration of low molecular weight products to
the surface or morphology-controlled effects.
6’ From GelIRS rom KRS-S/IRS -.-.-.- _---:
cy
/
zyxwvutsrqponmlkjihgfedcbaZYXWVUTSRQPONMLKJIHGFEDCBA 0 I 2 ’ 1.3 kJ/m2 Film depth (pm)Fig. 6. Approximate oxidation cross-sections through
28 zyxwvutsrqponmlkjihgfedcbaZYXWVUTSRQPONMLKJIHGFEDCBAJ. Lacoste
However, the absence of preferential surface
oxidation in the y-irradiated films (in the absence
of 0, effects) largely eliminates these pos-
sibilities. We have previously attributed surface
photo-oxidation to the dominance of UV-
absorbing chromophores in this outer layer and
show that 0, exposure can generate these
chromophores.’ The surface layer chromophores
could result from oxidation caused by air cooling of the film during fabrication and/or attack by
species in the atmosphere such as Oj, during
shelf storage. Prior to oxidation, a small but finite level of oxidation was detectable in the extracted
and vacuum dried films (Tables 1 and 2)
consistent with these suggestions.
Munro has reported surface oxidation levels
for both UV and y-exposed LDPE by XPS but
without a clear measurement of bulk changes.”
His y-exposure was at a very low rate (O-08
Mrad/h) where diffusion control of oxidation is extremely unlikely. It is possible that this surface
effect from the y-irradiation is also due to
reaction with, for example, 0,. His reported
levels of surface oxidation under UV exposure are about three times greater than in the present
study (Fig. 4), but the difference may be
attributed to his use of a rather shorter
wavelength (254 nm) UV.
Our conclusion that y-initiated oxidation
normally leads to strong surface layer oxidation
could have interesting consequences for poly-
olefin stabilization against -y-initiated oxidation.
As well as an additive package that can scavenge
free radicals in the post-irradiation period,
antiozonants could also play a role in overall
stability.
et al.
Irrespective of the origin of the rapid surface
photo-oxidation, XPS offers a highly sensitive
way to detect the onset of oxidative degradation.
REFERENCES 1. 2. 3 _ . 4. 5. 6. 7. 8. 9. 10. 11. 12. 13. 14. 15. 16. 17. 18. 19. 20.
Lacoste, J. & Carlsson, D. J., J. Polym. Sci. A, 30 (1992) 493.
Lacoste, J., Vaillant, D. & Carlsson, D. J., J. Polym. Sci. A, 31 (1993) 715.
Fourneaux, G. C., Ledbury, K. J. & Davis, A., Polym. Deg. Stab., 3 (1981) 431.
Delprat, P. & Gardette, J.-L., Poly mer, 34 (1993) 933. Carlsson, D. J. & Wiles, D., M acromolecules, 4 (1971)
174, 179.
Lucas, P. C. & Porter, R. S., Polym. Deg. Stab., 22 (1988) 175.
Jouan, X. & Gardette, J.-L., Polym. Comm., 28 (1987) 239.
Adam, C., Lacoste, J. & Lemaire, J., Polym. Deg. Stab., 24 (1989) 185; 25 (1989) 247.
Jouan, X., Adam, C., Fromageot, D., Gardette, J.-L. & Lemaire, J., Polym. Deg. Stab., 25 (1987) 239.
Clough, R. L. & Gillen, K. T., Amer. Chem. Sot. Symp. Ser., 280 (1985) 411.
Cunliffe, A. V. & Davis, A., Polym. Deg. Stab., 4 (1982) 17.
Munro, H. S., Polym. Deg. Stab., 12 (1985) 249. Beamson, G. & Briggs, D., High Resolution XPS of
O rganic Poly mers. J. Wiley, NY, 1992.
Harrick, N. J., Appl. Spectroscopy , 31 (1977) 548. Whelan, D. J., Chem. Rev., 69 (1969) 179.
Harrick, N. J., & du PrC, F. K., Appl. Opt., 5 (1966) 1739.
Gijsman, P., Hennekens, J. & Vincent, J., Polym. Deg. Stab., 42 (1993) 95.
Willis, C., Boyd, A. W., Young, M. J. & Armstrong, D. A., Can. J. Chem., 48 (1970) 1505.
Carlsson, D. J., Dobbin, C. J. B. & Wiles, D. M., M acromolecules, 18 (1985) 2092.
Razumovskii, S. D. & Zaikov, G. E., Deu. Polym. Stab., 6 (1983) 239.


![[PDF] Cours apprentissage du langage JAVA méthodes et application - Cours Java](data:image/gif;base64,R0lGODlhAQABAIAAAP///wAAACH5BAEAAAAALAAAAAABAAEAAAICRAEAOw==)