Publisher’s version / Version de l'éditeur:
ASTM Special Technical Publication, 1039, pp. 157-167, 1989
READ THESE TERMS AND CONDITIONS CAREFULLY BEFORE USING THIS WEBSITE. https://nrc-publications.canada.ca/eng/copyright
Vous avez des questions? Nous pouvons vous aider. Pour communiquer directement avec un auteur, consultez la première page de la revue dans laquelle son article a été publié afin de trouver ses coordonnées. Si vous n’arrivez pas à les repérer, communiquez avec nous à [email protected].
Questions? Contact the NRC Publications Archive team at
[email protected]. If you wish to email the authors directly, please see the first page of the publication for their contact information.
NRC Publications Archive
Archives des publications du CNRC
This publication could be one of several versions: author’s original, accepted manuscript or the publisher’s version. / La version de cette publication peut être l’une des suivantes : la version prépublication de l’auteur, la version acceptée du manuscrit ou la version de l’éditeur.
Access and use of this website and the material on it are subject to the Terms and Conditions set forth at
Testing water vapor transmission : unresolved issues
Bomberg, M. T.
https://publications-cnrc.canada.ca/fra/droits
L’accès à ce site Web et l’utilisation de son contenu sont assujettis aux conditions présentées dans le site LISEZ CES CONDITIONS ATTENTIVEMENT AVANT D’UTILISER CE SITE WEB.
NRC Publications Record / Notice d'Archives des publications de CNRC:
https://nrc-publications.canada.ca/eng/view/object/?id=970e7ba7-9b5a-42be-9b6b-1b018379532e https://publications-cnrc.canada.ca/fra/voir/objet/?id=970e7ba7-9b5a-42be-9b6b-1b018379532eS a r
TH1
N 2 1 d
National Research Conseil nationallo.
1 6 1 5
'1
Council Canada de ncherches Canadac.
2BZDG
Research in Institute for lnstitut de recherche en- - - Construction construction
Testing Water Vapor
Tmnsmission: Unresolved
Issues
by M. Bomberg
Reprinted from
Water Vapor Transmission Through Building Materials and Systems: Mechanisms and Measurement ASTM, STP, 1039,1989
p. 157-167
(IRC Paper No. 1615)
NRCC 30891
i
I
~ \ ~ L I o T H ~ Q U E
Ce dmment passe en revue les questions clh dont on a discug Im du symposium de
I'ASW
sur
les mdcartisrnes etPes mesures de
la transmissionde
vapeur d'eauB
tmvm lesrnatkrianx et systkmes. I1 &sene Ies questions qui n'ont pas 6t6 dwlues dans les m e s a s
en laboratob
-
- futures rn6thodesAuthorized Reprint from Standard Technical Publication 1039
Copyright American Society for Testing and Materials 191 6 Race Street, Philadelphia, PA 191 03 1989
Mark
Bomberg'
Testing Water Vapor Transmission:
Unresolved Issues
REFERENCE: Bomberg, M., "Testing Water Vapor Transmission: Unresolved Issues," Water Vapor Transmission Through Building Materials and Systems: Mechanisms and Measurement, ASTM STP 1039, H . R. Trechsel and M. Bomberg, Eds., American Society for Testing and Materials, Philadelphia, 1989, pp. 157-167.
ABSTRACT: This paper reviews key issues addressed during the ASTM Symposium on Mechanisms and Measurements of Water Vapor Transmission through Materials and Systems. It presents unresolved issues in the laboratory measurements and postulates actions to be considered in the future development of ASTM test methods.
KEY WORDS: water vapor transmission, testing, laboratory testing
One of the most controversial topics in building science is that of moisture in walls and roofs. Johnson asked during a Building Thermal Envelope Coordinating Council (BTECC) ; symposium [I] "Do we have a moisture problem?" The question was repeated in the first i session of the ASTM Symposium on Mechanisms and Measurements of Water Vapor Trans-
mission Through Materials and Systems, and a few cases of possible moisture damage were discussed. These problems involved surface condensation in either hot and humid o r cold climates as well as moisture enclosed during construction in walls with limited drying po- tential.
Current understanding of moisture in walls was put in perspective by Gavin 121, who stated: "Although wall moisture problems are not widespread, some that d o occur are of sufficient gravity t o generate concern, especially if the problem's cause cannot readily be determined. Moreover, measures being used t o improve building energy efficiency, both in new construction and in retrofitting of existing structures, may increase the potential for moisture condensation in walls to become a problem."
Since the 1940s the condensation of vapor has been associated with vapor diffusion. More recently, this perception has begun t o change. In his 1978 paper, reprinted as the introduction to this publication, Hutcheon states: "It was then possible to relate many known cases of I corrosion, water damage, freeze-thaw breakdown of masonry, and icicle formation at the tops of tall buildings t o condensation resulting from moisture carried by outward air leakage that was brought into contact with cold outer parts of the building enclosure under winter L. conditions,"
Much has been learned about the mechanisms of moisture transfer in the past two decades. Twenty years ago, we were concerned with one material characteristic only. Today moisture in the building envelope is analyzed in the context of the system; moisture accumulation is seen a s a result of heat, water vapor, rain water, and air movements influenced not only
'
Senior researcher, Institute for Research in Construction, National Research Council of Canada, Ottawa, Ontario, Canada KIA 0R6.158 WATER VAPOR TRANSMISSION
by material properties but also by interaction of materials and components forming the envelope system.
This improvement in understanding of the mechanisms of heat and moisture transfer has already made a significant impact on designers and builders. Yet it does not appear to have reached the manufacturers of building materials. Except for modernization of equipment, not much has changed in laboratory water vapor transmission (WVT) measurements since the early 1950s. There is, however, increased confusion about the scope and significance of WVT test methods, made worse by the number of modifications applied to the tests by different testing laboratories.
In reviewing laboratory WVT measurements, one must first define the objectives of WVT testing and then examine to what extent each method satisfies the objectives. Presentations and discussions during the ASTM Symposium on Mechanisms and Measurements of WVT through Materials and Systems and the existing technical literature permit such a review of laboratory W W measurements. The present review comprises specific recommendations for the ASTM Subcommittees C16.31 and C16.33.
Factors Affecting WVT Rate
As part of a Scandinavian program of research on moisture in buildings [ 3 ] , the Danish Building Research Institute studied moisture transfer through wall sections. Each wall section (1 by 1 m), was placed between warm and cold chambers that maintained constant tem- perature and humidity. The objective, described by Kjaer and Christensen [ 4 ] , was to investigate the correlation between the results of dry and wet cup measurements performed on small specimens under isothermal conditions
[S],
and results for larger specimens tested under temperature gradients.A cold chamber, 2.5 by 2.5 by 2.8 m, was temperature controlled to approximately *l°C; humidity fluctuated slightly around 90% relative humidity (RH) level. Three conditions of temperature, -20, - 10, and WC, were applied. The warm chamber, built as an insulated, double steel box with inside dimensions of 1 by 1 by 1 m, had a constant temperature of 25
+ 0.5"C. To maintain constant air humidity, four plastic trays of salt solutions were
placed on a balance. The relative humidity of the air was measured with a lithium chloride (LiCI) sensor and recorded, as were surface temperatures.Tables l a and l b show W W measurements on 15- and 30-mm-thick layers of expanded polystyrene. It may be seen that the WVT coefficient changes with the applied temperature difference. It is approximately 50% higher with a temperature difference of 45°C than with one of 25°C. In addition to differences between various specimens, the change in specimen thickness from 15 to 30 mm (Tables l a and lb) alters the measured WVT coefficients.
The variation of results in the Danish tests (see differences between Tests 1 and 2 in Table l b performed on different specimens) precludes the possibility of comparison with WVT
TABLE la-The W V T coefficient in g / ( m 2 . h . mm Hg) for 15-mm-thick layer of expanded polystyrene determined by Kjaer and Christensen (41.
Cold Side Warm Side
WVT Coefficient, "C %RH "C %RH g / ( m 2
.
h . mm Hg)- 20 90 25 48 0.16
- 10 90 25 50 0.12
BOMBERG ON UNRESOLVED ISSUES IN TESTING 159 TABLE lb-The W V T coeficient in g / ( m 2
.
h.
mm . H g ) for 30-mm-thick layer of expandedpolystyrene determined by Kjaer and Christensen [4] (two separate tests).
Cold Side Warm Side
WVT Coefficient,
"C %RH "C %RH g/(m2
.
h.
mm Hg)coefficient determined by cup methods. The estimated WVT coefficients for polystyrene in the Norwegian tests were 0.23 and 0.08 gl(m2
.
h.
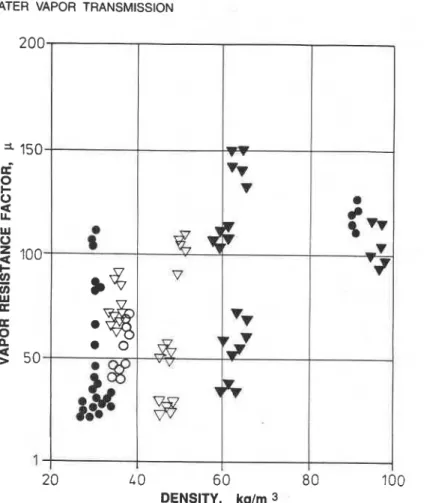
mm Hg), respectively, for 15- and 30-mm polystyrene layers. (The Norwegian tests were, however, performed at 25OC to mea- sure WVT as a function of relative humidity [5].)Much has been learned in the intervening years. The significance of material variability is much better appreciated. For example, Zehendner [6] has demonstrated how resistance to water vapor flow through a material depends on the manufacturing mode (Fig. 1). The diffusion resistance coefficient in Fig. 1 relates the resistance of water vapor flow through the material to flow through a still air layer of the same thickness. For material with the same density, two to three-fold differences are apparent for each m ~ d e of polyurethane foam production. For boards cut from production blocks, this difference may even be as much as five or six-fold. One must recognize, moreover, that thermally driven vapor flow may contribute substantially to moisture transfer, (see Kumaran, in this volume).
Notwithstanding these limitations, the Scandinavian research [3-51 highlighted a number of factors affecting WVT rate:
1. mean temperature of the specimen (to be discussed by Schwartz et al. in this volume), 2. mean relative humidity (to be discussed later in this paper), and
3. temperature and humidity gradients associated with different thicknesses of test spec- imens.
If the WVT coefficient depends on so many factors, one must be careful not to compare WVT results obtained under different test conditions. One should therefore distinguish between tests aiming at:
1. comparing materials,
2. examining the effects of boundary conditions on the WVT, and 3. examining moisture accumulation during vapor diffusion.
To compare materials, one may use isothermal and easy-to-maintain testing conditions; for example, those specified by the ASTM Test Methods for Water Vapor Transmission of Materials (E 96-80) dry-cup procedure. To examine the effect of boundary conditions on the WVT rate, one must consider whether the test conditions correspond to the service conditions. Bringing the test conditions closer to the service conditions may, however, affect the property being measured, that is, WVT coefficient. The result of the test may be affected
160
WATER VAPOR TRANSMISSION 200 A 150d
e
02
WY
,oo
s
v,
cn
W K K2
2
50 1 20 L 0 60 80 100 DENSITY, kglm 3FIG. 1-Diffusion resistance coefficient (ratio of the resistance of material to that of still air layer with the same thickness) in relatron to density and manufacturing technology of poly~trethane foams: open circles = boards, filled circles = boards cut from blocks, open triangles = poured foams, and filled triangles = spray foams. Source: Zehender [6], reprinted with permission.
not only by the physical process of water vapor transmission but also by the test procedure. In effect, one measures an apparent property. This was apparent in Tables l a and l b . Such is the case for non-isothermal methods, which should be discussed separately. Non-iso- thermal testing has been shown by Schwartz et al. to be necessary in examining moisture accumulation during vapor diffusion; non-isothermal testing will be discussed later in the paper.
isothermal WVT Test to Compare Materials
The aim of this test method is to compare materials with the highest practicable precision. One cannot assume that the W W coefficient determined in the test relates to actual field conditions, nor that when applied in a calculation this WVT coefficient will generate the actual flow rate for conditions different from those employed in the test.
Despite these limitations, this WVT test is useful. It may be used in research and devel- opment work to compare materials, calibrate dynamic and comparative WVT test equipment (as discussed by Pike in this volume), train laboratory personnel, and in studying small
BOMBERG ON UNRESOLVED ISSUES IN TESTING 161
changes in material performance, for example, the effect of aging in some membranes. T h e ASTM dry-cup test method is an example of such a test. Actually, ASTM E 96-80 lists two test methods: dry and wet cup. The wet-cup method is, however, much less reliable than the dry-cup method, particularly for hygroscopic materials. The wet-cup method is sensitive to changes in relative humidity and surface resistance on the high relative humidity side, see Joy and Wilson [7]. Moreover, when used for hygroscopic materials, ~t often gives an apparent W W coefficient that includes a substantial contribution from flow in the adsorbed or condensed liquid phase, see Babbit [8,9].
The uncertainty of the dry-cup (desiccant) method is discussed by Toas, Hoffee, Hansen, and Bertelsen in this volume. The sources of uncertainty are as follows: (1) sealing edges, (2) relative humidity oscillations, (3) air flow, (4) insufficient surface area, (5) barometric pressure. (6) stabilization of vapor flux, and (7) calculation techn~que.
Sealing Edges-One of the most important sources of uncertainty in the dry-cup method is to ensure that the specimen is properly sealed to the dish. It is generally accepted that the following sealants are superior to any gasket seal: a monomeric sealant, a mixture of micro-crystalline wax with a refined crystalline paraffin wax (60 and 40%), a mixture of micro-crystalline wax with a plasticizer (90 and 10%). a mixture of waxes with melting points between 60 and 75°C (oil content, 1.5 t o 3%).
Techniques to seal thick specimens with a wax mixture are discussed by both Toas and Hoffee in this volume. A technique t o seal edges of thin membranes is described in the Appendix.
RH Oscillations-Uncertainties arising from temperature and humidity oscillations or insufficient sensitivity of the weighing balance were also discussed by Toas and Hoffee.
Air Flow-Another source of uncertainty, the velocity of air at the material surface, is often misunderstood. Originally, a high air velocity was required, for example, more than 2.5 m / s (TAPPI (1949) standard, see Chang [lo]). Later, with the development of better chamber controls, moderate air velocities were recommended, for example, D I N 52615 requires less than 0.5 m l s [ I l l . T o maintain uniform boundary conditions, however, air velocity must be higher than 0.05 m / s , see Joy and Wilson [7].
Insufficient Surface Area-An issue not discussed during this symposium was the significant difference in minimum surface area required by ASTM E 96-80 and some European lab- oratories [11,12], in which specimens with surface areas two or three times larger than those required by ASTM are used. The significance of a large surface area was observed in a comparative test series performed by a Canadian laboratory using the mylar film previpusly tested by Institute for Research in ConstructionINationaI Research Council of Canada (IRCI NRCC). Good agreement with NRCC measurements was observed when this laboratory used large cups (-80 cm2), but agreement was poor when cups of 10 cm2 surface area were used for WVT determination (by the same personnel).
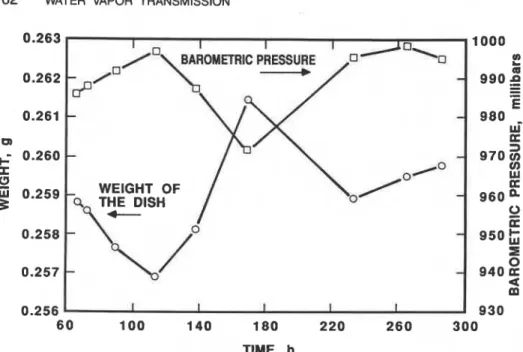
Barometric Pressure-The effect of barometric pressure variations on the precision of W V T measurements has been discussed in a short presentation to the symposium by Wilkins and Pullan [13]. They observed that although the 1970 version of ASTM E 96-66 warned of buoyancy effects caused by changes in barometric pressure for specimens with a low WVT coefficient, there is n o such mention in the current ASTM standard. Wilkins and Pullan showed how important this effect may be. Figure 2 shows weight changes recorded
162 WATER VAPOR TRANSMISSION
WEIGHT OF
-
I 1 I I !
TIME, h
FIG. 2-The effect of barometric pressure on weight changes during W V T test. Source: Wilkins and Pullan [ I 31, reprinted with permission.
in a WVT test performed during a large change in barometric pressure, and Table 2 shows
WVT coefficients calculated using either a single-variable regression (weight changes versus time) or a multi-variable regression (weight changes, pressure changes, and time).
The results (Table 2) show that multi-variable regression not only increased the correlation coefficient but, in many cases, also gave a different result for the WVT coefficient. Wilkins and Pullan concluded that for materials with low permeance, for example, less than 0.05
perms (2.9 ng/Pa . s
.
m2), one must account for the barometric pressure when calculating the WVT coefficient.Stabilization of Vapor Flux-The effect of delay in the stabilization of flow rate is par- ticularly significant for hygroscopic materials with relatively low permeability, for example,
TABLE 2-The W V T coefficient in ngl(Pa
.
s.
m2) and correlation coefficient using single and multiple regress analysis. Results obtained by Wilkins and Pullan [I31 on low permeance materials.Multivariable Regression Single Regression Test
Code WVT Correlation WVT Correlation
A 0.30 0.93 0.08 0.10 B 0.67 0.98 0.48 0.56 E 0.72 0.96 0.53 0.59 C 0.82 0.99 0.62 0.67 F 1.28 0.99 1.09 0.84 H 2.61 1 .OO 2.42 0.96 G 3.16 1.00 2.94 0.96 D 8.67 1.00 8.56 1.00
BOMBERG ON UNRESOLVED ISSUES IN TESTING 163
concrete [12]. The uncertainty regarding whether or not steady state has been reached may be reduced by an appropriate calculation procedure or by a test that records both inflow and outflow fluxes. An example of such a procedure, called a modified cup, is discussed by Schwartz et al. in this volume. Moreover, for materials with a low WVT coefficient, ad- sorption of water vapor to the surface of the cup may also introduce errors. (Plastic cups are not recommended for testing materials with a low W W coefficient.)
Calculation Technique-Finally, as discussed by Hoffee, the uncertainty in the WVT coefficient may also be affected by the calculation technique.
ASTM Action Sheet
The following concerns should be addressed during revision of ASTM E 96-80.
1. introduce requirements for acceptable sealing compounds and specify techniques for sample preparation,
2. consider increasing minimum surface area of the specimen, 3. define a method for calculating the WVT coefficient,
4. relate requirements for the duration of the test and the barometric pressure correction to the value of the WVT coefficient,
5. define precision and bias in relation to the value of the WVT coefficient,
6. consider introducing limits on the method's application in terms of maximum and minimum WVT coefficients.
If these concerns can be resolved, it would improve the precision of the dry-cup WVT method and make it an excellent ASTM test for comparing different materials.
Isothermal WVT Test to Examine Effect of Varying Conditions
The effects of different boundary conditions on the WVT rate are important. The sig- nificance of relative humidity for the WVT coefficient of paints and coatings was shown by Yassen and Ashton [I41 and again by Batdorf in the symposium. Equally important is the effect of temperature on WVT coefficient. Schwartz et al. show that changes in WVT as a function of temperature may cause moisture accumulation in cellular plastics. It is evident that one must examine how changing boundary conditions affect the isothermal WVT rate. Ideally, one would like to measure a material characteristic as it changes with temperature and relative humidity. This material characteristic has been called "spot permeability" [7,15]. It was determined when using a narrow range of relative humidity difference across the specimen (for example, 20% difference of relative humidity). To maintain different con- ditions of relative humidity, one often uses specific salts that maintain a constant partial pressure above the surface of saturated solution. There are, however, two practical limi- tations to this approach:
1. precision of the spot permeability (test with a narrow relative humidity range) is much lower than that of the WVT coefficient determined when a broad range of relative humidity is applied across the specimen; and
2. unless a continuous recording and averaging of the relative humidity level at the surface of the specimen is undertaken, use of salt solutions may cause a large uncertainty in relative humidity level.
164 WATER VAPOR TRANSMISSION
Errors in the Narrow Relative Humidity Range Cup Testing
Hens [I21 examined the errors in cup methods in terms of uncertainties in thickness, relative humidity, temperature, and area of the specimen. Assuming that the absolute error of temperature in the chamber is about 0.2"C. the relative error of saturation partial pressure becomes about 1.2% and the relative error of the difference in relative air humidity becomes 3% (because of the uncertainty within the cup). Total errors may vary from 5% for a relative humidity difference of 90% to as much as 18% for a relative humidity difference of 20%.
To reduce the errors in cup methods, one must maintain as large a difference in relative humidity as possible; for example, the International Standards Organization (ISO) rec- ommendation [16] proposed W V T testing between the desiccant on one side and 90 t 2 %
relative humidity on the other side at two standard temperatures, 25 5 2°C and 3% +- 2°C.
Errors Caused by Uncontrolled Relative Humidify Above Salt Sol~ltions
Salt solutiorls are capable of maintaining a precise level of partial pressure in the thin layer of air above the liquid solution, but only under equilibrium conditions. In actual testing, however, temperature and air velocity variations in the chamber may cause large oscillations in the actual relative humidity level. Fournier [I61 described a study of the precision of the ISOIDIS 1663.2 method in which potassium nitrate (KNO,) salts were assumed to give nominal 88.5% relative humidity. The actual relative humidity varied between 92% (with stirring of the salt solution) and loo%, with 94 to 96% relative humidity prevailing. Table 3 shows the WVT coefficient determined with the use of salt solutions and leads to the conclusion (reached by Fournier [16]) that use of the salt solutions may only be permitted in internal quality control tests in a given laboratory. A national standard must require the use of chambers with controlled temperature and humidity. O n the other hand, the per- formance of desiccants appears to be more reproducible when their moisture content is small (see also Chang and Hutcheon [17]).
ASTM Action Sheet
If the use of salt solution is not recommended, how can one examine the effects of different boundary conditions on the WVT rate? The answer is twofold.
1. The effects of relative humidity may be examined with a transient method based on infrared detection, such as that discussed by Batdorf and Pike in this symposium. 2. The effects of temperature may be examined with a modified cup (proposed by Schwartz
et al.); this method consists of dry and wet cups placed together.
The transient method should be carefully reviewed by the ASTM Subcommittee. It may be more difficult to calibrate the newer equipment, based on infrared detection, than the TABLE 3-The W V T rate in n g l ( s . m'), ai ~ F ' c with nominal 0 to 88.5% RH as specified by I S 0 DIS 1663-2. Material tested was 16.2 k g l m ' expanded polystyrene. Five replicas tested and averaged.
Data from Fournier 116).
Test Chamber ChamberISolution Solution
BOMBERG ON UNRESOLVED ISSUES IN TESTING
165
equipment discussed by Pike. The modified cup method may require a comparative study to determine its precision. The measurement of WVT is performed at a temperature different from that in the weighing room, and this may introduce uncertainties in addition to those previously discussed.
Non-Isothermal WVT Testing
A review of test methods comprising determination of both the WVT rate and the moisture absorption under steady or varying thermal gradient conditions has been given elsewhere (181. Moreover, the results of selected test methods have been compared with moisture absorption under field conditions by Forgues [19].
Strzepek [20] provided a brief review of WVT under thermal gradients and an update on ASTM Committee C-16 activities in this area. He stated:
In the past, measurements of water vapor transmission have been made primarily under isothermal conditions (e.g., ASTM E 96 and DIN 52615). While such measurements are useful, it is important to recognize that in most applications in which water vapor transmission is of interest, temperature differences are present in addition to water vapor pressure differences. Therefore, it is quite appropriate-in fact, imperative-that standard techniques for measuring water vapor transmission through materials be developed that include thermal gradients.
The most important of the methods based on a thermal gradient appears to be one initiated in Germany for highway insulation testing and later specified in the Swiss standard SIA 279 , [21] for thermal insulation on inverted roofs. A similar procedure was used by Tobiasson , and Ricard of the Cold Region Research and Engineering Laboratory (CRREL), by Hedlin
/
(NRCC), by Knab, Jenkins, and Mathey of the National Bureau of Standards (NBS) andI TIME, DAYS
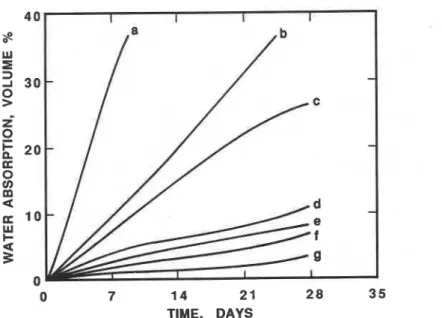
FIG. 3-Volumetric water absorption in different cellular plastics introduced by a thermal gradient. Results of modified SIA 279 test (water vapor diffusion under thermal gradient) for 50-mm-thick layer of different cellular plastics: a = open cell, b through g = closed cell plastics. Source: Strzepek [20], reprinted with permission.
166
WATER VAPOR TRANSMISSIONothers, however, with different boundry conditions in each case (see Tobiason et al. [22]). The extent of the differences in water condensation and accumulation exhibited by various cellular plastics is shown in Fig. 3 (results were obtained by Dow Chemical) using a modified SIA 279 method on 50-mm-thick specimens. Materials b through g are different closed-cell cellular plastics. One may observe that substantial amounts of moisture accumulated in some closed-cell cellular plastics when exposed to vapor diffusion under thermal gradient, although these materials had negligible intake of moisture when submersed in water under isothermal conditions.
ASTM Action Sheet
Several authors [18-221 have discussed thermal gradient methods, each however using different boundary conditions. This does not permit any comparison. A task group of ASTM Subcommittee C16.31 should review the selection of boundary conditions better related to field conditions than are used by the SIA 279 standard. This task group should also perform a ruggedness test and then proceed to develop a precision and bias statement based on a round-robin program.
References
(11 Johnson, A. W., "Do We Have a Moisture Problem," Moisture Control in Buildings, Workshop at Building Thermal Envelope Coordinating Council, Washington, DC, 25-26 Sept. 1984.
[2] Gavin, P. M., "Moisture Migration in Walls: A Summary of Current Understanding," Moisture Control in Buildings, Workshop at Building Thennal Envelope Coordinating Council, Washington, DC, 25-26 Sept. 1984.
[3] Adamson, B., Ahlgren, L., Bergstrom, S. G. and Nevander, L. E., "Moisture, Moisture Problem in Building Technology," (in Swedish), Swedish Building Research Council, Program 12, Stock- holm, 1970.
[4) Kjeer. A. and Christensen. G., "Measurement of Moisture Transfer in Building Materials," SBI Report 79, Danish National Instirute for Building Research, Copenhagen, 1971.
[5] Tveit, A.. "Measurements of Moisture Sorption and Moisture Permeability of Porous Materials,"
Report No. 45, National Building Research Institute, Oslo, 1966.
16) Zehendner. H., "Water Permeability of Cetlular Plastic Foams" (in German), Isolierung 4, LambdaVerlag. Munchcn, 1978.
(4
Joy. F. A. and Wilson, A. G., "Standardization of the Dish Method for Measuring WVT," Humidityand Moisture, Vol. 4, Reinhold Publishing Co., 1965, New York, pp. 259-270.
[8] Babbitt, J. D., "The Diffusion of Water Vapour Through Various Building Materials," Canadian
Journal o f Research, Vol. 17, A, No. 2, 1939, pp. 15-32.
[9] Babbitt, J. D., "On the Diffusion of Adsorbed Gases Through Solids," Canadian Journal o f Physics, Vol. 29, 1950, pp. 437-446.
[ l o ] Chang, S. C., "Water Vapour Permeability Tests for Building Papers," thesis, University of Saskatchewan, 1951.
[ l l ] German Standard DIN 52615, Testing of Thermal Insulation, Determination of Water Vapor Permeability of Building and Insulating Materials (in German), June 1973.
11.21 Hens, H., "Some Considerations About the Measurement of Diffusion Resistance Number "mi" of Building and Insulation Materials," Catholic University in Leuven (KUL), presentation to CIB
W-40 meeting, Washington, DC, 1976.
1131 Wilkins, W. L. and Pullan, M. R., "Effect of Barometric Pressure Changes on WVT Measure- ments," presentation to the Water Vapor Transmission Symposium from Fiberglass Canada Inc.,
I
10 Dec 1988.
[14] Yaseen, M . and Ashton, H. E., "Water Vapor Permeation Through Clear Coatings," Journal o f
Coating Technology, Vol. 50, No. 645, 1978, pp. 50-59.
[15] Chang, S. C. and Hutcheon, N. B., "Dependence of Water Vapour Permeability on Temperature and Humidity," Transacrions, American Society of Heating, Refrigeration and Air Conditioning Engineers, Vol. 62, Paper 1581, June 1956, pp. 437-450.
BOMBERG ON UNRESOLVED ISSUES IN TESTING 167
[16] Fournier, D., "Study About ISO-DIS 1663-2 Water Vapor Transmiss~on Characteristics of Cellular Plastics," Technical Report to ISOlTC 61lSC 10 meeting, April 1981, Centre de Recherches Industrielles de Rantlgny, St. Gobain, France.
1171 Chang, S. C. and Hutcheon, N. B., "Performance of Desiccants in the Dry Pan Test for Water
Vapour Permeance of Membranes," Canadian Journal of Technology, Vol. 31, 1953, pp. 175-
192.
[I81 Bomberg. M.. "Laboratory Methods for Determining Moisture Absorption of Thermal Tnsulations.
Part I: Revsew," Journol of Thermal Insularion, Vol. 6, 1983. pp. 232-249.
[I91 Forgues. A. 0.. Part 11: Comparison of Three Water Ahsorpt~on Test Methods wi~h Field Per-
formance Data," Journal of Thermal Insuloaons. Vol. 7 . 19R3, pp. 128-137.
[2Dj Strzepek, W. R.. "Non-Isothermal Water Absorption Methods." presentation to the Water Vapor
Transm~ssion Symposium from Dow Chemical USA. 10 Dec. 1988.
(211 Swiss Standard SIA 279 on Thermal Insulation, "Water Absorptron by Diffusion," Test No. 7.
1980.
[22] Tobiasson, W., Greatorex, A., and Van Pelt, D., "Wetting of Polystyrene and Urethane Roof Insulations ~n the Laboratory and on a Protected Membrane Roof," Journal o f Thermal Insulation, Vol. 11, Oct. 1987, pp. 108-1 19.
1
APPENDIX
Technique to Seal Edges of Membrane Specimens
The following example illustrates a technique for cutting out the membrane specimen and mounting it in aluminum cups provided with a ledge. The preparation procedure contains two stages: first, a cardboard ring is attached to the membrane (to reinforce it and keep it wqinkle-free while cutting and sealing the specimen to the dish); second, the specimen is sealed with a wax mixture into the ledge of the cup. The following stages are used.
Stage 1-A stiff, thin cardboard ring of the same size as the ledge of the test dish is dipped into the molten wax (heated to a temperature of 100°C). The cardboard ring is then carefully placed on the membrane. When the wax has solidified, the specimen is cut out of the membrane (with the cardboard ring attached).
Stage 2-The specimen is placed on the ledge of the aluminum cup and a template placed on it. The molten wax is poured around the template. When the wax has solidified, the template is removed and a fine-tipped soldering iron is run around the wall of the cup.
This
paper
is
being
distributedin
reprint form
by the Institute for
Research
in Consuuction,
A Iistof building practice and research
publications
availablefrom
the Institute maybe
obtainedby writing
tothe
Publications
Section.
Institutefor
Research
in
Construction,
National Research Council of Canada,
Ottawa,Ontario.
KIA
OR6.
Ce
document
estdism3u6
sous fonne
de tid-&-partpar
1'Institut de
recherche en
construction. On pevtobtenir unc Iiste
des
publications de
1'Instirut
portant
sur
les tcchniqucs
ou les recherches en matiere de
bitiment cn i5crivanr %
![TABLE lb-The W V T coeficient in g / ( m 2 . h . mm . H g ) for 30-mm-thick layer of expanded polystyrene determined by Kjaer and Christensen [4] (two separate tests)](https://thumb-eu.123doks.com/thumbv2/123doknet/14273340.490638/6.628.32.576.129.319/table-coeficient-expanded-polystyrene-determined-kjaer-christensen-separate.webp)