Immune activation and chronic inflammation
Texte intégral
Figure
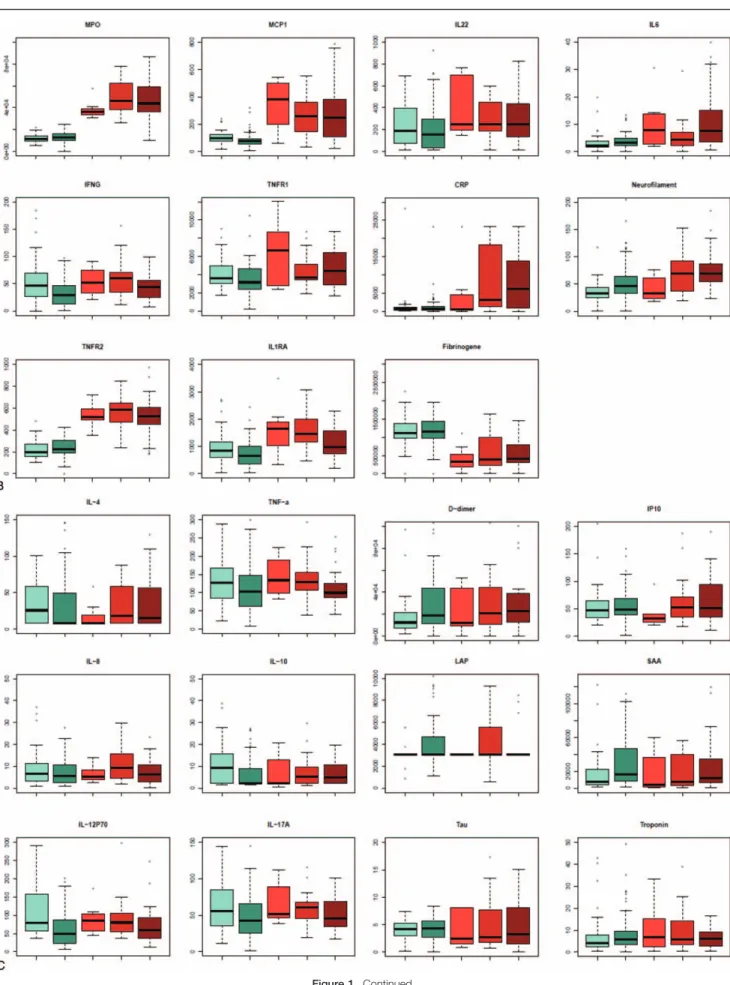
![Figure 1. (A) Plasmatic level of in fl ammatory molecules: Distribution of elevated biomarkers in the HIV-infected group (with 1 [n = 72] or without comorbidity [n = 39] compared to the control group without [n = 7], with 1 [n = 23], and with > 1 comorbi](https://thumb-eu.123doks.com/thumbv2/123doknet/14274210.490738/5.877.50.407.85.665/plasmatic-ammatory-molecules-distribution-elevated-biomarkers-infected-comorbidity.webp)
Documents relatifs
3) Représenter la fonction F simplifiée en utilisant des portes NAND à deux entrées et tracer le logigramme correspondant.. 1) Déterminer dans un tableau les différents
In period (ii), the reaction feed was continuously contacted with the sample at 380 °C, and the outlet gas flow was analyzed over time on stream.. Figure S6 shows the
(K) Large zoned crystal, included in an albite phenocryst invaded by quartz and muscovite (granite G1c, sample PAN-16-3b); a patchy core is surrounded by a zoned rim (OZ)..
The heat dissipated in the conductor of a forced cooled pipe type cable must pass through two thermal resistances in series: the conduction resistance of the cable
Key words: Laplace eigenvalue problem, a posteriori estimate, guaranteed eigenvalue bound, guaranteed eigenvector error bound, abstract framework, nonconforming finite element
Dyson’s Brownian motion, Gaussian beta ensembles, Gaussian free field, isomorphism theorems, local time, permanental fields, topological
In three examples, we measured the power Doppler signal corrected from the spatial average in a retinal and a choroidal artery (’RA’ and ’CA’), and averaged the waveform profiles
Here we describe in detail the sequential assignments of the 22 residues for which resonances are observed in 3D spectra: their chemical shifts mostly cor- responding to
