HAL Id: hal-02960399
https://hal.sorbonne-universite.fr/hal-02960399
Submitted on 7 Oct 2020
HAL is a multi-disciplinary open access
archive for the deposit and dissemination of sci-entific research documents, whether they are pub-lished or not. The documents may come from teaching and research institutions in France or abroad, or from public or private research centers.
L’archive ouverte pluridisciplinaire HAL, est destinée au dépôt et à la diffusion de documents scientifiques de niveau recherche, publiés ou non, émanant des établissements d’enseignement et de recherche français ou étrangers, des laboratoires publics ou privés.
Unraveling the Direct Decomposition of NO x over
Keggin Heteropolyacids and Their Deactivation Using a
Combination of Gas-IR/MS and In Situ DRIFT
Spectroscopy
Josefine Schnee, Laurent Delannoy, Guylène Costentin, Cyril Thomas
To cite this version:
Josefine Schnee, Laurent Delannoy, Guylène Costentin, Cyril Thomas. Unraveling the Direct De-composition of NO x over Keggin Heteropolyacids and Their Deactivation Using a Combination of Gas-IR/MS and In Situ DRIFT Spectroscopy. Journal of Physical Chemistry C, American Chemical Society, In press, �10.1021/acs.jpcc.0c05945�. �hal-02960399�
Unravelling the Direct Decomposition of NO
xover Keggin Heteropolyacids and
their Deactivation Using a Combination of Gas-IR/MS and in Situ DRIFT
Josefine Schnee,* Laurent Delannoy, Guylène Costentin,and Cyril Thomas*
Sorbonne Université, CNRS, Laboratoire de Réactivité de Surface (LRS), F-75005 Paris, France. *Corresponding authors: josefine.schnee@upmc.fr, josischnee@hotmail.com, cyril.thomas@upmc.fr.
Abstract
Keggin heteropolyacids (HPAs) have been known to be efficient NOx absorbers for many years, and to
decompose a significant fraction of the NOx species pre-absorbed at 100-150 °C into harmless N2 and
O2 upon rapid heating to 450 °C. However, this capability of Keggin HPAs to directly decompose NOx
in the absence of reducing agent in the feed has never been studied under more realistic reaction conditions, e.g. under continuous NOx feeding and in the presence of O2 in the feed. This was done for
the first time in the present work, over the widely used H3PW12O40 Keggin HPA, at 380 °C. H3PW12O40
was shown to be active in the direct decomposition of continuously fed NOx, with the decomposition
process occurring through the involvement of NOH+ adspecies. O
2 was found to play a dual role. On the
one hand, it led to the oxidation of NO into NO2 in the feed, with NO2 deactivating the HPA units. On
the other hand, it was found to initiate the diffusion of NOx into the bulk of the HPA crystals, which
significantly enhanced the durability of the activity of the HPA in the direct decomposition of these NOx, provided that the diffusion pathway in-between the bulk Keggin units was already accessible
thanks to the presence of NOx species pre-absorbed at RT. By providing the key factors involved in the
direct decomposition of continuously fed NOx over H3PW12O40, the present work paves the way for
future investigations that might focus, for instance, on tuning the chemical composition of the heteropolyanions in order to make the HPA more resistant to deactivation.
1. Introduction
Heteropolyacids (HPAs) are metal-oxygen clusters which have a discrete ionic structure consisting of mobile elementary units, namely heteropolyanions and protons. This mobility is the source of very interesting catalytic properties.1,2 HPAs exhibit unique redox properties which can be tuned by varying
their chemical composition.1,3 They also exhibit a very strong Brönsted acidity, being much stronger
than that of conventional inorganic acids, and approaching the super-acid region.1,4,5 Among a large
diversity of structures, Keggin HPAs are the most studied. Indeed, they are the most stable and the most easily available ones.2,6 The Keggin unit is composed of a heteropolyanion having the formula
[XM12O40]n- (typically, X = P or Si and M = W or Mo) and being stabilized by n acidic protons.6 The
heteropolyanion is made of a central XO4 tetrahedron, surrounded by 12 MO6 octahedra.7 It contains 3
types of oxygen atoms: central (Oa), bridging, and terminal (Od) ones. The bridging ones are either
structural water molecules. Most commonly, six structural water molecules are contained per Keggin unit, forming a body-centered cubic structure with Keggin anions at the lattice points and acidic H5O2+
bridges along the faces.2,8
Keggin HPAs are known to be highly efficient absorbers of nitrogen oxides (NOx) being among the
major pollutants of the atmosphere.9 NO
x largely contribute to current environmental issues such as
photochemical smog, acid rain, tropospheric ozone, ozone layer depletion and global warming.10,11,12 At
100-150 °C, the constitutive crystals of Keggin HPAs are reported to accommodate NO and NO2 within
their bulk, thus in-between the [XM12O40]n- heteropolyanions, as NOH+ and HNO2+ moieties.9 Upon
rapid heating (150 °C/min) to 450 °C under inert atmosphere, about 70% of the pre-absorbed NOx
species are decomposed into harmless N2 and O2.9 The term “absorption” refers here to the diffusion of
NOx into the bulk of the HPA crystals, in which NOx adsorb as NOH+ and HNO2+ species onto the
surface of the constitutive heteropolyanions. It does not refer to the diffusion of NOx into the bulk of the
Keggin units themselves. The mechanism of the NOx decomposition process is still unclear. It is
however generally accepted to involve the protons of the HPA.9
Although the capability of Keggin HPAs to directly decompose NOx in the absence of reducing agent
in the feed has been known for 25 years, it has, to our knowledge, never been studied under more realistic reaction conditions, e.g. under continuous NOx feeding and in the presence of O2 in the feed. However,
the catalytic direct NOx decomposition is nowadays considered as offering an ideal solution to the
abatement of NOx from the exhausts of automotive and various combustion processes.10,12,13 The
development of efficient formulations, classically based on noble metals, metal oxides or zeolites, is of the utmost interest to meet the ever more stringent emission regulations.10,11,12,14,15,16,17 As a reference,
over Cu-ZSM-5 being among the most active and stable catalysts reported for direct NO decomposition, NO decomposition rates of 0.134 and 8.16 µmol/gcatalyst/s have been obtained with Cu(wt%) of 0.76 and
3.88, respectively, in the absence of O2 in the feed (at 500 °C, 50 mg catalyst, and a reaction feed
consisting of NO (1%) in He (60 mL/min total flow rate), i.e. a WHSV of 0.95 g/gcatalyst/h).15Major
efforts are currently focused on improving the tolerance of the catalysts to coexisting gases (e.g. O2,
CO2, SO2).11,13
In this context, the present work aims at investigating for the first time the potential of H3PW12O40,
the most widely used Keggin HPA, in the direct decomposition of continuously fed NOx, at 380 °C,
namely the temperature above which the HPA starts to irreversibly lose its protons.18 An original
methodology is proposed here to favor the NOx decomposition process based on results recently reported
in the literature for the HPAs system. On the one hand, NO was concluded to enter only the bulk of hydrated HPAs, and provided that O2 (1-5%) was contained in the feed.19,20 On the other hand, in the
gas phase condensation of methanol into dimethylether (DME) at 150 °C,21,22 methanol was also found
to be unable to enter the bulk of anhydrous HPA crystals at the reaction temperature, unless the HPA had been previously exposed to methanol at lower temperature (RT). This was ascribed to a strong enough surface pre-adsorption at RT, followed by diffusion into the bulk upon heating to 150 °C which
finally further enabled the bulk of the HPA to become accessible also to methanol from the reaction feed at 150 °C. This low-temperature methanol pre-exposure led to a 5 times higher methanol-to-DME conversion than observed over classically activated HPA. On this basis, in the present work, the NOx
decomposition reaction will be investigated without or with pre-exposure of the hydrated HPA sample to the NO-O2 feed at RT. Through a combination of essentially gas-infrared analysis, mass spectrometry
and in situ diffuse reflectance infrared Fourier-transform spectroscopy under various reaction conditions, the present work sheds light on the activity of H3PW12O40 in the aforementioned NOx
decomposition process, the nature of its active species in that process, and the sources of its deactivation. Thereby it unprecedentedly places HPAs into the category of materials to be considered on the way towards efficient formulations for direct NOx decomposition.
2. Experimental section
2.1. Sample preparation
H3PW12O40 (hereafter HPW12) was purchased from Sigma-Aldrich in the form of H3PW12O40.xH2O
(reagent grade). The powder was placed overnight under vacuum (< 5000 Pa) at room temperature (RT) in order to evacuate as much physisorbed water as possible. As revealed by a subsequent thermogravimetric analysis, the evacuated HPA contained 6 molecules of structural water per HPW12 unit (x = 6, thermogram not shown). Before experiments, the HPW12.6H2O powder was sieved below
125 µm.
2.2. Direct NOx decomposition experiments
Direct NOx decomposition experiments were carried out in a U-shape quartz reactor (15 mm i.d.) at
atmospheric pressure. The samples (2.5 g, < 125 µm) were held on plugs of quartz wool, and the temperature was controlled by a temperature controller (Eurotherm 2408) using a K type thermocouple. The reaction feed consisted of NO (~ 2000 ppm) in Ar(13%)/He, with or without O2 (5%, if present), depending on the steps of the experiments (ppm and % referring to volume). The constitutive gases were fed from independent gas cylinders (Air Liquide), through independent mass flow controllers (Brooks 5850TR). The total flow rate was 50 mLNTP/min. The reactor inlet and outlet gas flows were analyzed
with a gas-infrared (IR) analyzer (MKS MultiGas 2030), which allowed simultaneously detecting H2O,
NO, NO2 and N2O (with 1 record every sec), as well as with a Pfeiffer Vacuum OmniStar mass
spectrometer (MS) to qualitatively monitor the formation of N2 using Ar as an internal standard (with 1
record every 6-6.5 sec), and occasionally with an Agilent CP490 micro-gas chromatograph (µ-GC) to quantify N2 (with 1 injection every 3.5 min). As the concentration of N2O remained below 0.6 ppm in
In a first experiment, the sample – hereafter referred to as “N-HPW12” sample (N standing for non-NOx-pre-saturated) – was heated from RT to 380 °C, the reaction temperature of interest in this work,
at 10 °C/min under He (50 mLNTP/min). Once H2O was no longer detected by the gas-IR analyzer, i.e.
once all of the structural water had been released (Figure S1a in the Supplementary Information), the sample was exposed to the O2-free reaction feed (~ 2000 ppm NO – 13% Ar/He) for 60 minutes. Then,
the sample was kept under static NO-Ar/He for 2 hours. Meanwhile, O2 was introduced into the
NO-Ar/He feed. 2 hours was the time needed to achieve stable IR and MS traces. Finally, the sample was exposed overnight to the O2-containing reaction feed (~ 2000 ppm NO – 5% O2 – 13% Ar/He).
In a second experiment, the sample was first pre-exposed to the O2-containing reaction feed at RT
for 4.5 days until the NOx (NO + NO2) inlet readout was equivalent to the NOx outlet readout. The
resulting “P-HPW12” sample (P standing for NOx-pre-saturated) was then heated from RT to 380 °C at
3 °C/min under Ar(8%)/He (50 mLNTP/min). The temperature ramp was slower than that used for
N-HPW12 to avoid decomposing the NOx species, that might have been retained by the sample at RT, into
N2 before reaching 380 °C.23 At 380 °C, once H2O was no longer detected by the gas-IR analyzer, i.e.
once no structural water was released anymore (Figure S1b), the sample was first exposed overnight to the O2-free reaction feed (~ 2000 ppm NO – 13% Ar/He), before being flushed under He (50 mLNTP/min)
for 10 hours, and then being exposed once again to the same O2-free reaction feed for 3 hours. Finally,
after having been kept under static NO-Ar/He for 2 hours (for the same reasons as N-HPW12 in the first experiment), the sample was exposed overnight to the O2-containing reaction feed (~ 2000 ppm NO –
5% O2 – 13% Ar/He). As explained in the introduction section, pre-exposing the hydrated HPW12
sample to the O2-containing NO feed at RT before dehydration (upon heating to 380 °C) was likely to
enable the protons located in the bulk of its crystals to participate in the direct decomposition of NOx
from the feed at 380 °C.
The exposure of the samples to the O2-containing reaction feed at 380 °C in the above described
experiments was repeated over fresh N-HPW12 and P-HPW12 samples (not having been beforehand exposed to the O2-free reaction feed at 380 °C). As the results were essentially the same as those obtained
in the above described experiments, they are not reported in the results and discussion section.
As references for these experiments, two blank experiments were also carried out, under the same reaction conditions as those aforementioned, but with only quartz wool in the reactor. The first reference experiment was performed with the O2-free reaction feed, whereas the second one was performed with
the O2(5%)-containing feed.
2.3. In situ diffuse reflectance Fourier-transform infrared (DRIFT) spectroscopy
In order to gain further insight into the behavior of N-HPW12 and P-HPW12 under the O2-free and
O2(5%)-containing reaction feeds, in situ diffuse reflectance infrared Fourier-transform (DRIFT)
spectroscopy was carried out on similarly pre-treated samples under reaction conditions very close to those described in section 2.2, using a Bruker TENSOR II spectrometer. The reaction feed consisted of
NO (~ 2000 ppm) in Ar(40%)/He (50 mLNTP/min total flow rate), with or without O2 (5%, if present), depending on the steps of the experiments. It was prepared using the gas distribution setup described in section 2.2, and then conducted through a Harrick heatable variable atmosphere cell (HVAC) equipped with two ZnSe windows and one quartz window, in which the sample holder was filled with powder of the HPW12 samples (< 125 µm). The content of Ar in the feed was higher than that used in the experiments described in section 2.2, for thermal conductivity reasons. The samples, referred to as N-HPW12 and P-N-HPW12, were both heated from RT to 380 °C at 3 °C/min under Ar(40%)/He (50 mLNTP/min). The pre-exposure of P-HPW12 to NOx at RT was carried out in the IR cell, under the O2
-containing reaction feed. At 380 °C, the first exposure to NOx was performed once the IR absorption
band at 1740 cm-1, characteristic of the structural water within HPW12,19 had disappeared from the
DRIFT spectrum (Figure S2, spectrum c vs. spectrum a of N-HPW12 at 380 °C vs. RT, and spectrum d
vs. spectrum b of P-HPW12 at 380 °C vs. RT).19 In situ DRIFT spectra of the samples were recorded
using 128 scans and a resolution of 4 cm-1. A reference spectrum was recorded with KBr (Fluka, purity
> 99.5%) under the same operating (Ar(40%)/He (50 mLNTP/min)) and temperature conditions. The
absolute spectra are reported in log 1/R with R = Isample / IKBr. The difference DRIFT spectra are reported
in log 1/R’ with the relative reflectance R’ = I
sample / I(reference sample).24 Spectra processing was done using
the Thermo Scientific OMNIC 9 software.
3. Results and Discussion
In the two blank experiments – one under the O2-free reaction feed, the other one under the O2
(5%)-containing one – the MS-recorded mass to charge (m/z) ratio 28 associated with N2 normalized by the
m/z 40 one associated with Ar, as well as the sum of the NO and NO2 concentrations recorded by the
gas-IR analyzer, remained essentially unchanged after flowing the reaction feed through the reactor at 380 °C. This indicates that there was no NOx decomposition to N2 occurring in the absence of HPW12
sample, and that there was no unwanted source of N2 formation associated with the reactor. As an
example, the N2/Ar trace and the NO+NO2 concentrations recorded in the presence of O2 in the feed are
shown in Figure S3. Due to the presence of O2 in the feed, the NO and NO2 concentrations were impacted
by the non-catalytic conversion of NO to NO2, to a larger extent after the feed had flown through the
reactor at 380 °C. This needs to be kept in mind for discussing the results obtained over the HPW12 samples in the following subsections.
3.1. Activity of non-NOx-pre-saturated H3PW12O40 (N-HPW12) in the direct decomposition of NOx 3.1.1. In the absence of O2 in the reaction feed
Figure 1 shows the NO and NO2 concentrations recorded by the gas-IR analyzer (panel a) as well as
normalized by the m/z 40 one associated with Ar (panels b and c, respectively) as a function of time on stream in the NOx decomposition experiment carried out with the N-HPW12 sample at 380 °C, in the
absence of O2 in the reaction feed. The sample was previously heated from RT to 380 °C at 10 °C/min
under He (50 mLNTP/min). The NOx decomposition experiment was launched at 380 °C once no
structural water was released from the sample anymore, as monitored with the gas-IR analyzer (Figure S1a). The reaction feed consisted of NO (~ 2000 ppm) in Ar(13%)/He (50 mLNTP/min total flow rate). In period (i) of Figure 1, the reaction feed was analyzed for 5 min (time -5 to 0 min) without being contacted with the sample (upon flowing exclusively through lines at RT). In period (ii) of Figure 1, the reaction feed was continuously contacted with the sample at 380 °C, and the outlet gas flow was analyzed over time on stream.
Figure 1. NO and NO2 concentrations recorded by the MKS MultiGas 2030 IR analyzer (a) and mass to charge (m/z) ratios 28 and 32 associated with N2 and O2, respectively, normalized by the m/z 40 one associated with Ar recorded by the MS (b-c) as a function of time on stream in the NOx decomposition experiment with N-HPW12 (2.5 g, < 125 µm, N standing for non-NOx
-pre-saturated) at 380 °C and a reaction feed consisting of NO (~ 2000 ppm) in Ar(13%)/He (50 mLNTP/min). In (i), the reaction feed was analyzed without being contacted with the sample (upon flowing exclusively through lines at RT). In (ii), the reaction feed was continuously contacted with the sample at 380 °C, and the outlet gas flow was analyzed over time on stream. N-HPW12 was previously heated from RT to 380 °C at 10 °C/min under He (50 mLNTP/min).
As measured by the gas-IR analyzer, the reaction feed contained 1921 ppm of NO and 8 ppm of NO2
(Figure 1a, period (i)). Upon starting period (ii) (time = 0 min), the concentration of NO in the outlet gas flow (Figure 1a) dropped from 1921 to 1520 ppm within the first 2 min on stream, and then immediately increased until reaching 1874 ppm at 6 min on stream. This initial peak of apparent NO consumption is attributed to the purge of the dead volume of the reactor, filled with He in period (i), upon introduction of the reaction feed. Afterwards, the recorded NO concentration evolved as a function of adsorption/reaction phenomena over the N-HPW12 sample. The concentration of NO first decreased from 1874 ppm at 6 min on stream to 1859 ppm at 13 min on stream. Then, it slowly increased until reaching 1891 ppm at the end of period (ii). The concentration of NO2 remained between 6.5 and 7.5
ppm over the whole period (ii). The fact that it was lower in period (ii) than in period (i) suggests that NO2 was partly adsorbed and/or converted on N-HPW12. The possible impact of the latter process on
the interaction of N-HPW12 with NO will be discussed in the next sections (3.1.2, and 3.2 to 3.4). The evolution of the N2/Ar trace recorded by the MS (Figure 1b) inversely follows that of the NO
concentration (Figure 1a). In period (ii), following its initial peak attributed to the evacuation of traces of air from the dead volume of the reactor, the N2/Ar trace first increased from 5 to 13 min on stream,
and then slowly decreased until the end of the experiment, reaching a final signal being however above that measured in period (i). According to a calibration based on µ-GC measurements (the error associated to which is estimated to be about 1.6%), the difference between the final N2/Ar signals in
periods (ii) and (i) corresponds to about 18 ppm of N2 produced, thus close to half the concentration of
NO (30 ppm) missing in the outlet gas flow as compared to the feed (Figure 1a, end of period (ii) vs. period (i)). These results demonstrate, to our knowledge for the first time, that direct decomposition of NO into N2 (2 NO N2 + O2) occurs over HPW12 under continuous NO feeding at 380 °C (with a rate
of 5.9 x 10⁻¹⁶ µmol/g
HPW12/s after 60 min on stream, with 2.5 g of HPW12 and a reaction feed consisting
of NO (~ 2000 ppm) in Ar(13%)/He (50 mLNTP/min), i.e. a WHSV of 3.2 x 10⁻³ g/gHPW12/h). The
evolution of this NO decomposition activity with time on stream is further discussed in section 3.4.
In period (ii) of Figure 1, the initial peak observed for the N2/Ar trace (Figure 1b), which was attributed
earlier to the evacuation of traces of air from the dead volume of the reactor, was also observed for the O2/Ar trace (Figure 1c). Afterwards, however, while the N2/Ar trace increased from 5 to 13 min on
stream, and then slowly decreased until the end of the experiment, reaching a final signal being however above that measured in period (i) (Figure 1b), the O2/Ar trace first decreased until 8 min on stream, and
then increased until the end of the experiment (rapidly from 8 to 15 min on stream, then more slowly from 15 min on stream to the end), reaching a final signal being slightly below that measured in period (i) (Figure 1c). This comparison suggests that, while N2 was produced over N-HPW12 by NO
decomposition, traces of O2 contained in the NO feed and/or O2 produced together with N2 over
N-HPW12 by NO decomposition were getting adsorbed/not getting desorbed onto/from the Keggin units. The link between the latter phenomenon and the decreasing activity of N-HPW12 in Figure 1a-b will be made in section 3.4.2. Non-catalytic NO oxidation into NO2 with traces of O2 contained in the NO feed
or O2 produced from the NO decomposition process over N-HPW12 must be negligible, as the
concentration of NO converted (30 ppm at the end of the experiment, Figure 1a) was close to that expected from the concentration of N2 produced (18 ppm at the end of the experiment, Figure 1b).
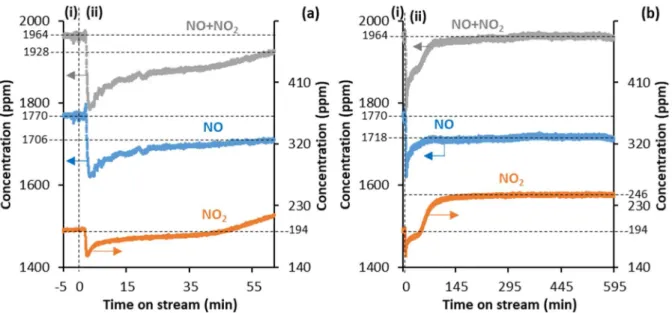
3.1.2. In the presence of O2 in the reaction feed
Figure 2 shows the NO and NO2 concentrations recorded by the gas-IR analyzer in the NOx
decomposition experiment over N-HPW12 at 380 °C in the presence of O2 in the reaction feed (with
(i), the reaction feed consisting of NO (~ 2000 ppm) in O2(5%)-Ar(13%)/He (50 mLNTP/min) was analyzed for 5 min without being contacted with the sample (upon flowing exclusively through lines at RT). It was found to contain 1770 ppm of NO and 194 ppm of NO2 (Figure 2a). Meanwhile, the sample
was kept under static NO-Ar/He (from the O2-free reaction feed used in the preceding step of the
experiment, Figure 1). In period (ii), the reaction feed was continuously contacted with the sample at 380 °C, and the outlet gas flow was analyzed over time on stream.
Figure 2. NO and NO2 concentrations recorded by the MKS MultiGas 2030 IR analyzer as a function of time on stream in the NOx decomposition experiment with N-HPW12 (2.5 g, < 125 µm, N standing for non-NOx-pre-saturated) at 380 °C and a
reaction feed consisting of NO (~ 2000 ppm) in O2(5%)-Ar(13%)/He (50 mLNTP/min). In (b), for the sake of clarity, the same data as in (a) is shown over a longer time scale. In (i), the reaction feed was analyzed without being contacted with the sample (upon flowing exclusively through lines at RT). In (ii), the reaction feed was continuously contacted with the sample at 380 °C, and the outlet gas flow was analyzed over time on stream. N-HPW12 was previously heated from RT to 380 °C at 10 °C/min under He (50 mLNTP/min).
The total NOx concentration in the outlet gas flow in period (ii) remained lower than that in the feed in
period (i) for about 300 min on stream. Given that N2/Ar trace remained essentially unchanged after
contacting the reaction feed with the sample (not shown), as also reported for the blank experiment over quartz wool (Figure S3b-c), NOx species did not decompose into N2, butwere retained by the N-HPW12
sample in these first 300 min on stream (Figure 2). The NOx species retained by the sample consisted
mostly of NO2, as indicated by the comparison of the concentrations of NO and NO2 in the first 300 min
on stream with those after 300 min on stream (Figure 2b), once the total NOx concentration had finally
reached the same level as in the feed (no NOx species were retained anymore by the N-HPW12 sample).
In the latter period, after 300 min on stream, the final NO/(NO+NO2) and NO2/(NO+NO2) concentration
ratios (1718/1964 = 0.875 and 246/1964 = 0.125, respectively, as measured in several repeat experiments) were slightly higher and lower, respectively, than the reference ratios observed over quartz wool at 380 °C (1675/1947 = 0.86 and 272/1947 = 0.14, respectively, Figure S3a), with the reference ratios being dictated by the non-catalytic oxidation of NO to NO2. This suggests that N-HPW12
the oxidation of NO, Figure 3). Indeed, at 380 °C, even if their Keggin structure is maintained,18 the
heteropolyanions may be deficient in structural oxygen atoms, and therefore may act as reducing agents towards NO2. Actually, the filling of their O vacancies along with the reduction of NO2 might explain
the inactivity of N-HPW12 in the direct decomposition of NOx in the present experiment, whereas this
sample was found to be active in this reaction in the absence of O2 in the feed (Figure 1). In collaboration
with the protons known to activate NO and NO2 to form NOH+ and HNO2+ species, respectively,9,23 the
lacunary heteropolyanions might be the reductants required to finally decompose NO into N2. A direct
filling of the O vacancies by O2 might then also contribute to the deactivation of N-HPW12, together
with a possible poisoning of the protons by NO2 to form stable HNO2+ species preventing NO from
being activated. The deactivation of N-HPW12 after exposure to the O2-containing reaction feed at 380
°C was found to be irreversible as no NOx decomposition could be recorded when removing O2 from
the reaction feed (not shown).
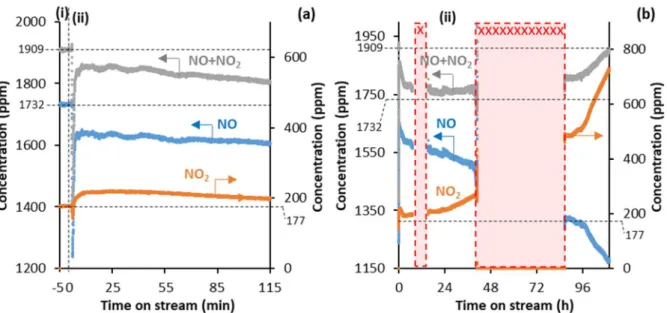
3.2. Pre-saturation of H3PW12O40 (HPW12) with NOx species to yield the P-HPW12 sample
In the second NOx decomposition experiment performed in the present work, HPW12.6H2O was first
exposed to NO (~ 2000 ppm) in O2(5%)-Ar(13%)/He (50 mLNTP/min) at RT before being heated under Ar(8%)/He (50 mLNTP/min) to the reaction temperature 380 °C (3 °C/min). The sample obtained at the
end of the pre-exposure step at RT is labelled as “P-HPW12” (P standing for NOx-pre-saturated). The
NO and NO2 concentrations recorded by the gas-IR analyzer during the NOx-pre-exposure step are
shown in Figure 3 (with panels a and b showing the same data over two different time scales, for the sake of clarity). In period (i), the NO-O2 feed was analyzed without being contacted with the sample. It
was found to contain 1732 ppm of NO and 177 ppm of NO2 (Figure 3a), due to the non-catalytic
conversion of NO to NO2 in the stainless-steel feeding lines. In period (ii), the feed was contacted with
Figure 3. NO and NO2 concentrations recorded by the MKS MultiGas 2030 IR analyzer as a function of time on stream in the pre-exposure of HPW12 (2.5 g, < 125 µm) to a 50 mLNTP/min feed of NO (~ 2000 ppm) in O2(5%)-Ar(13%)/He at RT, to yield the P-HPW12 sample. In (i), the feed was analyzed without being contacted with the sample. In (ii), the feed was contacted with the sample, and the outlet gas flow was analyzed over time on stream. (b) shows the same traces as (a), but over a longer time scale. The periods marked with crosses (xxx) correspond to night and/or weekend periods in which the cryo-detector of the IR analyzer could not be filled with liquid N2.
The sum of the NO and NO2 concentrations remained below its initial level of period (i) for 4.5 days on
stream (Figure 3b). The missing NOx (NO+NO2) concentration in the outlet gas flow was integrated
over the whole 4.5 days on stream, by roughly interpolating the NOx concentration in the periods of
missing data (i.e. night and weekend periods during which the cryo-detector of the analyzer could not be filled with liquid N2). This yielded a value of 0.0020 mol of NOx retained by the sample, that
corresponds to 81% of the total amount of protons (0.0024 mol) contained in the sample (2.5 g). Given that surface protons represent only 4% of the total number of protons of HPW12,22 the amount of NO
x
stored in the present experiment as NOH+ or HNO
2+ species19,20 (81% of the protons) demonstrates that
NOx had largely entered the bulk of the P-HPW12 crystals, which confirms the great potential of Keggin
HPAs as NOx absorber materials, as pointed out in the introduction section.9Thereby, the structural
water was progressively evacuated from the P-HPW12 crystals during the pre-exposure to NOx at RT
(Figure S4). This explains why, upon heating the P-HPW12 sample afterwards from RT to 380 °C (3 °C/min) under Ar(8%)/He (50 mLNTP/min), only 25% of the total amount of structural water
theoretically contained in HPW12.6H2O (2.5 g) was released (Figure S1b). It can therefore be concluded
that the pre-exposure of the HPW12 sample to NOx at RT had already evacuated 75% of the structural
water.
At the very end of period (ii), when the total NOx concentration in the outlet gas flow was equal to that
in the feed (1909 ppm in period (i)), indicating that NOx absorption by P-HPW12 was completed, the
concentrations of NO and NO2 were significantly lower and higher, respectively, than those in the feed
(1174 vs. 1732 ppm and 736 vs. 177 ppm, respectively). This is attributed to the catalytic oxidation of NO into NO2 at the surface of P-HPW12.19 The total amounts of NO and NO2 retained by the sample
can be assumed to be similar, as upon heating the P-HPW12 sample afterwards from RT to 380 °C (3 °C/min) under Ar(8%)/He (50 mLNTP/min), nearly the same amounts of NO and NO2 were released (7.42
x 10-5 mol of NO vs. 7.61 x 10⁻⁵ mol of NO
2, Figure S5a). Notice that the total amount of NOx released
(1.503 x 10⁻⁴ mol) upon heating the P-HPW12 sample from RT to 380 °C corresponds to only 7.5% of
the 0.0020 mol of NOx initially retained at RT. Some N2 was also detected upon heating the P-HPW12
sample from RT to 380 °C (Figure S5b), but as the temperature ramp used was as slow as 3 °C/min, according to earlier literature reports, the corresponding N2 amount remained limited to about 5% of the
pre-absorbed NOx species.9,23 Once the temperature was stabilized at 380 °C, no N2 was formed
anymore, showing that the pre-absorbed NOx species were unable to decompose at a constant
temperature of 380 °C under inert atmosphere. Overall, it can be concluded that the sample still contained the majority of its pre-absorbed NOx species at the start of the experiment performed with
continuously fed NOx at 380 °C.
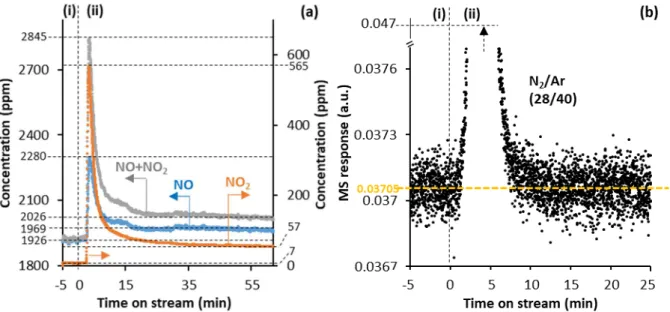
3.3. Activity of NOx-pre-saturated H3PW12O40 (P-HPW12) in the direct decomposition of NOx
3.3.1. In the absence of O2 in the reaction feed – Elucidating the deactivating impact of NO2 on the activity of HPW12
Figure 4a shows the NO and NO2 concentrations recorded by the gas-IR analyzer as a function of
time on stream in the NOx decomposition experiment over the P-HPW12 sample at 380 °C, in the
absence of O2 in the reaction feed. In period (i), the reaction feed – NO (~ 2000 ppm) in Ar(13%)/He –
was analyzed for 5 min without being contacted with the sample (upon flowing exclusively through lines at RT). It was found to contain 1919 ppm of NO and 7 ppm of NO2. Meanwhile, the sample was
kept under static Ar/He, the atmosphere under which the sample was previously heated from RT to 380 °C. In period (ii), the reaction feed was continuously contacted with the sample at 380 °C, and the outlet gas flow was analyzed over time on stream. Figure S6 shows the same concentrations over a longer time scale (600 min).
Figure 4. NO and NO2 concentrations recorded by the MKS MultiGas 2030 IR analyzer (a) and mass to charge (m/z) ratio 28 associated with N2 normalized by the m/z 40 one associated with Ar recorded by the MS (b) vs. time on stream in the NOx
decomposition experiment with P-HPW12 (2.5 g, < 125 µm, P standing for NOx-pre-saturated) at 380 °C and a reaction feed
consisting of NO (~ 2000 ppm) in Ar(13%)/He (50 mLNTP/min). In (i), the reaction feed was analyzed without being contacted with the sample (upon flowing exclusively through lines at RT). In (ii), the reaction feed was continuously contacted with the sample at 380 °C, and the outlet gas flow was analyzed over time on stream. The N2/Ar peak at around 5 min on stream has no analytical interest here. It is attributed to the release of air trapped in the valve that served for contacting the reaction feed with the sample. Its upper intensity was cut from the graph, as indicated by the rising arrow. The P-HPW12 sample was previously heated from RT to 380 °C at 3 °C/min under Ar(8%)/He (50 mLNTP/min).
Within the first 3 min of period (ii), the concentrations of NO and NO2 in the outlet gas flow rose up
quickly to 2280 and 565 ppm, respectively, whereas they were found to drop in the equivalent experiment over N-HPW12 (Figure 1). This indicates that, during the preceding period (i), the static Ar/He atmosphere had been progressively enriched in NO and NO2 being released from the sample,
until it was evacuated along with the introduction of the reaction feed. Then, following this initial NOx
peak in period (ii), both the NO and NO2 concentrations decreased until reaching, at about 35 min on
stream, stable levels of 1969 and 57 ppm, respectively. These concentrations were both 50 ppm higher than those in the feed recorded in period (i), indicating that the sample was continuously releasing 50 ppm of both NO and NO2, namely 4.4 times less NO and NO2 than released under Ar(8%)/He right
before switching to period (i) (Figure S5a, 219 ppm of both NO and NO2 released at 184 min on stream).
Thus, under reaction conditions, the NO feed essentially prevented the sample from releasing its pre-absorbed NOx species. However, unlike in the experiment carried out over N-HPW12 in the absence of
O2 in the feed (Figure 1), NO from the feed was not decomposed to N2, as the N2/Ar MS trace remained
essentially unchanged from period (i) to period (ii) (Figure 4b). The absence of NOx decomposition
activity of P-HPW12, whereas N-HPW12 was active under the same O2-free conditions, can only be
attributed to the presence and/or the release of NO2 in the/out of the bulk of its crystals, which is the
only significant difference between the experiments carried out on these two samples in the absence of O2 in the feed. As in the experiment performed over N-HPW12 in the presence of O2 in the feed, NO2
role as NO reductants, or might have poisoned the protons to form unreactive HNO2+ species, eventually
preventing NO from being activated.
Following this first NOx decomposition experiment over P-HPW12 at 380 °C in the absence of O2 in the
feed (Figure 4), the sample was purged under He (50 mLNTP/min) at 380 °C for 10 hours, before being
exposed a second time to the same O2-free reaction feed for 3 hours (Figure S7). During this second
exposure to the O2-free reaction feed, the concentrations of NO and NO2 continuously released from the
sample were lower than in the first reaction step (Figure S7 vs. Figure 4). From about 50 min on stream, once the concentrations had stabilized, only 20 ppm of both NO and NO2 were released (whereas 50
ppm were released in the first experiment, Figure 4). This shows that the amount of NOx species released
in the feed in the course of the experiment depends on the amount of NOx species stored in the sample,
the latter amount being lower after the purge step during which a part of the pre-absorbed NOx species
was released (not shown). As in the first experiment, the NOx (fed and pre-absorbed) were not found to
decompose into N2 (not shown).
3.3.2. In the presence of O2 in the reaction feed – Elucidating the positive impact of O2 on the activity of HPW12
The P-HPW12 sample already used in the two latter experiments (section 3.3.1) was finally submitted to a NOx decomposition experiment at 380 °C in the presence of O2 in the reaction feed. The
NO and NO2 concentrations recorded by the gas-IR analyzer as a function of time on stream are shown
in Figure 5a-b (with panels a and b showing the same data over two different time scales, for the sake of clarity), whereas the N2/Ar trace recorded by the MS is shown in Figure 5c. In period (i), the reaction
feed consisting of NO (~ 2000 ppm) in O2(5%)-Ar(13%)/He (50 mLNTP/min) was analyzed for 5 min without being contacted with the sample (upon flowing exclusively through lines at RT). It was found to contain 1736 ppm of NO and 181 ppm of NO2. Meanwhile, the sample was kept under static
NO-Ar/He (from the O2-free reaction feed used in the preceding step of the experiment, Figure 4). In period
(ii), the reaction feed was continuously contacted with the sample at 380 °C, and the outlet gas flow was analyzed over time on stream.
In period (ii) of Figure 5a-b, the total NOx concentration in the outlet gas flow first decreased, and then
immediately increased to slightly above its level in the feed. Then, it decreased again up to about 20 min on stream, before remaining below its level in the feed until the end of the experiment. Thus, unlike in the absence of O2 in the feed (Figure 4a), NOx from the feed were retained by the P-HPW12 sample in
the presence of O2 in the feed. The fact that the NO, NO2 and total NOx concentrations remained
essentially constant from about 20 to 100 min on stream (Figure 5a-b) indicates that NOx were retained
not only at the surface but also in the bulk of P-HPW12. Indeed, in the pre-saturation of P-HPW12 with NOx at RT, the NOx concentration was also constant for a significant period of time (Figure 3b), and this
was demonstrated in section 3.2 to arise from bulk absorption, probably due to diffusion limitations in-between the constitutive HPW12 units.22 In the present experiment, during the last 200 min on stream
(Figure 5b), the total NOx concentration was relatively close to that in the feed (only 14 ppm lower,
whereas it was 71 ppm lower at 100 min on stream), which means that the sample was still retaining only a limited amount of NOx from the feed. By comparing the individual NO and NO2 concentrations
in that final period with those in the period from 20 to 100 min on stream (1670 vs. 1643 ppm of NO, and 233 vs. 207 ppm of NO2), it can be concluded that, in the period from 20 to 100 min on stream, both
NO and NO2 were absorbed by the sample in similar proportions (27 ppm of NO absorbed per unit of
time vs. 26 ppm of NO2).
Figure 5. NO and NO2 concentrations recorded by the MKS MultiGas 2030 IR analyzer (a-b) and mass to charge (m/z) ratio 28 associated with N2 normalized by the m/z 40 one associated with Ar recorded by the MS (c) as a function of time on stream in the NOx decomposition experiment with the P-HPW12 sample (2.5 g, < 125 µm, P standing for NOx-pre-saturated) at 380 °C and a reaction feed consisting of NO (~ 2000 ppm) in O2(5%)-Ar(13%)/He (50 mLNTP/min). In (b), for the sake of clarity, the same data as in (a) is shown over a longer time scale. In (i), the reaction feed was analyzed without being contacted with the sample (upon flowing exclusively through lines at RT). In (ii), the reaction feed was continuously contacted with the sample at 380 °C, and the outlet gas flow was analyzed over time on stream. The N2/Ar peak at around 5 min on stream has no analytical interest here. It is attributed to the release of air trapped in the valve that served for contacting the reaction feed with the sample. Its upper intensity was cut from the graph, as indicated by the rising arrow. This experiment with P-HPW12 was the third one over the same sample. The two first ones were carried out in the absence of O2 in the feed (Figure 4 and Figure S7, respectively). The P-HPW12 sample was previously heated from RT to 380 °C at 3 °C/min under Ar(8%)/He (50 mLNTP/min).
The fact that the presence of O2 in the feed induced a diffusion of NO2 into the bulk of P-HPW12 is
attributed to the relatively high concentration of NO2 in the feed under these conditions (181 ppm in
Figure 5a-b vs. 7 ppm in Figure 4a, periods (i)). The fact that, at the same time, it also enabled the diffusion of NO into the bulk may be assigned to two possible origins. Firstly, NO might have been brought up into the bulk of HPW12 concomitantly with NO2 via the formation of N2O3.25 Secondly, O2
might have reacted with NO at the surface of the crystals to form intermediate NOxy- adspecies being
easily protonated by the protons located in the near-surface bulk of HPW12 (thereby regenerating O2)
and consequently leading to the absorption of NO into the bulk of HPW12.19 Overall, the presence of
O2 in the feed appears to be required for NO to form a species that is able to diffuse into the bulk of
HPW12.
The diffusion of NOx into the bulk of P-HPW12 led to the decomposition of NOx from the feed and/or
of NOx pre-absorbed in the bulk into N2. Indeed, in period (ii) of Figure 5c, following its initial peak
centered at around 5 min on stream, attributed to the evacuation of traces of air trapped in the 4-way valve used for contacting the reaction feed with the sample, the N2/Ar trace stabilized at a higher level
than that measured in period (i). As shown in Figure S8, the production of N2 remained stable for about
200 min on stream, before decreasing to the level measured in period (i) within the next 300 min. According to µ-GC measurements (the error associated to which is estimated to be about 1.6%), about 5 ppm of N2 were produced per unit of time in the first 200 min on stream, which corresponds to 10 ppm
of NOx decomposed per unit of time. From 200 to 500 min on stream, while the N2/Ar signal was
decreasing (Figure S8), the NO, NO2, and total NOx concentrations were increasing (Figure 5b). This
shows that the deactivation of P-HPW12 was directly related to the decreasing capacity of its bulk to further incorporate NOx species. To explain this finding, two non-exclusive hypotheses may be
proposed. Firstly, once the NOx from the feed were no longer able to react over the deactivated bulk
HPW12 units, they accumulated inside the bulk until saturating it. In this hypothesis, the HPW12 units may have been deactivated following the two non-exclusive mechanisms proposed earlier in the present work: 1) the O vacancies in the heteropolyanions getting filled by O2 and/or NO2, and/or 2) the protons
associated with the heteropolyanions getting poisoned by NO2 as HNO2+ species. Secondly, once the
NOx species pre-absorbed in the bulk had all been consumed by the decomposition reaction with NOx
from the feed, the bulk was essentially emptied, and therefore no longer accessible.21
3.4. Comparison of the NOx decomposition activities of N-HPW12 and P-HPW12
Table 1 qualitatively summarizes the activities observed over the N-HPW12 and P-HPW12 samples in the direct decomposition of continuously fed NOx at 380 °C in the absence and in the presence of O2
in the reaction feed. In section 3.4.1, the role of pre-absorbed NOx species in the activity of P-HPW12
in the decomposition of NOx from the O2-containing reaction feed is discussed (by comparing the
3.4.2, the activity of N-HPW12 in the absence of O2 in the reaction feed (Figure 1) is compared to that
of P-HPW12 in the presence of O2 in the reaction feed (Figures 5 and S8) in terms of NO conversion
and stability over time on stream.
Table 1. Qualitative summary of the activities observed over the N-HPW12 and P-HPW12 samples (2.5 g, < 125 µm) in the direct decomposition of continuously fed NOx at 380 °C in the absence and presence of O2 (5%) in the reaction feed (Figures
1-2, 4-5 and S6 to S8). The reaction feed contained NO (~ 2000 ppm) in Ar(13%)/He (50 mLNTP/min total flow rate). The N-HPW12 and P-N-HPW12 samples were previously heated from RT to 380 °C at 10 °C/min under He and at 3°C/min under Ar(8%)/He, respectively (50 mLNTP/min). Unlike the N-HPW12 sample, the P-HPW12 sample was pre-saturated with NOx at
RT (N and P standing for non-NOx-pre-saturated and NOx-pre-saturated, respectively). “Min” are min of reaction, not including
the 5 min in which the reaction feed was analyzed without being contacted with the sample, namely period (i) in Figures 1-2, 4-5 and S6 to S8.
3.4.1. The positive impact of the pre-saturation of HPW12 with NOx species on its NOx decomposition activity in the presence of O2 in the reaction feed, and the balance between positive and deactivating impacts of O2
The second hypothesis proposed at the end of section 3.3.2 to account for the observed deactivation of P-HPW12, namely that a NOx-emptied HPW12 bulk is no longer accessible to NOx from the feed,
arises from the fact that NOx were essentially unable to enter the bulk of the N-HPW12 sample at 380
°C despite the presence of O2 in the feed. This assumption is supported by the absence of plateau in the
NO and NO2 concentration traces when the total NOx concentration was significantly below that in the
feed (when NOx were retained by the sample), i.e. in the first 100 min on stream (Figure 2). Within this
period, NOx were essentially adsorbed onto the surface of N-HPW12, with a higher rate than that
observed in the case of P-HPW12 (Figure 2 vs. Figure 5), as the surface of the latter had been already partly covered with NOx species during the pre-saturation step at RT (Figure 2 vs. Figure 5). Thus, the
presence of pre-absorbed NOx appears to be necessary for NO and NO2 to enter the bulk of HPW12
crystals at 380 °C, unlike at RT (Figure 3). This suggests that, rather than depending on the temperature as a source of energy to overcome the activation barrier of bulk absorption, the ability of NOx to enter
the bulk depends on the temperature as a modulator of the balance between the strength of adsorption at the surface of the crystals and the activation energy required to enter the bulk. At 380 °C, the adsorption of NOx at the surface of N-HPW12 must be weaker than at RT, whereas the activation energy to enter
its bulk is likely higher, due to the absence of structural water which requires the NOx to open the way
in-between the bulk HPW12 units. This makes the diffusion of NOx into the bulk more difficult, unless
Reaction feed
Concentration of NOxdecomposed into N2
Over N-HPW12 Over P-HPW12
O2-free
- Essentially decreasing in the 60 min considered
- At 60 min, 30 ppm
0
O2(5%)-containing 0
Stable at 10 ppm for 200 min before decreasing to 0
the presence of pre-absorbed NOx species has already made the diffusion pathway in-between the bulk
HPW12 units accessible, as in the case of P-HPW12.
In summary, the different NOx decomposition activities observed for the N-HPW12 and P-HPW12
samples at 380 °C in the presence of O2 in the feed (Figures 2 and 5, respectively) resulted from a
balance between the negative impact of O2 and/or NO2 deactivating the heteropolyanions and/or their
associated protons, and the positive impact of O2 and/or NO2 initiating the diffusion of NO into the bulk
of the HPW12 crystals. The latter positive impact took place to a noticeable extent only in the case of P-HPW12 (Figure 5), thanks to NOx species pre-absorbed in the bulk of HPW12 having made the
diffusion pathway in-between the HPW12 units accessible to the NOx from the reaction feed. This
explains that P-HPW12 exhibited a NOx decomposition activity in the presence of O2 in the reaction
feed, whereas N-HPW12 was found to be inactive in this reaction under the same conditions.
3.4.2. Comparison of the NOx decomposition activity of N-HPW12 in the absence of O2 in the reaction feed to that of P-HPW12 in the presence of O2 in the reaction feed
The balance between the negative and positive impacts of O2 and/or NO2 described in section 3.4.1
was, however, still not sufficiently favorable for P-HPW12 to reach a NOx decomposition activity in the
presence of O2 in the reaction feed (Figure 5) as high as that recorded on N-HPW12 in the absence of
O2 in the reaction feed (Figure 1). At 60 min of reaction, 10 ppm of NOx were decomposed over
P-HPW12 in the presence of O2 in the feed (Figures 5c and S8), whereas 30 ppm of NOx were decomposed
over N-HPW12 in the absence of O2 (Figure 1). Nevertheless, P-HPW12 exhibited a stable NOx
decomposition activity for as long as 200 min, thanks to the increased fraction of accessible HPW12 units whose deactivation was likely limited by NOx diffusion inside the bulk,22 whereas N-HPW12
showed a continuously decreasing activity in the considered 60 min of reaction. Indeed, even in the absence of O2 intentionally added into the feed, the latter still contained a few ppm of deactivating NO2
and traces of O2, as well as O2 that was produced along with the decomposition of NO over N-HPW12,
which might have also led to the progressive filling of the O vacancies in the HPW12 units and thus to the deactivation of the sample. Such a progressive filling of the O vacancies might explain the progressive increase of the O2/Ar signal from 8 min on stream in Figure 1c (the Keggin units exhibiting
less and less O vacancies to be filled as the decomposition reaction proceeded).
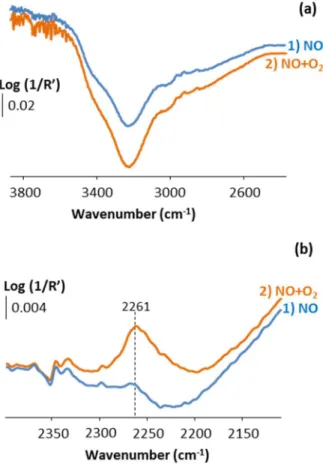
3.5. Identifying the active sites of HPW12 in the direct decomposition of NOx, and possible origins of their deactivation
Figure 6 shows the in situ DRIFT difference spectra at steady state of N-HPW12 at 380 °C under a 50 mLNTP/min feed of NO (~ 2000 ppm) in Ar(40%)/He which first contained no O2 (spectrum 1, NO)
and subsequently contained 5% of O2 (spectrum 2, NO+O2). For the sake of clarity, panels a and b show
of the last spectrum recorded at 380 °C under Ar(40%)/He before NO was added into the feed. N-HPW12 was previously heated from RT to 380 °C at 3 °C/min under Ar(40%)/He (50 mLNTP/min).
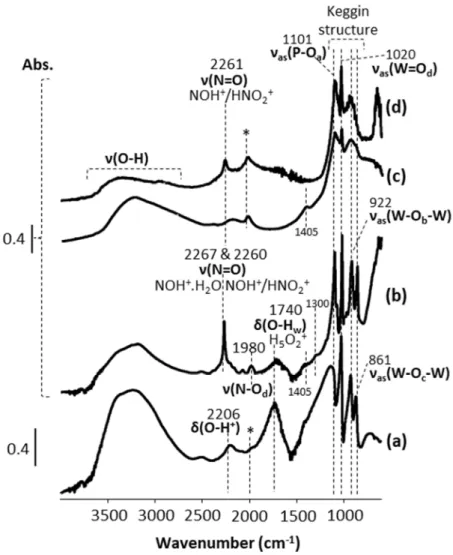
Both difference spectra show a positive band at 2261 cm-1, and a broad negative band centered at 3230
cm-1. In the presence of O
2 in the feed (spectrum 2 in Figure 6), the area of these two bands is 4.8 and
1.3 times higher, respectively, than in the absence of O2 in the feed (spectrum 1 in Figure 6). In earlier
studies about the absorption of NO and/or NO2 into the bulk of HPW12 at temperatures around 150 °C,
the band at 2261 cm-1 was assigned to ν(N=O) stretches within both NOH+ and HNO
2+ species.19,20 The
negative band at 3230 cm-1 was neither shown nor commented in earlier literature studies. It is attributed
here to the consumption of HPA protons upon NOH+ and/or HNO
2+ formation. The higher areas of the
bands at 2261 and 3230 cm-1 in the presence of O
2 in the feed can be attributed to two non-exclusive
origins. Firstly, it may result from the 26 times higher concentration of NO2 in the O2-containing feed
(181 ppm vs. 7 ppm in Figures 5a-b and 4a, respectively), which led to an increase of the concentration of HNO2+ adspecies, that may have reached the near-surface bulk of the HPW12 crystals to a little
extent.25 Secondly, it may result from the formation of NOH+ species in the near-surface bulk of HPW12,
thanks to either NO2 as a carrier or O2 having reacted with NO at the surface to form intermediate NOx
Figure 6. In situ DRIFT difference spectra of N-HPW12 (N standing for non-NOx-pre-saturated) at 380 °C under a feed of NO
(~ 2000 ppm) in Ar(40%)/He (50 mLNTP/min) 1) since 12 h and 2) 8 h after adding O2 (5%) into the feed, in the spectral regions of (a) structural O-H+ stretches and (b) N=O stretches within NOH+ and HNO2+ species. N-HPW12 was heated from RT to 380 °C at 3 °C/min under Ar(40%)/He (50 mLNTP/min). Both difference spectra were obtained by subtraction of the last spectrum recorded at 380 °C under Ar(40%)/He before NO was added into the feed. Log (1/R’) is expressed in arbitrary units, with the relative reflectance R’ = Isample / I(reference sample).
A similar study was performed on a HPW12 sample which was beforehand saturated with NO/NO2
at RT to provide a P-HPW12 sample, and then heated from RT to 380 °C at 3 °C/min under Ar(40%)/He (50 mLNTP/min). At 380 °C, the P-HPW12 sample was exposed to an O2-free feed of NO (~ 2000 ppm) in Ar(40%)/He (50 mLNTP/min) (in situ DRIFT difference spectra shown in Figure S9, panel 1). The
P-HPW12 sample was then purged under Ar(40%)/He (50 mLNTP/min) before exposure to a feed of NO
(~ 2000 ppm) in O2(5%)-Ar(40%)/He (50 mLNTP/min). Figure 7 shows the in situ DRIFT difference spectra of P-HPW12 at 380 °C as a function of time of exposure to the O2-containing NO feed, in the
spectral region of N=O stretches within NOH+ and HNO
2+ species. During the exposures to the two NO
feeds at 380 °C, the difference spectra were obtained by subtraction of the last spectrum recorded at 380 °C under Ar(40%)/He before the respective NO feed was contacted with the P-HPW12 sample. The difference spectra (d-spectra hereafter) recorded within the first 10 min under the O2-free NO feed
(Figure S9, panel 1) do not show the appearance of any IR absorption contribution. The d-spectrum recorded after 30 min on stream shows the appearance of a slight negative band at 2261 cm-1, which was
found to remain essentially unchanged at longer exposures to the O2-free NO feed (d-spectra at 60 and
80 min in Figure S9, panel 1). In contrast, on the d-spectra recorded under the O2-containing NO feed
this band then continuously decreased until the end of the experiment (d-spectra from 4 to 900 min, Figure 7). From 2 to 34 min on stream, it remained higher than that on the last d-spectrum recorded under the O2-free NO feed (Figure S9, panel 2 vs. panel 1). At longer exposures to the O2-containing
NO feed (d-spectra from 60 min in Figure 7), the area of the band at 2261 cm-1 became lower than that
on the last d-spectrum recorded under the O2-free NO feed (Figure S9, panel 1), without however
reaching zero on the final spectrum at 900 min on stream.
The negative band at 2261 cm-1 indicates the disappearance of NOH+ and/or HNO
2+ species which had
been stored in the bulk of the sample during its pre-exposure to NOx at RT, due to their desorption and/or
reaction under the NO-O2 containing feed. The limited disappearance of pre-absorbed NOH+ and/or
HNO2+ species under the O2-free NO feed (Figure S9, panel 1) can be attributed to the slight desorption
of such species in agreement with the release of NOx species recorded in Figure 4a and the absence of
N2 formation (Figure 4b). In contrast, the sharp disappearance of pre-absorbed NOH+ and/or HNO2+
species under the O2-containing feed (Figure 7) is rather attributed to their reaction as supported by the
presence of N2 in the effluent of the corresponding NO decomposition experiment described in section
3.2 (Figure 5c). The latter experiment showed that the presence of O2 in the reaction feed allowed NOx
from the latter feed to enter into the bulk of the sample, which led to NOx decomposition into N2. The
present DRIFT results show that this decomposition process relied on both the NOx from the feed and
the NOx species pre-absorbed in the bulk. The NOx from the feed reacted over the HPW12 units with
the involvement of pre-absorbed NOH+ species (NO
gas + NOH+ = N2 + O2 + H+, or NOgas + H+ = NOH+
followed by NOH+ + NOH+ = N
2 + O2 + 2 H+). The involvement of pre-absorbed HNO2+ species seems
unlikely in view of the deactivating impact of NO2 demonstrated in section 3.3.2. Hence, the present
data suggest that NOH+ species are important intermediates in the direct decomposition of NO
x over
HPW12 at 380 °C, which thus relies on the protons of HPW12.
The fact that the band at 2261 cm-1 became less and less negative with increasing time on stream under
the O2-containing NO feed (Figure 7) indicates that unreactive NOH+ and/or HNO2+ species were
formed/adsorbed on the HPW12 units along with the reaction of pre-absorbed NOH+ species with NO
x
from the feed. This accumulation of unreactive NOH+ and/or HNO
2+ species may have occurred
according to two non-exclusive mechanisms. Firstly, along with the consumption of NOH+ species
through their reaction with NOx from the feed, the regenerated protons might have been poisoned with
NO2 by forming unreactive HNO2+ species. Secondly, considering that the lacunary heteropolyanions
might act as reductants in the direct decomposition of NOx over HPW12, as proposed earlier in section
3.1.2, NO2 and/or O2 might have oxidized the heteropolyanions, thereby making them non-reductive
and thus inactive in the direct decomposition of NOx from the feed, and leading to the accumulation of
NOH+ species which were no longer able to react. Through the first and/or the second mechanism, this
accumulation of unreactive species finally contributed to the deactivation of P-HPW12 observed in section 3.3.2 (Figures 5a-b and S8).
Figure 7. In situ DRIFT difference spectra of P-HPW12 (P standing for NOx-pre-saturated) at 380 °C vs. time of exposure to
a feed of NO (~ 2000 ppm) in O2(5%)-Ar(40%)/He (50 mLNTP/min), in the spectral region of N=O stretches within NOH+ and HNO2+ species. P-HPW12 was heated from RT to 380 °C at 3 °C/min under Ar(40%)/He (50 mLNTP/min). All difference spectra were obtained by subtraction of the last spectrum at 380 °C under Ar(40%)/He measured before NO and O2 were added into the feed. Log (1/R’) is expressed in arbitrary units, with the relative reflectance R’ = Isample / I(reference sample).
4. Conclusions
For the first time, the activity of H3PW12O40 (HPW12) in the direct decomposition of NOx was
investigated under continuous NOx feeding, at 380 °C. From the recorded NO decomposition and in situ
DRIFT data, the observed NOx decomposition activity of HPW12 was deduced to occur either through
the reaction of two neighbouring NOH+ adspecies, or through the reaction of one NOH+ adspecies with
gas phase NO. The presence of NO2 – either in the reaction feed due to the presence of O2 or in the bulk
of the sample – was found to deactivate HPW12, likely because NO2 poisoned the protons by forming
unreactive HNO2+ species. Nevertheless, the presence of O2 – in the feed and/or generated by the
decomposition process – was also found to have a positive impact, namely to initiate the diffusion of NOx into the bulk of the HPW12 crystals. However, this diffusion process effectively took place only
when the bulk of HPW12 already contained NOx beforehand pre-absorbed at RT, i.e. when the HPW12
crystals were still hydrated. Indeed, at 380 °C, the pre-absorbed NOx species preserved the diffusion
pathway in-between the bulk HPW12 units and therefore allowed the diffusion of the NOx from the feed
and their reaction with NOH+ species. In the presence of O
2 in the feed, the bulk-type reaction allowed
the otherwise inactive HPW12 material to remain active for 8 hours. By providing the key parameters involved in the NOx decomposition process over HPW12 at 380 °C, the present work paves the way for
future investigations in order to further improve the lifetime and activity of HPW12. Future investigations may focus, for instance, on tuning the chemical composition of the surface and/or bulk heteropolyanions in order to make the HPA more resistant to poisoning by O2 and/or NO2.
Supporting information
Structural water desorption profiles upon heating the two HPW12 samples from RT to the reaction temperature 380 °C under inert atmosphere; Full in situ DRIFT absorbance spectra of the two HPW12
samples under various conditions; NO and NO2 concentrations and N2/Ar trace recorded vs. time on
stream in the blank NO decomposition experiments with only quartz wool in the reactor; H2O
concentration recorded vs. time on stream during the pre-saturation of P-HPW12 with NOx at RT; NO
and NO2 concentrations and N2/Ar trace recorded vs. time on stream upon heating P-HPW12 from RT
to the reaction temperature 380 °C under inert atmosphere; Comparison of the NO and NO2
concentrations recorded vs. time on stream in the two successive NO decomposition experiments over P-HPW12 at 380 °C in the absence of O2 in the feed; N2/Ar trace recorded vs. time on stream in the NO
decomposition experiment over P-HPW12 at 380 °C in the presence of O2 in the feed, over a longer
time scale (600 min) than shown in the manuscript (30 min); Detailed comparison of the in situ DRIFT difference spectra in the region of N=O stretches within NOH+ and HNO
2+ species measured in the
experiments over P-HPW12 at 380 °C in the absence vs. presence of O2 in the feed.
Acknowledgements
This work has benefited from a funding managed by the French National Research Agency (DECOMPNOx project: ANR-18-CE07-0002). The authors acknowledge Jean-Marc Krafft (Sorbonne Université, CNRS, Laboratoire de Réactivité de Surface) for the technical support in in situ DRIFT experiments.
Author information
Corresponding authors
*E-mails: josefine.schnee@upmc.fr, josischnee@hotmail.com, cyril.thomas@upmc.fr.
ORCID numbers Josefine Schnee: 0000-0001-8521-9922 Laurent Delannoy: 0000-0002-3263-5065 Guylène Costentin: 0000-0003-1559-6890 Cyril Thomas: 0000-0003-4224-6095 Competing interests
The authors declare no competing interests.
References
1. Kozhevnikov, I. V. Sustainable heterogeneous acid catalysis by heteropoly acids. J. Mol. Catal.
A: Chem. 2007, 262, 86-92.
2. Kozhevnikov, I. V. Catalysis by heteropoly acids and multicomponent polyoxometalates in liquid-phase reactions. Chem. Rev. 1998, 98, 171-198.
3. Ganapathy, S.; Fournier, M.; Paul, J. F.; Delevoye, L.; Guelton, M.; Amoureux, J. P. Location of protons in anhydrous Keggin heteropolyacids H3PMo12O40 and H3PW12O40 by 1H{31P}/31P{1H}
REDOR NMR and DFT quantum chemical calculations. J. Amer. Chem. Soc. 2002, 124, 7821-7828. 4. Li, G.; Ding, Y.; Wang, J.; Wang, X.; Suo, J. New progress of Keggin and Wells–Dawson type polyoxometalates catalyze acid and oxidative reactions. J. Mol. Catal. A: Chem. 2007, 262, 67-76. 5. Bielański, A.; Lubańska, A.; Micek-Ilnicka, A.; Poźniczek, J. Polyoxometalates as the catalysts for tertiary ethers MTBE and ETBE synthesis. Coord. Chem. Rev. 2005, 249, 2222-2231.
6. Janik, M. J.; Campbell, K. A.; Bardin, B. B.; Davis, R. J.; Neurock, M. A computational and experimental study of anhydrous phosphotungstic acid and its interaction with water molecules. Appl.
Catal., A 2003, 256, 51-68.
7. Zhang, H.; Zheng, A.; Yu, H.; Li, S.; Lu, X.; Deng, F. Formation, location, and photocatalytic reactivity of methoxy species on Keggin 12-H3PW12O40: A joint solid-state NMR spectroscopy and DFT
calculation study. J. Phys. Chem. C 2008, 112, 15765-15770.
8. Sugii, T.; Ohnishi, R.; Zhang, J.; Miyaji, A.; Kamiya, Y.; Okuhara, T. Acidity-attenuated heteropolyacid catalysts: Acidity measurement using benzonitrile-TPD and catalytic performance in the skeletal isomerization of n-heptane. Catal. Today 2006, 116, 179-183.
9. Chen, N.; Yang, R. T. Activation of nitric oxide by heteropoly compounds: Structure of nitric-oxide linkages in tungstophosphoric acid with Keggin units. J. Catal. 1995, 157, 76-86.
10. Reddy, G. K.; Ling, C.; Peck, T. C.; Jia, H. Understanding the chemical state of palladium during the direct NO decomposition – influence of pretreatment environment and reaction temperature.
RSC Adv. 2017, 7, 19645-19655.
11. Haneda, M.; Hamada, H. Recent progress in catalytic NO decomposition. C. R. Chim. 2016, 19, 1254-1265.
12. Reddy, G. K.; Peck, T. C.; Roberts, C. A. CeO2–MxOy (M = Fe, Co, Ni, and Cu)-based oxides
for direct NO decomposition. J. Phys. Chem. C 2019, 123, 28695-28706.
13. Imanaka, N.; Masui, T. Advances in direct NOx decomposition catalysts. Appl. Catal., A 2012, 431-432, 1-8.
14. Song, Y.-J.; Jesús, Y. M. L.-D.; Fanson, P. T.; Williams, C. T. Kinetic evaluation of direct NO decomposition and NO–CO reaction over dendrimer-derived bimetallic Ir–Au/Al2O3 catalysts. Appl.
Catal., B 2014, 154-155, 62-72.
15. Modén, B.; Da Costa, P.; Fonfé, B.; Lee, D. K.; Iglesia, E. Kinetics and mechanism of steady-state catalytic NO decomposition reactions on Cu–ZSM5. J. Catal. 2002, 209, 75-86.
16. Wang, X.; Sigmon, S. M.; Spivey, J. J.; Lamb, H. H. Support and particle size effects on direct NO decomposition over platinum. Catal. Today 2004, 96, 11-20.
17. Peck, T. C.; Reddy, G. K.; Roberts, C. A. Monolayer supported CuOx/Co3O4 as an active and
18. Kozhevnikov, I. V. Sustainable heterogeneous acid catalysis by heteropoly acids. J. Mol. Catal.
A: Chem. 2007, 262, 86-92.
19. Herring, A. M.; McCormick, R. L. In Situ infrared study of the absorption of nitric oxide by 12-tungstophosphoric acid. J. Phys. Chem. B 1998, 102, 3175-3184.
20. Weng, X.; Dai, X.; Zeng, Q.; Liu, Y.; Wu, Z. DRIFT studies on promotion mechanism of H3PW12O40 in selective catalytic reduction of NO with NH3. J. Colloid Interface Sci. 2016, 461, 9-14.
21. Schnee, J.; Gaigneaux, E. M. Elucidating and exploiting the chemistry of Keggin heteropolyacids in the methanol-to-DME conversion: enabling the bulk reaction thanks to operando Raman. Catal. Sci. Technol. 2017, 7, 817-830.
22. Schnee, J.; Gaigneaux, E. M. Lifetime of the H3PW12O40 heteropolyacid in the
methanol-to-DME process: A question of pre-treatment. Appl. Catal., A 2017, 538, 174-180.
23. Yang, R. T.; Chen, N. A new approach to decomposition of nitric oxide using sorbent/catalyst without reducing gas: Use of heteropoly compounds. Ind. Eng. Chem. Res. 1994, 33, 825-831.
24. Sirita, J.; Phanichphant, S.; Meunier, F. C. Quantitative analysis of adsorbate concentrations by diffuse reflectance FT-IR. Anal. Chem. 2007, 79, 3912-3918.
25. Belanger, R.; Moffat, J. B. A comparative study of the adsorption and reaction of nitrogen oxides on 12-tungstophosphoric, 12-tungstosilicic, and 12-molybdophosphoric acids. J. Catal. 1995, 152, 179-188.
Unravelling the Direct Decomposition of NO
xover Keggin Heteropolyacids and
their Deactivation Using a Combination of Gas-IR/MS and in Situ DRIFT
Josefine Schnee,* Laurent Delannoy, Guylène Costentin, and Cyril Thomas* Sorbonne Université, CNRS, Laboratoire de Réactivité de Surface (LRS), F-75005 Paris, France. *Corresponding authors: josefine.schnee@upmc.fr, josischnee@hotmail.com, cyril.thomas@upmc.fr.
Supplementary information
Figure S1. H2O concentration and temperature trace recorded by the MKS MultiGas 2030 IR analyzer as a function of time on stream upon heating (a) the N-HPW12 sample from RT to 380 °C at 10 °C/min under He (50 mLNTP/min), and (b) the P-HPW12 sample from RT to 380 °C at 3 °C/min under Ar(8%)/He (50 mLNTP/min).