Calcium-Silicate-Hydrate in cementitious systems: chemomechanical
correlations, extreme temperature behavior, and kinetics and morphology
of in-situ formation.
byDeepak Jagannathan
B. Tech, Indian Institute of Technology Madras (2010)
Submitted to the Department of Materials Science and Engineering in partial requirements for the degree of
Master of Science in Materials Science and Engineering
at the
Massachusetts Institute of Technology
February 2013
fulfillment of the
@2013 Massachusetts Institute of Technology. All rights reserved. A.
Signature redacted
A uthor ... . V . . . . . . ... Dep ent of Mateials Science and Engineering
January 14 2013
Signature redacted
C ertified by ... ...
/1-
0 () Krystyi{J. Van Vliet, Thesis Advisor Paul M. Cook Career Develop Associate Pro or of Materials Science and EngineeringI
" Ar o Mei a urene r
E ea ted
Accepted by...Signature
redacted
Gerbrand Ceder, Chairman, DMSE Committee on Graduate Students R.P. Simmons Professor of Materials Science and Engineering
OFTMARESOMY
JUN
-05
2013
Dedicated to Janaki Srinivasan, Rama Jagannathan, Rangaswamy Jagannathan, and Dinesh Jagannathan whose unshakable faith in my abilities
once said
"We cannot teach people anything; we can only help them discover it."
This is a humble attempt to express, in mere words, my gratitude towards people who have guided by discoveries at MIT.
When I started to work with
e
/I can confidently say that I was the least meticulous member of her research group. Being haphazard was not a particular strength in this situation. Over the past two years, as a result of her consistent insistence to put my best foot forward, I have been able to reach, hitherto unknown, potentials. In fact, to be quantitatively precise, I have become 147.2
29.8 % more efficient with my time. In particular, being more organized has made me a
better team player in my collaborative efforts. I owe her for helping me discover the benefits of a strong work ethic.
has been sweet and optimum to me. It is quite essential that every graduate student finds an optimum office. If you become best friends for life with your office mates, the probability of your graduation within a prescribed time frame will dwindle to appallingly low values. On the other hand, you should like them enough to share a cottage in the woods in New Hampshire for the weekend. This group has been that and much more.
Others have helped me see the method in the madness, that my experimental data is.
/?/can infuse energy and imagination into any
topic, and make it seem fascinating. Before taking his class, I would not have considered microporomechanics to be something interesting. Watching him present conclusive evidence
/
opinion/
wild guess with such natural presence has helped me discover my -passion for telling stories.has helped me discover patterns in my data through his vast experience. On more than one occasion, he has been able to listen to my ramblings, stare outside through the window for a brief moment, and voila, a diagnosis or explanation that I would have never thought of. He has helped me discover the
joy of connecting the dots between what you know and what you see.
It may come as no surprise to the reader that I am still learning how to be a skilled experimentalist. Luckily, I have been able to partner with the right people.
During the early stages of my graduate program,
helped me ease into the life of an experimentalist. He helped me learn the arts of sample preparation and nanoindentation. For my last project, I have been able to perform complex
experiments. I owe and
for designing these experiments and for being great collaborators.
In the past two years, my e living in
Cambridge, MA have given me unique experiences to cherish. I cannot list all of them here for space constraints. However, I want to mention that in each one of them, I discovered a part of myself.
Contents
Abstract
1 Calcium Silicate Hydrates in cementitious materials
1.1 Sustainability Challenge .... ...
1.2 Cement Chemistry Notation - A Primer ... 1.3 Hydration of Portland Cement ...
1.3.1 Initial and slow reaction periods . . . .
1.3.2 Nucleation & Growth of C-S-H . . . . 1.3.3 Open Questions in Cement Hydration . . . . 1.4 Structure of C-S-H in mature pastes . . . .
1.5 Characterization of C-S-H . . . . 1.5.1 Mechanical Properties: Nanoindentation . . . .
1.5.2 Composition of C-S-H - Electron Probe Microanalysis .
1.6 Thesis Outline . . . .. . . .
2 Chemomechanics of Calcium Silicate Hydrates
2.1 Introduction . . . . 2.2 Materials & Methods . . . ... ...
2.3 Results & Discussion . . . ...
2.3.1 Ca/Si ratio of the C-S-H phase . . . .
2.3.2 Taguchi experimental design . . . .
2.3.3 Comparison with molecular simulations . . . .
2.3.4 Influence of C-S-H nano-scale properties on micro-scale composite prop-erties of cement paste . . . . 2.4 Sum m ary . . . .. . . .
3 Towards designing concrete for protective infrastructure
3.1 Introduction . . . . 3.2 Materials & Methods . . . .
3.3 Results & Discussion . . . .
3.3.1 Comparision of C-S-H in UHPC & OPC . . . .
3.3.2 Effect of steel fibers on UHPC matrix . . . .
3.3.3 Effect of exposure to elevated temperatures . . . .
3.4 Sum m ary . . . .. . . . 13 16 . . . . 16 . . . . 17 . . . . 17 . . . . 18 . . . . 19 . . . . 22 . .. .. .. . 24 . . . . 27 . . . . 27 . . . . 35 . . . . 39 40 40 . . . . 41 . . . . 48 . . . . 50 . . . . 50 . . . . 52 57 59 61 61 61 63 63 65 68 71
4 Early stages of cement hydration: nucleation and growth
4.1 Materials & Methods ... 4.1.1 Raman Spectroscopy ....
4.2 Results & Discussion ... 4.3 Summary ...
5 Conclusions
5.1 Summary of Results . . . .
5.2 Contributions ...
5.3 Directions for Future Work . . . .
5.3.1 How to reliably synthesize C-S-H phase erties? . . . .
Kinetics & nanostructure of C-S-H
with specific nanoscale
prop-5.3.2 Influence of mechanical properties of the C-S-H nanoparticle on me-chanical properties of concrete . . . .
5.3.3 Use of porosity in materials for protective infrastructure . . . .
5.3.4 Influence of hydration water chemistry on hydration of alternative ce-m ent clinkers . . . . Appendix A Materials used in cement paste synthesis
A .1 M onoclinic C3S . . . .
A .2 f -C 2S . . . .
A.3 White Portland Cement . . . .
A.4 Lafarge Portland Cement (Grey Cement) . . . .
A.5 Brayton Point Class F Fly Ash . . . . . . . . . . . . . . . . . . . . 73 74 77 80 86 89 89 90 90 90 91 92 92 93 93 93 93 94 94
List of Figures
1.1 Representative plot of rate of alite hydration as a function of time showing
various stages of hydration. . . . . 18
1.2 Classification of Si atoms in 29Si MAS NMR spectroscopy. . . . . 20
1.3 Evolution of relative quantities of
Q,
silicates with time in a typical cement paste... ... . . . . 211.4 Concrete is a multiscale material. . . . . 23
1.5 Schematic of multiscale structure of C-S-H . . . ... . . . . 25
1.6 Morphologies of Outer Product and Inner Product C-S-H. . . . . 26
1.7 Load-Displacement curve and contact area in Nanoindentation experiments. 27 1.8 Hypothetical nanoindentation dataset to demonstrate mixture modelling. . . 30
1.9 Real nanoindentation dataset segregated into multiple phases/ phase mixtures using mixture modelling. . . . . 31
1.10 Matrix-Porosity and Polycrystal morphologies of porous materials. . . . . 33
1.11 Micromechanics-based modelling of data obtained from nanoindentation to calculate m, and h., of the C-S-H nanoparticle . . . .. . . ... 34
1.12 Analysis of EPM-WDS experiments - 1. Mixture modelling with concentra-tions of seven elements as variables. . . . ..37
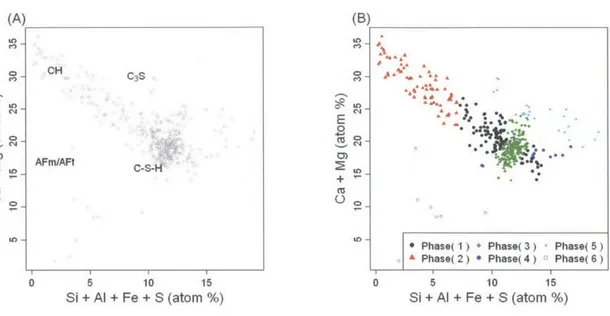
1.13 Analysis of EPMA-WDS experiments - 2. Mixture modelling with Ca, Si, and Al concentrations as variables. . . . . 37
1.14 Analysis of EPMA-WDS experiments - 3. Mixtiire modelling with Ca+Mg and Si+Al+Fe+S as variables. . . . . 38
2.1 Micromechanics-based modelling of nanoindentation data to calculate stiffness and hardness of the C-S-H nanoparticle is deemed successful only when it meets certain empirical criteria. . . . . 45
2.2 Classification of Si atoms in 2 9 5i MAS NMR spectroscopy. . . . . 47
2.3 Deconvolution of NMR spectra. . . . . 48
2.4 Comparison of results from our experiments with those from molecular simu-lations on the C-S-H phase. . . . . 52
2.5 From molecular simulations on the C-S-H phase, dependence of stiffness of the C-S-H nanoparticle on its density and proportion of dimeric silicate groups. 53 2.6 From molecular simulations on the C-S-H phase, thermodynamics of formation of C-S-H polymorphs .. . . . . . . . ... .. . . .. .. .*. 55
2.7 Influence of stiffness of the C-S-H nanoparticle on the microscale stiffness of the cement paste . . . . .. . . . ... 56
2.8 Voxel maps of indentation modulus measured by nanoindentation of 400x400
m2 area on cement paste specimens. . . . . 58
3.1 Schematic of experimental setup used for heat treatment of UHPC samples at Oak Ridge National Laboratory. . . . . 63 3.2 Comparison of composition and nanoscale mechanical properties of C-S-H in
UHPC with those found in OPC. . . . . 64
3.3 Voxel maps of indentation modulus measured by nanoindentation on pristine UHPC specim ens. . . . .. 65
3.4 Probability distribution of indentation modulus data set of the 100-series and the 400-series of pristine samples . . . .. . . . . 67 3.5 Voxel maps of indentation modulus measured by nanoindentation on heat
treated UHPC specimens. ... .. ... ... ... .. ... ... 69
3.6 Probability distribution of indentation modulus data set of the 100-series and
the 400-series of heat treated samples. . . . . 70 3.7 Probability distribution of Ca/Si ratio measured by X-ray spectroscopy in the
100-series and the 400-series of samples. . . . . 71
4.1 Experimental apparatus to setup hydration of microscopic clinker particles in picoliter droplets of hydration water. . . . .... 75
4.2 Drawing a suspension of alite particle in isopropanol to deposit on the glass slid e. . . . . 76
4.3 Array of picoliter droplets of NaOH pH 12 reacting with microscopic C3S
particles deposited on a glass slide observed under optical microscope. ... 77
4.4 Dynamics of reaction interface inside the droplet and fundamentals of image analysis . . . . 78
4.5 Raman spectra of hydrated and carbonated cement pastes. . . . . 79
4.6 Evolution of the growth front of the hydration product inside the droplet. . . 80
4.7 Growth rates of hydration product computed by tracking growth fronts of 30 interfaces using image analysis algorithms .. . . . ... . . . . 81
4.8 Influence of composition of hydration water on the growth rates of hydration product. . . . . 82
4.9 Raman spectra of C3S particles in NaOH pH 12 after 2.5 h of hydration. . 84
4.10 Evolution of Raman spectra collected on the surface of C35 particle covered
List of Tables
1.1 Major phases in Ordinary Portland Cement. . . . 17 2.1 Summary of first batch of cement pastes prepared using full factorial design
m atrix . . . .. . . . .. . . . . 43 2.2 Summary of Taguchi L16 array of cement paste samples prepared at MIT. . 44 2.3 Summary of results on nanoscale properties of the C-S-H phase in cement
pastes. . . . .. . . . . 49 2.4 From analysis of experiments based on Taguchi L16 matrix, optimal levels of
different synthesis factors of cement pastes to achieve various target nanoscale properties of the C-S-H phase . . . . . . . . .. .... 51 2.5 Comparison of oc sample to specific samples from L16 array. ... 51
2.6 Results of NMR experiments on samples in which we measured the highest
stiffness of the C-S-H nanoparticle. . . . . 54
2.7 Stiffness m, of the C-S-H nanoparticle and microscale composite stiffness M, of the cement paste in 5 samples of the L16 array in which micromechanical modelling to predict mechanical properties of the C-S-H nanoparticle was
successful. . . . . 57 2.8 From mixture modelling of nanoindentation data, we can extract average
mi-croscale stiffness of C-S-H phase as the mean standard deviation of M among data points belonging to the C-S-H cluster. . . . . 59
Abstract
Concrete, the second most used material on the planet, is a multi-scale heterogeneous ma-terial. A fundamental component known as Calcium-Silicate-Hydrate which forms from the reaction between cement and water is the binding phase in concrete. Curiously, this is the least understood component of concrete because of its porous amorphous structure. Fur-ther, beyond mere scientific curiosity, cementSs industry large carbon footprint due to its volume of usage sets up a practical context to seek improvements in concrete performance and equip concrete with additional functionalities. It is our contention that we can better understand the least known and crucial component of concrete, Calcium-Silicate-Hydrate, to inform the design of next generation of high performance concrete. With this broad theme, this thesis presents three different aspects of properties of Calcium Silicate Hydrate: chemo-mechanical correlations, behavior under extreme temperature and pressures, and kinetics and nanostructure of in-situ formation.
Calcium Silicate Hydrate (C-S-H) formed in-situ in concrete is believed to have a lay-ered structure with silicate chains similar to crystal structures of Tobermorite and Jennite. Its chemical composition, characterized by Ca/Si ratio, must therefore influence its silicate chain structure and thus its mechanical properties. We explore the correlation between
C-S-H composition and its mechanical properties. By varying chemical composition of cement
clinkers and supplementary cementitious materials, water/cement ratios, and hydration tem-peratures, we prepare cement pastes with different C-S-H of different C/S ratios. We use nanoindentation and X-ray spectroscopy to respectively measure the mechanical properties and composition of C-S-H.
We then study the mechanical performance of C-S-H at elevated temperatures. This is relevant in the design of infrastructure that can sustain extreme events such as blasts and high velocity impacts. As a starting point for concrete that would enable such infrastruc-ture, we use ultra high performance concrete (UHPC). We use nanoindentation and X-ray spectroscopy to respectively measure mechanical properties and composition of individual components of UHPC. We compare the composition and properties of C-S-H found in UHPC to that found in ordinary cement pastes (OPC). Our grid nanoindentation experiments also reveal an artifacts created by the incorporation of steel fiber reinforcements in UHPC. We find that steel fiber reinforcements disrupt the perfect packing of constituent materials in
UHPC to create capillary porosity at microscale. Further, we study the mechanical
proper-ties of C-S-H in concrete specimens subjected to high temperatures of 400*C and 1000*C. As a product of the reaction between cement and water, the properties of C-S-H are ultimately controlled by the reaction. To obtain quantitative kinetics, we use time-lapse optical microscopy to study hydration of micron sized monoclinic C3S particles with in
droplets of water of 50 rum. Using Raman spectroscopy, we characterize the hydration
Chapter 1
Calcium Silicate Hydrates in
cementitious materials
1.1
Sustainability Challenge
Concrete is the second most consumed material in the world, with 20 billion tons produced annually, representing one cubic meter per capita per year [1]. Concrete has a huge carbon footprint due to its scale of consumption and the use of cement. Production of cement generates 0.8 tons of CO2 per ton of cement, resulting approximately in 0.3 tons of CO2 per ton of concrete [2]. On the other hand, cement is crucial to concrete's mechanical strength [3].
A composite material comprising primarily of cement, sand, and water, concrete derives its
mechanical strength from calcium-silicate-hydrate (termed C-S-H), a product of the reaction between cement and water [4]. The C-S-H phase binds multiple components of concrete together, providing structural integrity to concrete. [4]. Interestingly, after two centuries of concrete usage, C-S-H, the vital binding phase, is the least understood component of concrete.
A fundamental understanding of C-S-H, specifically its mechanics, offers limitless
possibil-ities to engineer concrete with higher performance, multiple functionalpossibil-ities, and reduced car-bon footprint. [2, Essay: What's the matter with Concrete] The nano-to microscale porosity of C-S-H together with multiscale heterogeneous nature of concrete have hindered a system-atic understanding of C-S-H. Advances in materials characterization techniques in the last decade enable us to overcome these impediments by providing access to ever so smaller ma-terial volumes [5]. Herein lies the central theme of this thesis: a fundamental understanding of of physical, chemical and mechanical properties of C-S-H to inform the macroscopic design of concrete. This chapter sets up the context for original work in the following chapters by presenting a review of cement hydration, C-S-H structure and mechanics, and experimental techniques used to characterize C-S-H.
Phase Formula Wt% of OPC
Alite Ca3SiO5 50-70
Belite Ca2SiO4 15-30 Aluminate Ca3A206 5-10
Ferrite Ca2AlFeO5 5-15
Table 1.1: Major phases in OPC. All the phases have significant levels of impurities which are not captured in the listed formulae [6].
1.2
Cement Chemistry Notation
-
A Primer
Cement reacts with water to importantly produce the binding phase, C-S-H. The most common variety of cement is called Ordinary Portland Cement (OPC) or simply Portland Cement. It is made by heating limestone and clay, or other materials of similar bulk com-position, ultimately to a temperature of 1450*C [6]. Nodules of clinker are thus produced. Clinker is composed of four major phases: alite, belite, aluminate, and ferrite [6]. Table 1.1 details of composition of these phases.
The cement chemistry nomenclature represents these phases using oxides as elementary
components. For instance Ca3SiO5 is represented as 3CaO.SiO2. Common oxides are abbre-viated to single letters, such as C for CaO and S for SiO2. Ca3SiO5 thus becomes C3S, while
Ca2SiO4 becomes C2S. The most widely used abbreviations are listed below.
C = CaO S = SiO2 A = Al 2O3 F = Fe2 03
M=MgO K=K20 Sz=SO3 N Na20
T = TiO2 P = P205 H = H20 C CO2
Thus, the major phases in OPC are C3S, C2S, C3A , and C4AF in the order listed in the
table above. Note that C-S-H is not CaOSiO2H2O. The hyphens indicate the lack of specific stoichiometry.
1.3
Hydration of Portland Cement
The definitions of the following terms have been adopted from [6]:
Hydration is the reaction of clinker with water to produce various products including C-S-H.
Setting is stiffening of a mixture of cement and water without significant development of
compressive strength, and typically occurs within a few hours of mixing.
Paste is a mixture of cement and water in such proportions that setting and hardening
occur. This term is extended to include the hardened material.
Water/cement (w/c) or water/solid (w/s) ratio refers to proportions by weight; for a
4
S IV
0 8 16 24 32
Time (hrs)
Figure 1. 1: Representative plot of rate of alite hydration (quantified by heat flow in calori-metric experiments) as a function of time showing various stages of hydration separated by dotted lines. I Initial reaction; II Period of slow reaction; III Acceleration period; IV -Deceleration period. Based on Figure I in [4].
Curing means storage under conditions in which hydration occurs; typically in air initially and subsequently in water or saturated lime solution after 24 h.
Given OPC is a complex mixture of phases, studies on rate of hydration are typically conducted on individual constituent phases. A majority of these studies focus on alite, the principal constituent. For a given particle size and w/c ratio, setting and hardening processes of alite and OPC are similar [6]. 70% Of C3S in OPC reacts in 28 days and virtually all in 1 year to produce calcium hydroxide (CH) and amorphous C-S-H. Reaction Of C2S with water is similar, albeit much slower [4].
The rate of hydration has been measured using various techniques. Some examples include isothermal calorimetry, quantitative X-ray diffraction, nuclear magnetic resonance (NMR), and small angle neutron scattering (SANS). These techniques measure the net rate of hydration, but do not provide sufficient details to construct a reaction mechanism [41. However, they have been used to systematically explore influence of factors such as fineness of cement particles, w/c ratio, and temperature. Based on rates of hydration measured in calorimetric experiments (see Figure 1. 1), alite hydration reaction is divided into four stages:
(1) initial reaction, (2) period of slow reaction, (3) acceleration period, and (4) deceleration period.
1.3.1 Initial and slow reaction periods
In the initial period, wetting and dissolution Of C3S results in a sharp exothermic signal.
given by
C3S + 3H20 -+ 3Ca2+ + H2SiO42- + 40H- (1.1)
Interestingly, the dissolution rate of alite rapidly declines resulting in the so called induction or slow reaction period. Note that the reaction rate is still non-zero. Several hypotheses have been proposed and debated in the literature [8]. Here, we mention two mechanisms that continue to remain plausible in light of recent studies.
The metastable barrier hypothesis argues that rate of hydration reaction declines because of the formation of a continuous thin metastable layer of C-S-H which passivates the clinker surface by limiting diffusion of detaching ions. Calcium and silicate ion concentrations measured by various studies in literature on early hydration have been shown to lie along one of the two solubility curves, suggesting the existence of two different kinds of C-S-H; one stable and the other metastable [9]. Simulations of hydration reaction using a metastable barrier hypothesis have successfully reproduced several results from experimental studies of alite hydration [10]. Critics of the metastable barrier hypothesis point to scant direct experimental evidence of the existence of such a passivating layer. In recent years, the challenge has not been to prove the existence of an early hydrate phase, but to show its passivating influence [4]. The mechanism for the end of delay period is also not clear.
The slow dissolution hypothesis draws parallels from dissolution processes of many nat-ural minerals where build up of ions in solution controls the dissolution mechanism. For instance, far away from equilibrium, fast dissolution occurs through initiation of etch-pits, while closer to reaction equilibrium but still significantly undersaturated, the driving force is not sufficient to open etch-pits and dissolution occurs through slow retreating steps. Support
for this view comes from experiments on stirred C35 suspensions of high w/c (- 50000) [11]
and studies on role of crystallographic defects in the early hydration process [12]. Saturation state of the solution does not however seem to be the only controlling factor. In conventional alite hydration experiments, researchers have observed a sharp peak in silicate concentra-tion in the first few minutes. The decline of silicate concentraconcentra-tion has been attributed to
C-S-H nucleation. However, according to the slow dissolution step hypothesis, this decline
in silicate concentration should prompt an increase in rate of dissolution of alite which is not experimentally observed.
1.3.2
Nucleation & Growth of C-S-H
At a certain critical point, S-H nucleation and growth accelerates hydration kinetics.
C-S-H is known to nucleate heterogeneously on alite surface [13,14]. There is a growing body
of literature that uses nucleation and growth models to study alite hydration data (e.g., shown in Figure 1.1) and report good agreement between the model and experimental data. NMR spectroscopy based studies show that rate of hydration beyond the delay period is proportional to surface area of C-S-H suggesting C-S-H growth might be the rate determining step [15].
Because of limited number of direct observations of C-S-H nucleation, the literature on C-S-H nucleation is largely driven by modelling and simulation of hydration reaction [16]. Traditionally, Avrami's model [17], also known as JMAK model, has been applied to the calorimetric data shown in Figure 1.1. This model assumes that nucleation of C-S-H can be
0 4- 0 4- 0 4-C3S ... 0 OH OH OH OH C-S-H H OH OH OH OH 41 02
Figure 1.2: Si atoms in 29Si MAS NMR spectroscopy are labelled as Q, where n represents the number of bridging 0 atoms (that are bonded to two Si atoms). In anhydrous C3S ( and C2S), silicate tetrahedra exist as individual SiOj units and hence the corresponding Si atoms are labelled Qo (red). In C-S-H, there are two types of Si atoms. Qi (green) bonded to one bridging 0 atom occur at the end of silicate chains. Q2 (blue) bonded to two bridging O atoms occur in the middle of the silicate chains between two Qi ends. We refer to the ensemble of
Qn
Si atom with its four 0 atoms asQn
group.both homogeneous and heterogeneous which contradicts exclusive heterogeneous nucleation observed in the limited number of controlled experiments [13,14,18]. Applicability of Avrami model also requires nucleation to start 1 hour after mixing. On the other hand, boundary nucleation and growth model (BNG) proposed by Thomas [19] assumes heterogeneous nu-cleation on C3S particles and hypothesizes that nucleation of C-S-H starts as soon as alite is mixed with water. The Avrami model fits the calorimetric data until the hydration peak (end of stage III and start of stage IV in Figure 1.1). The BNG model has been shown to fit the calorimetric data well past the rate hydration peak. Further, 3D hydration simulations also predict nucleation to occur heterogeneously at the start of mixing [16]. The importance of nucleation in transition to acceleration stage is underscored by studies on eliminating induction period by seeding alite pastes with reactive form of C-S-H [20]. In these studies, the hydration rate progressed to acceleration stage immediately after mixing. The precise timing of nucleation is an ongoing area of research.
Growth mechanism and morphology are topics that have been heavily debated in the literature [4, references there in]. There are two schools of thought: one suggests that C-S-H grows as layers of defective silicate chains, while the other proposes aggregation of C-S-H nanoparticles.
Calcium atoms and hydroxyl groups are sandwiched between such silicate sheets to form structures similar to crystalline minerals forms of C-S-H known as Tobermorite and Jennite. This is compatible with TEM based observations of crystallinity in C-S-H at length scales of ~1 nm [21, 22]. To account for the long range disorder or amorphous nature of C-S-H, this mechanism proposes that the growth of silicate chains will be punctuated by defective sites where silicate tetrahedra do not attach. Further, the idea of polymerization of silicate chains is supported by evidence from NMR experiments.
NMR experiments classify Si atoms in silicate chains in cement into three: Qo, Q, and Q2
with the subscript indicating the number of bridging Oxygen atoms that are attached to the Si atom in question. While Qo Si atoms are only found in anhydrous C3S (and anhydrous
C25), Qi and Q2 Si atoms are found in C-S-H (Figure 1.2). Isolated silicate tetrahedra (SiO-) have Qo Si atoms, while a silicate chain with n Si atoms can be visualized as having 2 Q, Si atoms at the end of the chain and (n-2) Q2 atoms between the ends (Figure 1.2). Thus, higher the proportion of Q2 Si atoms, the longer the silicate chains.
Using NMR spectroscopy, several studies have shown silicates in early stages of cement hydration to be Qi silicates
[4].
Notably, Brough and coworkers123]
measured relative proportions ofQn
silicates, n E{0,
1, 2} as a function of time (see Figure 1.3). The proportionof Qo (red in Figure 1.3) steadily declines indicating the consumption of anhydrous C3S. In
the first 100 hours of alite hydration, the hydrated phase is dominated by Qi silicate groups (green in Figure 1.3). In other words, C-S-H initially consists of dimeric silicate groups. Note that the inflexion point in both the proportions of Q, and Q2 (green and blue, respectively in Figure 1.3) at about 1000 h. Qi starts to slowly decrease while Q2 starts to increase at a higher rate than before. The steady increase of Q2 points to increasing silicate polymerization in C-S-H, as hypothesized by the silicate tetrahedra based growth model for C-S-H.
The alternative mechanism for C-S-H growth is based on the aggregation of C-S-H nanoparticles. This mechanism proposes that nuclei of C-S-H or C-S-H nanoparticles grow up to a few nanometers and then stop growing
[4].
These nuclei then act as nucleation
100-QO
80-d 't 60-a. 20-100 101 102 10' 1W4 Time (h)Figure 1.3: Evolution of relative quantities of
Qn
silicates with time (log scale) for C35and aggregation sites for new C-S-H nanoparticles and existing C-S-H nanoparticles in pore solution, respectively. Such a mechanism is compatible with structural models for C-S-H
in mature pastes that will be discussed in the next section. However such nanoparticle based growth of C-S-H would imply that the thermodynamic driving force of heterogeneous or homogeneous nucleation of C-S-H nanoparticles is greater than that for growth of these particles. Evidence from experiments and modelling of C-S-H growth contradict this de-duction [4]. A deep divide between two structural models for C-S-H, i.e., silicate chain and
C-S-H nanoparticle based models, continues to exist. While the former accounts for
experi-mental data on early stages of hydration, the latter is best able to explain experiexperi-mental data on mature pastes. To complete the discussion on rate of hydration, deceleration period is triggered by several factors including diffusion, complete consumption of small alite particles, lack of space, and lack of water.
1.3.3
Open Questions in Cement Hydration
The following points of discussion have been assimilated from Refs. [4,16].
Mechanistic understanding of period of slow reaction
We presented the current views on the period of slow reaction. Settling this issue has practical benefits in being able to control the setting time and early age properties of concrete. For instance, some applications like oil-well cementing require long setting times during which the concrete remains fluid. This is currently achieved through an empirical understanding of accelerators and retarders, reagents that accelerate and retard the rates of hydration of cement, respectively. A mechanistic understanding with physical basis can help design concrete formulations for specific applications.
Kinetics of C-S-H nucleation & growth
We noted the studies on alite dissolution and nucleation of C-S-H. However, there is a dearth of knowledge on rate constants and rate determining steps controlling C-S-H nucleation and growth. The complexity of cement hydration has prevented a systematic understanding of kinetics of individual steps contributing to the hydration process.
Morphology of C-S-H growth
We discussed the two possible mechanisms of C-S-H growth. Several observations on mor-phology of C-S-H have been made in the literature. There is a lack of coherent understanding of C-S-H growth, particularly in the early stages and how it can be coupled with the models of C-S-H in mature pastes. As we will see in Chapter 3, a great deal of progress has been made in controlling the properties of other components of concrete. The missing link that hinders a complete control of macroscopic properties of concrete is therefore the growth and morphology of C-S-H phase.
Role of supplementary cementitious materials
Supplementary cementitious materials (SCM) like fly ash, blast furnace slag, silica fume etc, are becoming increasingly prominent in concrete mixes. These materials can substitute cement clinker and thus reduce concrete's carbon footprint. Further, these SCMs can react with water to produce hydration products, importantly C-S-H. These SCMs are far more complicated than crystalline phases in OPC. We lack a complete understanding of OPC hydration and the addition of SCMs further convolutes this problem.
Pores
Aggregates
o
+
Cement matrix
Pores
E
+
Un-reacted clinker
0Portlandite
C-S-H
Pores
E+
Monolithic C-S-H
Figure 1.4: Concrete is a multiscale heterogeneous material. 1 jtm micrograph adopted from [221.
1.4
Structure of C-S-H in mature pastes
The structure of C-S-H in mature pastes has been another topic that has been heavily debated in the literature. Figure 1.4 illustrates one of the reasons why unearthing C-S-H structure has been such a challenge: the multiscale heterogeneous nature of concrete. Porosity complicates the issue even further. Structure of concrete at various levels has been extensively studied and interested reader is referred to Refs. [24] and [25] for details on macroscale and microscale structures of concrete respectively. This section will focus on micro- and nano-structures of C-S-H which are at the heart of our nanoindentation based measurement of mechanical properties of C-S-H that will be described in the next section.
C-S-H is structurally and mechanically heterogeneous at sub-micron scale. A number
of researchers have agreed on two distinct forms of C-S-H, although their labels have been diverse [26]. The early models of C-S-H [27,28] were able to explain the porosity of C-S-H, but were unable to account for its variable morphology associated with two different forms of C-S-H. Feldman and Sereda [28] proposed that C-S-H phase was an assembly of irregular
C-S-H layers with inter-layer water molecules. Powers and Brownyard on the other hand,
proposed a colloid like C-S-H phase made of small bricks or fundamental units. The currently used "Jennings model" [29,301 borrows from both these models and successfully accounts for both characteristics of C-S-H, porosity and variable morphology.
The Jennings model is a concise model that posits C-S-H to comprise of two structurally distinct but compositionally similar phases. These two phases are distinguished by their porosities and are supposed to exist because of experimental data [29] which show a positive correlation between surface .area and gel porosity, as measured by nitrogen adsorption - a correlation which would be expected to be negative for a gel with a single porosity, that was proposed in earlier models [27]. Any model which considers the existence of two or more phases with different porosities would be able to explain this experimental phenomenon, but the fact that the Jennings model uses two phases is compatible with the observation of two distinct formations by many researchers.
The Jennings model proposes that "globules" of C-S-H (10 nm scale in Figure 1.5) of characteristic size ~ 5 nm pack themselves into two characteristic forms: Low Density (LD)
C-S-H and High Density (HD) C-S-H (500 nim scale in Figure 1.5) . The two phases are distinguished only by their porosities. The total gel packing density at microscale is a combination of the packing densities of LD and HD C-S-H:
TC-S-H 77LD X LD + 'HD X fHD (1.2)
where fAD and fHD are volume fractions of LD and HD C-S-H respectively and, fAD + fHD ~
1. These volume fractions describe C-S-H microstructure. This degree of freedom is also
the model's strength in contrast to earlier models which calculated singular values for C-S-H
gel porosity. Thus, while earlier models are unable to explain the evolution of gel porosity
during the cement hydration process, Jennings' model is able to reconcile with this fact by leveraging the degree of freedom of volume fraction of LD or HD C-S-H.
As noted above, two morphologies of C-S-H have been observed in several other studies. Richardson and others have noted the presence of two morphologically distinct forms of C-S-H in their Transmission Electron Microscopy (TEM) based studies of cement pastes [22,32]. They distinguish between outer product or Op C-S-H and inner product or Ip C-S-H. The
E
0
L
O-0
EE
Figure 1.5: Schematic of multiscale structure of C-S-H. At the scale of 1 nm, the molecular model of C-S-H nanoparticle (from 1311): the blue and white spheres are oxygen and hydrogen atoms of water molecules, respectively; the green and gray spheres are inter and intra-layer calcium ions, respectively; yellow and red sticks are silicon and oxygen atoms in silica tetrahedra. At 10 nm scale, several nanoparticles are packed into a globule represented as a grey rectangle (after
[29]).
Globules consists of C-S-H layers (deriving from layered structures of crystalline calcium silicate hydrates) shown in dark green separated by layers of water molecules. At 500 nm scale, several globules pack randomly to form the microstructure. Note that the dimensions of globules or porosity at this scale are much smaller than the indentation depth as a result of which the nanoindenter tip (shown in black) perceives a homogenous material.fibrillar Op C-S-H (see Figure 1.6) grows outwards from the clinker surface into the water filled pore space. Inner product or Ip C-S-H forms within the boundary of original clinker particles and has fine texture (Figure 1.6). Drawing parallels to globules of Jennings' models, Richardson notes that both Ip and Op C-S-H consist of (cit.) "globular particles" of different aspect ratios with dimensions ~ 10 nm
[221.
Several studies based on nanoindentation of cement pastes [26, 33-35] also report the presence of two forms of C-S-H. These studies estimate the packing fractions of LD and HD C-S-H to be r7LD = 0.63 and T1HD = 0.76(A)
(B)
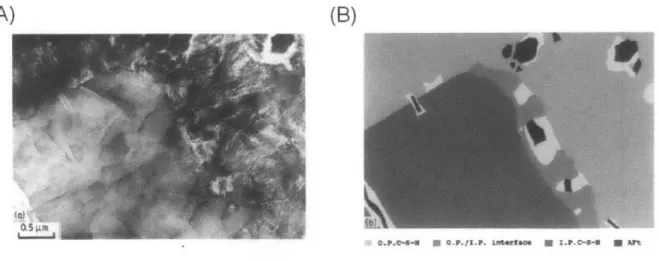
Figure 1.6: (A) Tranmission electron micrograph of OPC hydrated with w/c 0/4 at 20'C for 3 months showing distinct morphologies of inner product (Ip) and outer product (Op)
C-S-H. Ip C-S-H starting at the bottom left corner has a fine texture while Op C-S-H starting
at the top right corner has fibrillar morphology. (B) Schematic of the same micrograph showing Ip (dark grey) and Op C-S-H (light grey). Adapted from [1993Richardson.
respectively.
In essence, it is clear that the structure of C-S-H between 10s of nm and 1 pm consists of a colloid like assembly of globules or particles. The Jennings model postulates that these
globules in turn are an assembly of fundamental C-S-H nanoparticles of the size of - 1 nm.
We note that there is ongoing debate in literature on the precise packing arrangement of both fundamental nanoparticles to form a globule and globules to form LD (HD) C-S-H or
Op (Ip) C-S-H. However, as described in the next section, a clever theoretical construction in
micromechanics enables us to cut across these hierarchies to link the microscale properties of LD
+
HD C-S-H as measured by nanoindentation to the nanoscale properties of the C-S-H nanoparticle.Efforts to model the exact structure of C-S-H nanoparticle have centered on structures of two natural calcium silicate hydrate minerals, 1.4 nm Tobermorite (approximately C5S6H9
)
and Jennite (C9S6H1)
[221.
We remarked earlier about the parallels between silicate tetrahedra based growth model of C-S-H and structures of Tobermorite and Jennite. Every model must account for two basic characteristics of C-S-H. Firstly, C-S-H does not possess a unique composition, quantified by the ratio of Ca to Si atoms (Ca/Si or C/S). Ca/Si ratios in cement pastes range from 0.8 to 2.1 [22]. Secondly, nuclear magnetic resonance (NMR) spectroscopy and trimethylsilation (TMS) experiments have a recorded a series of distinctsilicate chain lengths 2, 5, 8 ... (3n - 1), where n is a natural number.
It is difficult to directly observe the structure of these nanoparticles in experiments. Pel-lenq et al., recently proposed a model of C-S-H nanoparticle [31] of Ca/Si = 1.65 using molecular simulations (Figure 1.5, 1 nm scale). They validate this model by predicting the density of C-S-H nanoparticle to be 2.56 g/cm3, which agrees closely with value of 2.6 g/cm3 measured from neutron scattering experiments on C-S-H of Ca/Si = 1.7
[361.
This modelthus provides opportunities to predict several material properties of the C-S-H nanoparti-cle, importantly its stiffness and hardness which contribute to the compression strength of concrete. In the next section, we describe the use of nanoindentation and micromechanics modelling to predict the mechanical properties of C-S-H nanoparticle. In this work, we will compare our experimental results to those predicted from molecular simulations to explore the molecular origins of the properties we measure.
1.5
Characterization of C-S-H
1.5.1
Mechanical Properties: Nanoindentation
During the last decade, with the emergence of nanotechnology, characteristic sizes have continually declined across a wide variety of material applications. Nanoindentation has emerged as a leading characterization tool for the measurement for physical and mechanical properties across dimensions ranging from a few nm to a few tm
[371.
Note that the idea of indentation however, i.e., pushing an indenter onto a material surface and characterizing the hardness of the material as the ratio of pressing force to the indentation area, dates back to early 2 0th century. Owing to advances in sensors, actuators and computerized control ofexperiments in early 1990s, nanoindentation today has evolved into an experimental tech-nique that can reliably measure continuum-scale mechanical properties by merely accessing sub-micron volumes of homogeneous materials.
A nanoindentation experiment involves application of load on a material surface using
(A) (B)
f
Hold
h
T
Loading Unloading
I
Displacement h
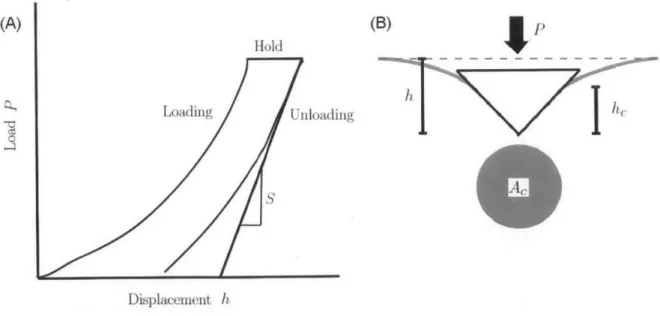
Figure 1.7: (A) Representative load displacement curve, its various segments and important variables defined in the text above. (B) Schematic of contact area in indentation experiments. P is the indentation load, h the indentation depth, h, is the contact depth, and Ac is the projected area of contact.
an indenter to collect the load-displacement response (Figure 1.7A). We use the Berkovich trihedral pyramidal indenter. The behavior of the material during unloading (at least in the early stages) is assumed to be elastic. From elastic punch theory, we can relate initial unloading response to the elastic properties as [5]
S= lh=hm.a = XV? x E' (1.3)
where
f
is a constant that depends on the shape of the indenter, A. is the contact area (see Figure 1.7B) at maximum penetration depth, and E' is a composite elastic modulus of the material and indenter given by1 1 -- V 2 i_
-- (1.4)
E E E
where E, v and E, v.7 are the elastic constants of the indented material and the indenter,
respectively. For the diamond indenter used in our work, Ein is at least one order of mag-nitude greater than E of most constituents of cementitious materials, thus E' ~- We define indentation modulus M as E_. Thus, equation 1.2 becomes
dP(15
S = =4hmax= X V
Z
X M (1.5)dh
Equation 1.2 was originally developed for flat punch indenters with constant c = = 1.128.
However, studies have shown it to be applicable to Berkovich indenter and estimate c in this case to be 1.167 [5]. Robust calibration methods have been established to accurately estimate the contact area A, for Berkovich indenter as a function of penetration depth h [38]. Hardness H is calculated as
H = Ihhmax (1.6)
A
Indentation of Cementitious materials: Grid Nanoindentation
Indentation provides access to mechanical properties at. length scale oc hmax, i.e., properties averaged over material volume oc h'ax. Given the nanoscale depth resolution, nanoinden-tation enables measurement of local mechanical properties. This is particularly relevant to calculating mechanical properties of constituent phases in heterogeneous material systems.
We wish to measure M and H of constituent phases of cementitious materials, importantly
C-S-H. Appropriate choice of indentation depth hmax is crucial to such experiments. If hmax is
much larger compared to characteristic size D of constituent phases, we would be measuring the composite response of mixture of phases. Thin film deposited on a substrate is a model material system in which characteristic size D (of the deposited phase) is easily accessible as the thickness of the film and thus, enables the study of the interplay between measured properties and indentation depth. Through indentation experiments on thin films at various
hmax/D values, Constantinides and Ulm [26] estimate a critical h/D = 0.1 below which the
measured mechnical properties of the film are within 10% of the mechnical properties of the pure phase. Transmission electron micrographs of cement pastes [32] have clearly shown
200 nm. There are two lower bounds for hmax. Theoretically, principles of continuum mechanics used in equation 1.2 are valid when representative elementary material volume (r.e.v.) 1 satisfies 1
«
hmax. For C-S-H, we can assume that this representative element is the C-S-H nanoparticles whose dimensions have been both theorized [29] and observed [22] to be well within 10 nm. The practical lower bound for hma, comes from surface roughness of the sample. One of the central assumptions in nanoindentation experiments is that the indenter is examining an infinite, isotropic, and homogeneous half-space. This assumption breaks down when surface roughness is comparable to or greater than the indentation depth. Surface preparation technique used in this work has been shown to reduce roughness to10 nm [39]. Based on these bounds, we choose hmax ~ 200 nm.
Now consider a material at length scale L
>
D, composed of multiple phases distributeduniformly. By performing a number of individual indentation tests, we would be able to sample constituent phases in a heterogeneous material with a probability that is equal to their respective volume fractions. This is the premise of grid nanoindentation - indenting at sufficiently shallow depths to estimate properties of a pure phase in a multiphase material and then repeating the indentation process a number of times to capture all the constituent phases in the multiphase material [33]. Recently, there have been a few studies that question grid nanoindentation based approach to measuring mechanical properties of C-S-H [40,41]. Their principal criticism centers around interaction volume of nanoindentation being comparable to volumes of pure LD or HD C-S-H seen in microscopy based studies in literature. In other words, at the proposed hmax and given the microscopic length scales of C-S-H, can the nanoindenter measure the individual properties of LD and HD C-S-H? In this work, we do not seek to evaluate individual M and H of LD or HD C-S-H, but rather seek the average mechanical properties of composite C-S-H phase (LD C-S-H + HD C-S-H) to subsequently compute the stiffness and hardness of the C-S-H nanoparticle. For this purpose, we can safely assume that at hma, proposed above, we are not evoking a composite response of
C-S-H and other phases in cement paste. Thus, for our objectives, grid indentation provides
the desired and valid access to mechanical properties of interest. Data Interpretation
In a typical grid nanoindentation experiment, we carry out 1000 indentations and thus obtain a M and H data set. We first eliminate the data points extracted from irregular data curves corresponding to pores and surface preparation defects. The data set, thus obtained, is referred to as filtered data set. These irregular curves account for less than 20% of data. We then separate the subset of data points corresponding to the C-S-H phase from the filtered M and H data set using mixture modelling algorithms. We use the MCLUST package [42] available in R [431, a computational tool for statistical analyses. We briefly review the principles of mixture modelling here. For detailed understanding, the reader is referred to the MCLUST package documentation'.
Given a set of data points for a mixture of components or phases, a mixture modelling or clustering algorithm is able to create a mixture model, i.e., classify each data point as belonging to a unique component or phase. In our case, this data set is a series of (M, H) coordinates associated with cement paste, a phase mixture. To demonstrate the idea, let us consider a solid phase mixture S1 with three solid phases with properties (M1, H1) =
(100, 10), (M2, H2) = (30, 1), (M3, H3) = (50, 5) where all values are in GPa. A hypothetical
nanoindentation data set for S1 is shown in Figure 1.8A. A curious reader might wonder why the results of a nanoindentation experiment have a scatter of data points around the bulk properties. The scatter arises out of (1) experimental error, and (2) mixing of phases, (2) being a bigger factor than (1). The reader is advised to refer back to the thin films analogy given in the previous section. The mixture modelling algorithm is then able to classify each data point in the data set as belonging to either Phase 1 or Phase 2 or Phase 3, shown in Figure 1.8B with different colors. Note that the mixture modelling process is agnostic to the actual values ofM and H of these phases. It merely explores the proximity and spatial density of data points in a scatter and comes up with the best model to account for the obtained data set. In this case, the only input that the algorithm accepts is a guess value of the number of phases present for which we use the range
[1-201.
For each of n C [1 - 20], the algorithm fits the probability density of obtained experimental dataset P(M, H) as the sum of the probability densities of clusters centered around n individual phases. In other words, it minimizes the difference Dn x P(M , Hi, o-4)
D = P(M, H) - (1.7)
where
f
2 is the volume fraction of phase i. Mi and Hi are the bulk properties of phase i. (-i(A)
(4-(0 2 0 CD 0 40 0-(B)
0 ('4-(0 (0 C4 Mo 5 10Indentation Hardness H (GPa)
15 0 5 10
Indentation Hardness H (GPa)
Figure 1.8: (A) Hypothetical experimental dataset obtained from nanoindentation of phase mixture S1 (see description above) (B) Mixture modelling algorithms segregates dataset in
(A) into groups or clusters (represented by different coloured symbols) each corresponding
to a unique phase. Here, the properties of individual phases are (M1, H1) = (100, 10),
(M2, H2) = (30, 1), (M3, H3) = (50, 5) GPa.
* Phase( 1) A Phase( 2) + Phase( 3)
is the covariance matrix given by
__ [MM PMH
LPMH (THH I (1.8)
where aMM and UHH are standard deviations of M and H respectively. PMH is a measure of correlation between M and H. Additionally, the BIC criterion adds an extra term to D propor-tional to the number of terms n so that we arrive at an optimum mixture model with the least number of phases n. Further, MCLUST also explores several possible covariance structures. Hence, the variables that are being optimized to minimize D are n, {fi}, {Mi}, {Hi}, {T }.
The covariance matrix, especially the values of PMH can help identify phases in cement paste. In grid nanoindentation experiments, we perform nanoindentation on a grid at differ-ent locations on a specimen. For crystalline materials like unreacted clinker and portlandite, the tip of the nanoindenter possibly encounters different crystalline planes as a result of which we measure different values of M and H at different locations. However, note that there would be no correlation between measured values of M and H at different locations, and thus, PMH = 0. In the scatter plot of M and H, the corresponding cluster would be almost round. On the other hand, variation in local properties of C-S-H result from the
0 C) -(B) 0 0 46-h C 6 10 20
Indentation Hardness H (GPa)
0D
ILO
6 10 20
Indentation Hardness H (GPa)
Figure 1.9: (A) Experimental dataset obtained from nanoindentation (B) Mixture modelling algorithms segregate dataset in (A) into groups or clusters (represented by different coloured symbols) each corresponding to a unique phase/phase mixture.
(A)
0 I 75 0 0 4-oAS: . A Ad9A 06 000 Clinker + Steel Wire
A Quartz + Clinker
+ C-S-H
40.
change in packing density 7. In this case, the measured M and H would be highly correlated because both are proportional to i7. In this case, the corresponding cluster would look be
relatively narrow and elongated. Figure 1.9 demonstrates this idea using the results on a real nanoindentation data set obtained for ultra high performance concrete. The constituent phases at the microscale are quartz, clinker, C-S-H and steel fibers. The properties of all phases except C-S-H are known and by elimination, we assign the green cluster (Figure 19B) of data points to C-S-H phase. For the C-S-H phase, we find < M >E [25 - 35] GPa and
<H >E [0.5 -,1.5] GPa in agreement with refs. [26,33, 341. In.Figure 1.8B, notice that the
C-S-H cluster is different in shape from that corresponding to clinker phase as expected.
Micrornechanics - Extrapolation to nanoscale properties of C-S-H
At the nanoscale, C-S-H is a composite material of C-S-H nanoparticle and porosity. Since, the characteristic length scales of these two components are much smaller (-- 10 nm) than
h,m., in our experiments, nanoindentation is a valid technique to measure homogenized
mi-croscale properties of C-S-H. Micromechanics provides the link between M and H obtained from nanoindentation, i.e., composite properties, and intrinsic stiffness m, and hardness h, of C-S-H nanoparticle respectively. Homogenized response M and H is a function of the following parameters [35]
1. Intrinsic properties of C-S-H nanoparticle such as stiffness m,, cohesion c, Poisson's
ratio v, and friction coefficient a. of the C-S-H nanoparticle.
2. Packing density 77 of C-S-H nanoparticles. For instance, LD and HD C-S-H have different packing densities.
3. Morphological parameters like percolation threshold 77o, that is the solid fraction
re-quired to provide a continuous force path through the system. In micromechanics, there are two different morphological models of porous materials (Figure 1.10). In the matrix-porosity model, a distinct, homogeneous solid phase is punctuated with poros-ity. In this case, the solid phase remains continuous for any packing density 7 > 0, that is N = 0. In polycrystal morphology, the solid phase itself is a granular material. In
this case, the composite material of solid phase and porosity becomes unstable below
= 0.5 and thus, in this case qO = 0.5.
4. Indenter geometry-specific parameters such as cone angle 0. For the pyramidal Berkovich
indenter, the equivalent cone angle 0 = 70.320.
Based on nanoindentation experiments [35,451, it has been shown that C-S-H is a ran-domly packed porous material (Figure 1.10). We note from our earlier discussion on C-S-H structure that indeed C-S-H has hierarchical porosity: nanoparticles pack into globules and globules into LD (HD) or Op(Ip) C-S-H. For this class of materials, micromechanics provides the. following scaling relations [351
(9r, + 4g + 3r,)(3r, + 4) (1.9) 4(49
+
3r,)(3r, + 1)where (1 + vs) 3(1 - 2vs) 1 5 2 4 3 TI)- rs(2 +1)+ 16 (1.10a) (1.10b) 1 1144(1 - rs) - 4807 + 40072 + 480r,7 - 120r,772 9r2(2 + 1)2 16
Constantinides and Ulm
[341
showed that equation 1.6 was insensitive to the value of poission's ratio vs. For vs = 0.2, equation 1.6 simplifies toM(ms, r) = rn(2r/ - 1) (1.11)
Using non-linear micromechanics, Cariou et al.
[44]
have developed a scaling relation for indentation hardnessH(c, a, rI) c,I[1 + (1 + rq)cs - (d - e7)a -
(f
- gra).l] (1.12)P R... h.... ... (a) c 0 Matrix-Pore Morphology 5,cz)
A
Figure 1.10: Indentation of porous materials. porosity (B) Random packing or Polycrystal. Ada
Polycrystal Morphology
Two different morphologies (A) Matrix-pted from [441.
0.6 0.3 0.01J 100 Trial no. 5 30 0 15 1 10' Tr 90 ~50. 10 0.5 0.75 Packing density q ( ci
Figure 1.11: (A) Several trial micromechanics models with different values of parameters
m, cs and a were fit against nanoindentation data subset corresponding to C-S-H phase,
{Mi}
and{Hi}
and subsequently enumerated in ascending order of fitting error E. Trial 1 is the best fitting model that fits the data with the least curve fit error, Emin. The models to the left of dotted line fit the data with E < 1.01emin. (B) Best fitting model (solid line) plotted with experimental data (green circles) to show goodness of fit.where
S=12 7(a - bq) V"(2 - -1)(2 +T1) (I - cI) (2 + q)
and a = 0.19567, b = 0.03739, c = 077999, d = 20.3138, e = 31.5352, f = 52.1817, and g
99.3465 are all constants associated with Berkovich indenter geometry and percolation
thresh-old of random packing morphology, r0 = 0.5. In practice, our M and H dataset from
nanoin-dentation subjected to mixture modelling algorithms provides a subset associated with the
C-S-H phase, {Mi} and {Hi} respectively. We seek to find the unique intrinsic properties
of C-S-H nanoparticle m, cs, and as. We generate a number of trial models with different values of these parameters. The corresponding scaling relation is fit to the
{Mi}
and{Hi}
data subset corresponding to C-S-H phase. There are is a unique set of values {nm', c~aO} of
C-S-H nanoparticle that minimize the fitting error E defined as
1 / M(mS,)- Mi) 2
c({Mi}, {Hi},
{7},
m, cs, as) = - E=1m <M> + H(cs, as I) - Hi) 2 <H>(1 (1.13) 120 70 JEE 20
ial no. 105 10' Trial no. 105
8 W6, 0-(D. M4 2 0.5 0.75 Packing density 9 (B)