HAL Id: hal-03149789
https://hal.archives-ouvertes.fr/hal-03149789
Submitted on 24 Feb 2021
HAL is a multi-disciplinary open access
archive for the deposit and dissemination of
sci-entific research documents, whether they are
pub-lished or not. The documents may come from
teaching and research institutions in France or
abroad, or from public or private research centers.
L’archive ouverte pluridisciplinaire HAL, est
destinée au dépôt et à la diffusion de documents
scientifiques de niveau recherche, publiés ou non,
émanant des établissements d’enseignement et de
recherche français ou étrangers, des laboratoires
publics ou privés.
Empirical Mode Decomposition (EMD) for multi-gate,
multi-transducer Ultrasound Doppler fetal heart
monitoring
Denis Rouvre, Denis Kouamé, François Tranquart, Léandre Pourcelot
To cite this version:
Denis Rouvre, Denis Kouamé, François Tranquart, Léandre Pourcelot. Empirical Mode
Decomposi-tion (EMD) for multi-gate, multi-transducer Ultrasound Doppler fetal heart monitoring. 5th IEEE
International Symposium on Signal Processing and Information Technology (ISSPIT 2005), Dec 2005,
Athène, Greece. pp.208-212, �10.1109/ISSPIT.2005.1577097�. �hal-03149789�
Empirical Mode Decomposition (EMD) for multi-gate, multi-transducer Ultrasound
Doppler fetal heart monitoring
Denis Rouvre
1, Denis Kouamé
1, François Tranquart
2, and Léandre Pourcelot
1 1LUSSI CNRS FRE 2448, Université de Tours, Faculté de Médecine, 10 boulevard Tonnelé, 37032 Tours Cedex 1, France. E-mail: kouame@univ-tours.fr
2
Inserm U619, Hopital Bretonneau-CHRU Tours, 37044 Tours cedex 9, France. E-mail: tranquart@univ-tours.fr
Abstract— This paper presents a new technique called
Empir-ical Mode Decomposition (EMD) applied to a gate, multi-transducer Ultrasound Doppler system used for fetal heart mon-itoring. We propose this system as an alternative to the existing fetal monitoring techniques.
Classical autocorrelation-based Fetal Heart Rate (FHR) detec-tion has been shown to be a good method to detect the FHR in normal situations. However, as this method is applied to magni-tudes of the Doppler signal fails to estimate the Fetal Heart Rate when the fetus moves. In view of the extent of FHR variability, a monitoring system should be able to estimate this parameter each time. We therefore propose empirical mode decomposition as an interesting alternative for long-term monitoring.
The principle of this method consists of iterative decompo-sitions of a signal into a sum of functions that have the same number of extrema, the same number of zero crossings, and are symmetric with respect to the local mean. When investigation of FHR using autocorrelation on the original Doppler signal fails due to fetal movement or low Signal-to-Noise Ratio (SNR), it is frequently successful using the intrinsic mode functions (imf s). We compared the results of multi-transducer FHR detection with and without EMD decomposition using in-vivo Doppler signals from a set of 40 women between 32 and 38 weeks of pregnancy. This method greatly improved the quality of FHR detection.
Index Terms— Empirical Mode Decomposition, Electronic fetal
monitoring, Actifoetus
I. INTRODUCTION ANDREQUIREMENTS FOR FETAL
MONITORING
There are several different types of fetal monitoring sys-tems. Ultrasound B-mode scanners are used to obtain fetal measurements in order to detect abnormal growth, and Doppler measurements are used to study blood circulation between the mother and fetus and also in the umbilical cord. All these measurements are performed at the beginning of the preg-nancy and periodically during the pregpreg-nancy. Another type is a continuous or discontinuous electronic fetal heart rate monitoring device, the cardiotocogram, which is the reference in the field of Electronic Fetal Monitoring (EFM) [1] but this only measures the FHR and not fetal movements. Ultrasound (US) Doppler provides both detection of the FHR and fe-tal movements of the fetus, thus providing more information on fetal well-being, and is widely used for FHR monitoring. Whether mono or bi-transducer, these systems using contin-uous or pulsed ultrasound waves provide partial automated detection of movements [2] and fetal breathing [3] [4].
The aim of this study was to develop a more complete sys-tem consisting of a multi-transducer multi-gate prototype de-vice with specific signal processing techniques for fetal
mon-itoring to form a fetal biophysical profile providing more in-formation on fetal behavior than FHR alone [5].
Moreover, with data from 40 women between 32 and 38 weeks of pregnancy, each carried out with the Actifoetus sys-tem, we showed that classical autocorrelation based Fetal Heart Rate (FHR) detection is not always satisfactory, and we have developed a new signal processing technique based on Empir-ical Mode Decomposition (EMD) to improve such detection. We focus here on FHR detection.
In a first part of this article, we present our acquisition device, referred to as Actifoetus. In the second part we in-troduce the new signal processing method called Empirical Mode Decomposition, and finally we show in-vivo results to illustrate the value of the system.
II. MATERIALS
A. The system
A new Doppler system, referred to as Actifœtus, has been developed for fetal activity monitoring (Actifœtus system built
by Ultrasons TechnologiesTM). It consists of twelve 2MHz
transducers (3 groups of 4 transducers) with five gates. The Actifoetus system comprises a Pentium 4 2 Ghz based Per-sonal Computer, dedicated management software, an electrical security transformer in order to comply with safety require-ments in the hospital, and the prototype electronic device. This device includes three electronic pulsed Doppler elec-tronic Boards, a data acquisition board, and three groups of transducers. The emission signal is sinusoid, with frequency
f0= 2M hz. The received signal is first amplified by a
low-noise amplifier, then by a deep compensated amplifier in or-der to compensate for the strong attenuation of the deepest gates. Finally the signal is band pass filtered (center frequency
f0). After complex in-phase demodulation, the components
are sampled sequentially and converted. Pulse Repetition
Fre-quency (PRF) is 1kHz. Data are recorded directly on the
computer hard drive.
Body exploration is performed with all twelve transducers. Adjustable gates ranging from 2 to 14 centimeters are explored and these 5 gates are independently adjustable in depth using software.
B. Transducer arrangement
In order to obtain a better interpretation of the signals mea-sured, transducers are divided into three groups of four trans-ducers. Fig. 1 shows a group of sensors on the flexible silicone
208
Symposium on Signal Processing and Information Technology
2
support. A transducer group is composed of 4 transducers : a central transducer and 3 transducers placed around the central transducer. Fig. 2 shows a transducer group
arrange-Fig. 1. A transducer group is composed of 4 transducers : a central
transducer and 3 transducers placed around the central transducer.
ment during monitoring. Group A (transducers #1-#4) explores the fetal thorax, investigating fetal heart rate and breathing movements, Group B (transducers #5-#8) the upper limbs, and Group C (transducers #9-#12) the lower limbs. The twelve transducers monitor the activity of all the regions of interest in the fetus. The ultrasound beam of the transducers is as wide as possible to maximize the region of exploration. A belt is used throughout the recording in order to prevent transducer movement. GROUP C Sensors #9 #10 #11 #12 ELECTRONIC DATA ACQUISITION (ACTIFŒTUS ®)
PC
GROUP B Sensors #5 #6 #7 #8 GROUP A Sensors #1 #2 #3 #4Fig. 2. Transducer group arrangement. Group A (transducers #1-#4) explores
the fetal thorax, investigating fetal heart rate and breathing movements, Group B (transducers #5-#8) the upper limbs and Group C (transducers #9-#12) the lower limbs.
III. SIGNAL PROCESSING BACKGROUND Before introducing the empirical mode decomposition pro-cessing technique, we briefly summarize the Ultrasound Doppler signal parameters and signal processing techniques used to extract fetal heart rate information.
A. Ultrasound Doppler signal parameters
Ultrasound (US) Doppler is a widely used method to eval-uate the behavior of moving targets in terms of velocity and related information. When an ultrasound wave with frequency
f0 is emitted from a transducer towards a moving target, the
frequency of the backscattered wave received isf0+ fd. After
complex in-phase and in-quadrature demodulation, the analyt-ical Doppler signal can be written as :
y(t) = K(t) exp j[2πfd(t) + ϕ(t)] = I(t) + jQ(t) (1)
whereK(t) is the random magnitude of the Doppler signal,
depending on the characteristics of the transducers and the
measurement area, and ϕ(t) is the random phase, depending
on the positions of the scatterers in the flowing fluid. The
frequency shiftfd (called Doppler frequency) may be written
as :
fd(t) =
2f0
c cos θv(t) (2)
wherev = |~v| and ~v is target velocity, θ is the angle between
the ultrasound beam and vector~v, and c is the ultrasound wave
velocity in the medium. Angleθ does not have to be evaluated
precisely here, since the purpose is to extract variations in fetal heart rate.
This Doppler signal contains a large amount of informa-tion concerning target movement (velocity, posiinforma-tion) via the Doppler frequency (2) and the overall phase, which can be obtained by (3), expresses the distance of the transducer from
the scatterers in millimeters, with a factor 4λπ.
φ = arctan(Q(t)
I(t) + nπ). (3)
The velocity of the target, which is proportional to Doppler frequency, can be accessed by the time frequency distribution [6],[7].
Finally, the magnitude of the backscattered signal depends on the characteristics of the transducers and the nature of the scatterers. A direction separation filter is necessary to fol-low the magnitude of movements towards and away from the transducer separately. This eliminates both positive frequency components and negative frequency components. This separa-tion filter thus gives two signals (forwards and backwards). As mentioned above, direction information can also be accessed through the overall phase.
B. Detecting fetal heart rate using Doppler signal processing
Initially a convolution algorithm [8], based on three-stage computation using the directional magnitude of the Doppler
signals x = [x(1), ..., x(N )], was used in order to estimate
the FHR. During the first stage, the signal was smoothed. The autoconvolution
Rx(p) =
PX−1
p=0
x(n − p)x(n − N + p) (4)
was evaluated and then low-pass filtered (cut-off frequency 20 Hz). In the second stage, the intervals between two suc-cessive peaks were evaluated (representing intervals between
two successive heartbeats), and in the last stage the results obtained for the two signal magnitudes were compared. When they agreed, these values were validated.
The performance of this algorithm was very poor when the SNR was low, and we therefore investigated a simple alternative to this method, i.e. the autocorrelation method, that estimates the fundamental frequency of a periodic signal, such as a fetal heart Doppler signal. This consists of computing
normalized autocorrelation coefficients (5) for L samples of
the signal and for lags between a × Fe and b × Fe, where
Fe is the sampling frequency. To allow detection of a rate
between 80 to 200 beats per minute (i.e. the typical fetal
heart rate range) we seta = 1.33 beats per second (bps) and
b = 3.33bps. Rx(p) = 1 N N−|p|−1X n=0 x(n)x(n + p) (5) withp = 0, ±1, ±2, ...
When the maximum autocorrelation coefficient was close to 1 (or greater than an empirical threshold ), meaning that the signal was indeed periodic, this coefficient position provided an estimation of the signal period. Note that any time and/or frequency estimator may also be used to estimate the FHR.
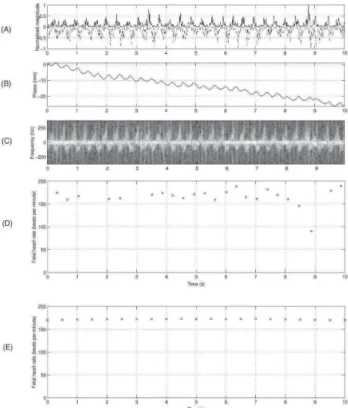
Figure 3 show the analysis of a 10 second Doppler signal produced by fetal heart beats for a given transducer at a given gate. In fig.3 (A) we show separate magnitudes (solid and dashed lines), indicating movement towards and away from the transducer. Figure 3, (B) shows the Doppler signal phase , (C) the spectrogram , and (D) the Fetal Heart Rate computed by autoconvolution method and (E) by autocorrelation method. The trend seen in (B) is due to a slight movement of the transducer during the recording.
Although the autocorrelation method outperforms the au-toconvolution method, it may also lose the FHR when the signal is noisy. Fig.4 shows an example of a loss of FHR. Fig.4 (A) shows the spectrogram (Time-Frequency diagram) of a transducer signal at a given gate, fig.4 (B) shows the phase of this signal and fig.4 (C) shows the fetal heart rate estimated with the autocorrelation technique. Movement at the
16th second induced a loss of FHR.
C. Empirical Mode Decomposition
We have seen that the Autocorrelation FHR detection method is a good method to detect FHR in a normal situation. How-ever, in view of the magnitudes of the signal, this method "looses" the FHR when the fetus is moving (see Fig.4). In view of recognized extent of FHR variability, the system must estimate the FHR all the time. We propose empirical mode decomposition as an interesting alternative for this purpose in long-term monitoring.
A new nonlinear technique, referred to as Empirical Mode Decomposition was first introduced by Huang [9] to represent nonstationary signals as sums of zero-mean Amplitude Modu-lation (AM) and Frequency ModuModu-lation (FM) components. In
Fig. 3. Analysis of 10 second Doppler signal produced by fetal heartbeats for a given transducer at a given gate. Separated magnitudes (solid and dashed lines) are movements towards and away from the transducer, respectively (A), Doppler signal phase (B), spectrogram (C), Fetal Heart Rate computed by autoconvolution method (D) and by autocorrelation method (E). The trend seen in (B) is due to a slight movement of the transducer during the recording.
Frequency (Hz) 0 10 20 30 40 50 −400 −200 0 200 400 5 10 15 20 25 30 35 40 45 50 55 60 0 1 2 3 Unwrapped Phase (mm) 5 10 15 20 25 30 35 40 45 50 55 60 100 120 140 160 Time (s)
Fetal heart rate (bpm)
(A)
(B)
(C)
Fig. 4. Analysis of 60 second Doppler signal produced by fetal heartbeats for a given transducer at a given gate. (A) shows the spectrogram of the transducer signal. (B) shows the phase. (C) shows the fetal heart rate estimated with the autocorrelation technique. The movement that can be seen on (A) and (B) at 16th
second induced a loss of Fetal Heart Rate.
4
spite of frequently interesting results, this technique is defined only by a algorithm, and does not for the moment set out an analytical formulation which would allow for theoretical analysis and performance evaluation. This method has recently been further explored by Flandrin and Rilling [10], [11], [12], in particular to study its denoising properties.
The principle consists of decomposing a signal x(t) into a sum of functions that have the same numbers of zero crossings and extrema and are symmetric with respect to the local mean. This method therefore seems to be adaptable to the Doppler signal.
The first situation is similar to the narrow band require-ment for a stationary Gaussian process. The second modifies an overall requirement to a local requirement, and is neces-sary to ensure that the instantaneous frequency will not have unwanted fluctuations as induced by asymmetric waveforms. These functions are called intrinsic mode functions (imf s). The decomposition is based on the direct extraction of the energy associated with various intrinsic time scales, the most important parameters of the system.
Given a signal x(t), the algorithm of EMD (called sifting process [9] [10]), can be summarized as follows :
1) identify all extrema of x(t)
2) interpolate between minima (resp. maxima), ending up
with some envelopesemin(t), resp. emax(t)
3) compute the meanm(t) = (emin(t) + emax(t))/2
4) extract the detaild(t) = x(t) − m(t)
5) iterate on the residualm(t)
In practice, the above procedure must be redefined by a sifting process [9], a method which amounts to first iterating steps 1 to 4 upon the signal detail d(t), until the latter can be considered as a zero-mean signal according to a stopping cri-terion. Once this has been achieved, the detail is considered to
be the effectiveimf , the corresponding residual is computed
and step 5 applies.
This construction means that the number of extrema de-creases from one residual to another. There is thus a finished
number of imf s in the signal. In our case, the application
of the EMD amounts to signal filtering with nondefinite fre-quency bands which depend on the signal characteristics.
IV. IN-VIVO RESULTS
Clinical validation of the Actifoetus system is in hand at a University Hospital and is being subjected to a clinical proto-col. We have meanwhile about 40 measurements of 30 min-utes, each carried out on pregnant women with the Actifoetus system after the third trimester echography. The position of the fetus was thus known before recording.
A. Short term measurement
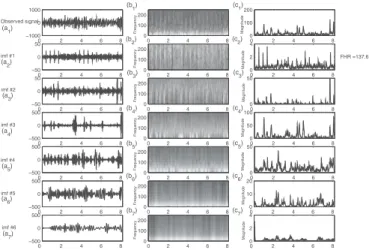
In fig. 5 (a1) a Doppler signal from a pregnant woman can
be seen coming from transducer 1 (third depth, between 7 cm and 9.5 cm) of the Actifoetus. This signal consisted of
movement and FHR. On this recording, a small movement was noted between the third and the fourth seconds. This
movement can be seen on the thirdimf (imf #3). Classical
autocorrelation-based FHR detection failed on the original sig-nal, because of this movement and of poor SNR. Thus, EMD enabled us to separate the movement from the rhythm in this
case, and to detect FHR on the firstimf . Fetal heart beat was
found on the first imf (imf #1), and was 137.6 bpm. This
corresponded to the 138 bpm measured during recording.
0 2 4 6 8 −1000 0 1000 0 2 4 6 8 −50 0 50 0 2 4 6 8 −50 0 50 0 2 4 6 8 −500 0 500 0 2 4 6 8 −500 0 500 0 2 4 6 8 −500 0 500 0 2 4 6 8 −500 0 500 Frequency 0 2 4 6 8 0 100 200 Frequency 0 2 4 6 8 0 100 200 Frequency 0 2 4 6 8 0 100 200 Frequency 0 2 4 6 8 0 100 200 Frequency 0 2 4 6 8 0 100 200 Frequency 0 2 4 6 8 0 100 200 Time Frequency 0 2 4 6 8 0 100 200 0 2 4 6 8 0 2 4 Magnitude 0 2 4 6 8 0 10 20 Magnitude 0 2 4 6 8 0 50 Magnitude 0 2 4 6 8 0 50 100 Magnitude 0 2 4 6 8 0 50 Magnitude 0 2 4 6 8 0 2 4 FHR =137.61 Magnitude 0 2 4 6 8 0 100 200 Magnitude Observed signal imf #1 imf #2 imf #3 imf #4 imf #5 imf #6 (a1) (a2) (a 3) (a4) (a5) (a6) (a 7) (b1) (b2) (b3) (b4) (b5) (b6) (b7) (c1) (c2) (c 3) (c4) (c5) (c6) (c7)
Fig. 5. Analysis of 8 second Doppler signal produced by fetal heartbeats
for transducer 1 at the third depth. Empirical Mode Decomposition of an Actifoetus observation signal (a1). (b1) represents Time frequency diagram
of (a1), (c1) represents magnitude of (a1). (a2) represents the first imf of
(a1),(b2) represents Time frequency diagram of (a2), (c2) represents
magni-tude of (a2). (a3) represents the second imf of (a1), etc... Autocorrelation
detection is computed on magnitudes, column (c). FHR detection failed on the original signal but succeeded on the first imf , and was 137.6 bpm.
It can be seen that that the FHR was detected on one of
the first three imf s whereas the movements present in the
original signal are visible onimf s higher than three.
B. Long term measurement
The value of this system was evident with long-term mon-itoring. As shown on fig. 6, we compared the autocorrelation method applied directly to the signal coming from transducer 1 (third depth, between 7 cm and 9.5 cm) with the
autocor-relation method applied to both the imf s and the original
signal. In this in-vivo situation, the FHR was mainly detected
onimf #2 and imf #3, whereas detection often failed when
not using EMD, mainly due to the presence of noise. Fig. 6 (c) shows that the FHR detection using
Autocor-relation on the imf s greatly improved the quality of FHR
detection, compared to the autocorrelation method applied di-rectly to the signal (fig. 6 (b)). In view of the extent of FHR variability, it is clear that the multi-transducer Autocorrelation method can fail to detect the fetal heart rate in the presence of fetal movement or low SNR. EMD can help to separate movement (or MHR) from the FHR signal, thus improving detection.
x 1(t) Frequency (Hz) 0 50 100 150 200 250 300 350 400 450 −200 −100 0 100 200 0 50 100 150 200 250 300 350 400 450 0 50 100 150
200 Autocorrelation FHR detection method
FHR (bpm) 0 50 100 150 200 250 300 350 400 450 0 50 100 150
200 Autocorrelation + EMD FHR detection method
time (s)
FHR (bpm)
(a)
(c)
(c)
Fig. 6. Analysis of 8 minutes’ Doppler signal produced by fetal heartbeats
for transducer 1 at the third depth. Spectrograms of Actifoetus transducer signal (a), FHR detection using Autocorrelation method applied directly to the signal (b), FHR detection using Autocorrelation on the imf s (c). Recording duration : 8 min.
V. DISCUSSION
We have presented here a new signal processing method called Empirical Mode Decomposition applied to a multi trans-ducer, multi-gate Doppler device for Electronic Fetal Monitor-ing.
Using Empirical Mode Decomposition, we showed that this method helps to extract the fetal heart signal from one of the intrinsic mode functions (imf s) resulting from Empirical Mode decomposition when the fetal heart signal is present but not extractable from the original source signal. However, this is a new technique which has not yet been completely formalized from a theoretical point of view, and computation time may vary according to intrinsic signal characteristics.
VI. CONCLUSION
Initial investigations for evaluating fetal heart rate using a multi-transducer, multi-gate system have shown that Empirical Mode Decomposition is a promising method to improve de-tection of the Fetal Heart Rate. In particular, we have shown that fetal heart rate detection can be improved by applying
autocorrelation to the imf s after Empirical Mode
Decompo-sition. EMD may also help to separate the different sources of the activity such as movements and FHR.
This method will now be investigated to improve detection of pseudo-respiration movements in the fetus, which are still difficult to extract.
REFERENCES
[1] Royal College of Obstetricians and Gynaecologists, The Use of
Elec-tronic Fetal Monitoring, The use and interpretation of Cardiotocography in intrapartum fetal surveillance, RCOG Press, 2001.
[2] B. Karlsonn, M. Berson, T.Helgason, R.T. Geirsson, and L. Pourcelot, “Effect of fetal and maternal breathing on the ultrasonic Doppler signal due to fetal heart movement,” European journal of ultrasound, vol. 11, pp. 47–52, 2000.
[3] B. Karlsonn, K. Foulquière, K. Kaluzynski, F. Tranquart, A. Fignon, D. Pourcelot, L. Pourcelot, and M. Berson, “The dopfet system : a new ultrasonic Doppler system for monitoring and characterisation of fetal movement,” Ultrasound in Med & Biol., vol. 26, no. 7, pp. 1117–1124, 2000.
[4] Y. Yamakoshi, T. Shimizu, N. Shinozuka, and H. Masuda, “Automated fetal breathing movement detection from internal small displacement measurement,” Biomed. Technik, vol. 41, pp. 242–247, 1996. [5] FA Manning, LD Platt, and Sipos L., “Antepartum fetal evaluation:
Development of a fetal biophysical profile,” Am J Obstet Genicol, vol. 136, pp. 787–795, 1980.
[6] D. Kouamé, J-M. Girault, and F. Patat, “High resolution processing techniques for ultrasound Doppler velocimetry in presence of colored noise part 1 : Nonstationary methods,” IEEE Trans. Ultrason. Ferro.
Frequency. Contr., vol. 50, no. 3, pp. 257–266, 2003.
[7] D. Kouamé, J-M. Girault, J-P. Remenieras J-P. Chemla, and M. Lethiecq, “High resolution processing techniques for ultrasound Doppler ve-locimetry in presence of colored noise part 2 : Multiple phase pipe flow velocity measurement,” IEEE Trans. Ultrason. Ferro. Frequency.
Contr., vol. 50, no. 3, pp. 267–276, 2003.
[8] Karlsson B., Application de l’effet Doppler ultrasonore à l’investigation
des mouvements fœtaux. Développement et validation d’un appareil bicapteurs et d’un système d’analyse des mesures, Ph.D. thesis, François Rabelais university of Tours, 1996.
[9] E. Huang and al., “The empirical mode decomposition and the hilbert spectrum for nonlinear and non stationary time series analysis,” 1998, vol. 454, pp. 903–995.
[10] P. Goncalves G. Rilling, P. Flandrin, “On empirical mode decomposition and its algorithms,” 2003.
[11] G. Rilling P. Flandrin, P. Goncalves, “Detrending and denoising with empirical mode decompositions,” 2004.
[12] P. Goncalves G. Rilling, P. Flandrin, “Empirical mode decomposition, fractional gaussian noise, and hurst exponent estimation,” 2005.