HAL Id: tel-01609900
https://tel.archives-ouvertes.fr/tel-01609900
Submitted on 4 Oct 2017HAL is a multi-disciplinary open access archive for the deposit and dissemination of sci-entific research documents, whether they are pub-lished or not. The documents may come from teaching and research institutions in France or abroad, or from public or private research centers.
L’archive ouverte pluridisciplinaire HAL, est destinée au dépôt et à la diffusion de documents scientifiques de niveau recherche, publiés ou non, émanant des établissements d’enseignement et de recherche français ou étrangers, des laboratoires publics ou privés.
Origins and adaptation in humans : a case study of taste
and lifestyle
Agnès Sjöstrand
To cite this version:
Agnès Sjöstrand. Origins and adaptation in humans : a case study of taste and lifestyle. Human genetics. Université Pierre et Marie Curie - Paris VI; Uppsala universitet, 2015. English. �NNT : 2015PA066724�. �tel-01609900�
Université Pierre et Marie Curie
Université d’Uppsala
ED227 : Sciences de la Nature et de l’Homme : Écologie et
Évolution
UMR7206 Eco-Anthropologie et Ethnobiologie,
Evolutionary Biology Center (Uppsala University)
UMR5525 Laboratoire TIMC-IMAG.
Origins and Adaptation in Humans
a Case Study of Taste and Lifestyle
Par Agnès Sjöstrand
Thèse de doctorat de Génétique des populations
Dirigée par Pr. Evelyne Heyer, Pr. Mattias Jakobsson &
Dr. Michael Blum
Présentée et soutenue publiquement le 20 novembre 2015
Devant un jury composé de :
David Comas, professeur (rapporteur)
Luis Quintana-Murci, directeur de recherche (rapporteur)
Thierry Wirth, professeur (examinateur)
Denis Pierron, chargé de recherche (examinateur)
Åsa Johansson, chercheuse (examinatrice)
Evelyne Heyer, professeure (directrice de thèse)
Mattias Jakobsson, professeur (directeur de thèse)
Ubuntu (Nguni word)
Shosholoza (Ndebele word)
List of Papers
This thesis is based on the following papers, which are referred to in the text by their Roman numerals.
I Sjödin, P., Sjöstrand, A. E., Jakobsson, M., Blum, M. G. B. (2012) Resequencing data provide no evidence for a human bottleneck in Africa during the penultimate glacial period. Molecular biology and evolution, 29(7): 1851-1860.
II Sjöstrand, A. E., Sjödin, P., & Jakobsson, M. (2014) Private haplotypes can reveal local adaptation. BMC genetics, 15(1): 61.
III Sjöstrand, A.E., Sjödin P., Naidoo T., Schlebusch C. M., Gattepaille L., Hollfelder N., Günther T., Jakobsson M., Patterns of local adaptation in Africans using genome data (manuscript).
IV Sjöstrand, A.E., Sjödin, P., Heyer, E., Blum, M.G.B., Jakobsson, M., Taste and lifestyle: insights from SNP-chip data, (manuscript).
Contents
Introduction ... 13
Origins of Homo sapiens ... 13
Out of Africa ... 15
Population structure in Africa ... 17
Peopling of Central Asia ... 20
Lifestyle transitions in Human history ... 21
Adaptation in modern Humans... 24
Taste and diet ... 26
Mechanisms of taste perception in humans ... 28
Background and methods ... 31
Genetic variation ... 31
Evolutionary forces and equilibrium models ... 33
The human genome and genetic diversity ... 34
Detecting local adaptation in populations ... 37
Inferring human demography ... 40
Association studies ... 43
Enrichment analysis applied to genetic data ... 44
Psycho-physiological tests for taste perception ... 46
Research Aims ... 49
Results and discussion ... 50
Origins of modern humans (Paper I) ... 50
Methods for detecting local adaptation (Paper II) ... 53
Detecting local adaptation in Humans (Paper II, III and IV) ... 55
Taste perception and lifestyle (Paper IV) ... 58
Conclusions and future prospects ... 61
Svensk sammanfattning ... 63
Résumé en Français ... 66
Origines de l’Homme Moderne ... 66
Peuplement du globe et structure de population... 67
Etude de l’adaptation locale ... 68
Goût et mode de vie ... 69
Conclusions générales ... 71
Acknowledgments... 72
Abbreviations
TRC: Taste receptor cell
bp: base pairs
kb: thousand base pairs
Mb: Million base pairs
DNA: Deoxyribonucleic acid
TAS1R: taste 1 receptor
TAS2R: taste 2 receptor
GPCR: G-Protein Coupled Receptor
ABC: Approximate Bayesian Computation
SNP: Single Nucleotide Polymorphism
TMRCA: Time to Most Recent Common Ancestor
MHC: Major Histoincompatibility Complex
kya: thousand years ago
mya: million years ago
Introduction
Origins of Homo sapiens
The common ancestors of our species Homo sapiens and all the extinct related species from genus Homo are believed to originate in Africa, where we find the most ancient remains of Homo habilis and Homo ergaster (between 2.8 and 1.7 mya). During more than two million years, the Homo genus evolved to a high diversity of morphologies: Homo erectus, the first that left Africa around 1.9 million years ago, Homo neanderthalensis and Homo heidelbergensis, Homo floresiensis, and Homo sapiens.
Two models for the apparition of Homo sapiens have been proposed, the “Multiregional model” and the “Out-of-Africa model”. According to the Multiregional model, the transition from Homo erectus to Homo sapiens appeared in several continents with different modern human characteristics arising in different regions of the world. The Out-of-Africa model on the other hand, states that the transition to modern traits happened in Africa and thereafter spread across the world and outcompeted all other Homo forms.
In favor of the Out-of-Africa model, the first remains of anatomical modernity – any trait close to what is found in humans nowadays – dating from 300kya to 150kya are found in Eastern and Southern Africa (Stringer 2002; White et al. 2003; Trinkaus 2005; Barham and Mitchell 2008; Tattersall 2009). Analyses of genetic data are also in favor of the Out-of-Africa model, revealing a loss of genetic diversity with the distance to Out-of-Africa (Cann et al. 1987; Ingman et al. 2000; Jobling and Tyler-Smith 2003; Ramachandran et al. 2005), among other aspects.
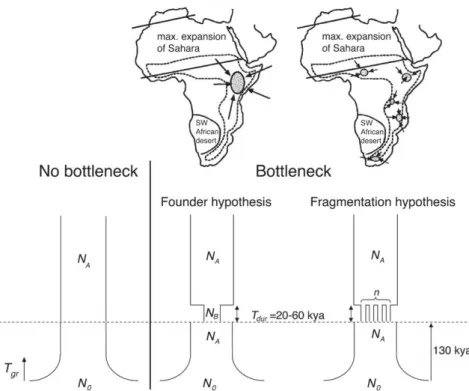
First anatomically modern fossils coincide with a glacial period referred to as MIS6 (from 190 to 130kya) (White et al. 2003; McDougall et al. 2005). During this period, the ice sheet was extended (Hetherington and Reid 2010) and the unfrozen areas consisted to a large extent of deserts, savannas and open dry forests whereas rain forest receded in comparison to interglacial periods (Van Andel and Tzedakis 1996; Dupont et al. 2000). Open grasslands, found during MIS6, would not protect early humans against predators (Lahr and Foley 1998). Because of environmental factors, it is thought that this glacial period has led to a bottleneck in human populations
and could be the cause of speciation at the origin of the Homo sapiens species.
There are several pieces of genetic evidence in favor of a bottleneck at the origin of modern humans. First, the most recent common ancestor to all human mitochondrial lineages has been dated to the onset of MIS6 around 190kya, with an uncertainty interval of 30kya (Gonder et al. 2007; Behar et al. 2008). Also, the times to the most recent common ancestors in autosomes is eight times longer than in mitochondrial DNA, which is higher than expected at equilibrium and possibly reconciled with a model including a bottleneck during MIS6 (Blum and Jakobsson 2011). Finally, humans present 1.5 to 4 times lower genetic diversity than apes, suggesting a strong reduction of the population size at the origin of modern humans (Kaessmann et al. 2001).
There are two proposed scenarios for explaining the influence of the climate on human populations during the MIS6 (Lahr and Foley 1998). The fragmentation hypothesis suggests that, as a consequence of the severe aridity during MIS6 in Africa (Castañeda et al. 2009), potential refugia suitable for humans were fragmented and therefore human populations consisted in small groups geographically isolated making any gene flow impossible. After the glacial period, the areas suitable for living would be wider and these groups would have been able to get in contact again. On the contrary, the founder scenario postulates that only one group among all the hominins found in Africa would have been the ancestor of all modern humans. Under that model, the proposed refugia during MIS6 are East Africa where the earliest well-dated anatomically modern humans have been described (McDougall et al. 2005), the south coast of South Africa with its unusual confluence of plant diversity, coastline richness, and moderate climate (Marean et al. 2007; Marean 2010) or North Africa where a fossil of early Homo sapiens has been dated to 160kya (Smith et al. 2007).
Today, the generally accepted model for the origin of humans, consistent with most of the evidence from genetics, archaeology and paleontology, would be that modern humans originated in Africa at a period of arid climate before spreading to the rest of the globe almost 100kya afterwards.
Out of Africa
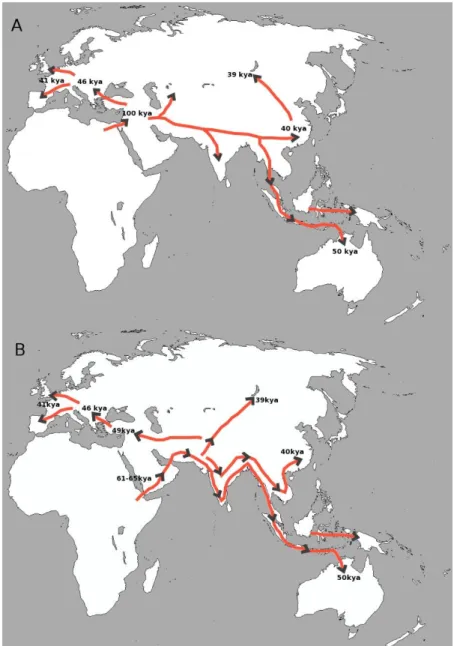
Outside of Africa, fossil record date anatomically modern humans from 40 to 60kya in Eurasia & Oceania (Trinkaus 2005; Mellars 2006) and up to 100kya in the Levant (Armitage et al. 2011; Rose et al. 2011) with fossils of anatomically but not necessarily behaviorally modern humans, as the earliest evidence of culture is dated to 70kya in Southern Africa (Henshilwood et al. 2002). In similar ways, genetic data also suggest an Out-of-Africa migration event dating from 100-60kya with a bottleneck in all non-African populations around that time (Laval et al. 2010) which lead to a loss of genetic diversity and increasing of linkage disequilibrium with the distance to Africa (Jakobsson et al. 2008). Two routes of migration out of Africa have been proposed, a southern route via the Bab-el-Mandeb strait and a northern route via the Sinai Peninsula into the Levant.
The Northern route (Figure 1A) is supported by fossils of anatomically modern humans in Israel dating between 90 and 130kya (Qafzeh & Skhul) (Stringer et al. 1989). Remains of Homo sapiens were later replaced by Neanderthal remains, and this migration of Homo sapiens out of Africa was therefore thought to have failed (Shea 2003; Grün et al. 2005). Nevertheless, it is possible that a later migration occurred via the northern route. Indeed, a recent study (Pagani et al. 2015), using genome data from Egyptians and Ethiopians shows that the Northern route is more coherent with genetic data, and maybe the northern route should not be discarded yet.
The Southern route (Figure 1B) is supported by the ancient remains found in Oceania dating from 50kya, older than remains found in Eurasia (Roberts et al. 1990). Some genetic evidence also support the Southern route such as the presence of very deeply rooted mitochondrial haplotypes in South Asia absent from populations from the Levant (Quintana-Murci et al. 1999; Macaulay et al. 2005), and an Aboriginal Australian genome (Rasmussen et al. 2011). In this model, modern humans migrated out of Africa around 61-65 kya to the Arabic peninsula. After the migration into the Arabic peninsula, several routes (coastal and more inland) are suggested to account for the fossils observed in Australia (50kya), Eastern China (40kya), Lake Baikal (39kya), the Middle East (49kya) and Europe (46-41kya).
Figure 1: Maps of human migration routes out of Africa to the old world and
Australia. A: Northern route model B: Southern route model. The dates are the estimated ages of the fossils found in the various regions and have been reported by in Jobling et al. (2013).
Shared patterns of genetic variation in non-Africans in contrast to the high divergence of genetic variation within Africans argue against migration Out-of-Africa from multiple sampling of different source populations (Hellenthal et al. 2008; Behar et al. 2012).
Population structure in Africa
It is thought that our species Homo sapiens have emerged in Africa with the first human remains presenting modern anatomy dating up to 190kya while they are not found before 100kya in the Levant. This means that anatomically modern humans have lived almost twice as long time in Africa as outside of Africa. Genetic data show that the diversity is highest in Africa (Cann et al. 1987; Behar et al. 2008; Jakobsson et al. 2008; Li et al. 2008; Lachance et al. 2012), but also indicate that ancestral human populations in Africa were structured before any anatomically modern human population migrated out of Africa (Shimada et al. 2007; Yotova et al. 2007; Behar et al. 2008; Schlebusch et al. 2012).
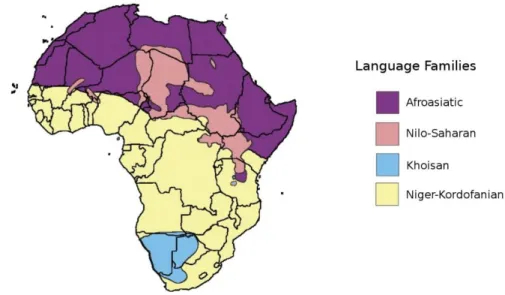
Today, Africa is extremely diverse in terms of culture and linguistics with more than 2000 ethnolinguistic groups identified (ethnologue.com). African languages can be divided in four major language families, Niger-Kordofanian, Afroasiatic, Nilo-Saharan, and Khoisan (eee figure 2 for precise geographic main repartition). Niger-Kordofanian languages are broadly spread from western Africa up to South-East and down to South Africa. The Niger-Kordofanian language family contains among others the Bantu languages. Non-Bantu Niger-Kordofanian languages are spoken in West and Central Africa, while Bantu languages are spread everywhere south of the equatorial latitudes. Afroasiatic languages are spoken in the Sahara desert, North Africa and East Africa up to the horn of Africa (Somalia). As the name suggests, Afroasiatic languages are also spoken outside of Africa in the Arabic peninsula and Near East. Nilo-Saharan languages are spoken in Central and East Africa, in the upper parts of the Chari and Nile rivers including Nubia. Last, the Khoisan language family contains all the languages that use click-consonants. They are spoken in the Kalahari desert by Khoe-San people as well as Hadza and Sandawe from East Africa, although the linguistic relatedness is debated. Khoisan languages have been previously suggested to be modern representatives of languages spoken by early anatomically modern humans (Blench 2006; Mitchell 2010), although language similarities and relationships are thought to only remain for maximum 10,000 years (Güldemann and Stoneking 2008).
Figure 2: Map of geographic repartition of language macro families in Africa
(reproduced from Scheinfeldt et al. 2010)
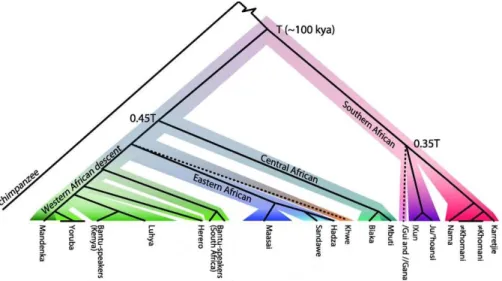
In Africa, linguistics as well as culture and lifestyle are partly correlated with geography and genetic structure (Tishkoff et al. 2009; Schlebusch et al. 2012). If we consider genetic relationships between populations as a tree (figure 3), the deepest split is between Khoe-San and the rest of African groups and dates to more than 100kya. Northern and Southern Khoe-San groups diverge from each other around 35kya. This is consistent with previous observations that Khoe-San people present high levels of diversity both within and between groups (Vigilant et al. 1991; Jorde et al. 2000; Tishkoff et al. 2009). Southern Khoe-San (Nama, Karretjie and ≠Khomani, see figure 3) are characterized by hunter-gatherer and pastoralist lifestyles, probably adopted recently, while Northern Khoe-San groups (!Xun and Ju/’hoansi, figure 3) are hunter-gatherers that supposedly kept the original lifestyle of proto Khoe-San groups (Barnard 1992).
The Central Africans represented by the pygmy hunter-gatherers from West and East Africa diverge around 60kya (Patin et al. 2009) from other West and East African groups. The divergence between Eastern and Western pygmies has been estimated around 20kya (Patin et al. 2009; Verdu et al. 2009). This Central African branch does not correspond to any language unity as Pygmy populations probably adopted languages from the neighboring populations with whom they interact. Nevertheless, some similarities in vocabulary referring to specific words related to the lifestyles suggest that there was a common proto-pygmy language (Letouzey 1976; Bahuchet 1993; Bahuchet 2012).
The next divergence time between groups is between East Africans and West Africans with a timing around 35kya. Within East African groups, the divergence between Maasai pastoralists on one hand and Hadza and Sandawe hunter-gatherers on the other hand is about 10 kya. Hadza present a hunter-gatherer lifestyle, while Sandawe shifted to a farmer lifestyle under colonial period. Hadza and Sandawe also both speak a click language (Sands 1998). The East African branch is not homogeneous in terms of languages but groups pastoralists and hunter-gatherers together.
The last branch referred to as the western African branch correlates with Niger-Kordofanian languages. The relatedness between West Africans is largely influenced by the Bantu expansion which refers to the large demographic and migratory expansion dating around 5kya from western Central Africa (current Nigeria and Cameroon) to eastern and southern Africa coincident with the emergence of agriculture.
Figure 3: Tree representation of population structure observed in Africa from
genotype data (adapted from Schlebusch et al. 2012). (We don’t consider the branching of Khwe and /Gui and //Gana in the text as it is uncertain)
As shown highly simplified here, African groups present deep divergences and very high genetic diversity probably due to the long history of modern humans in Africa. Also, African groups live in very diverse environments and present very different lifestyles among which are hunting-gathering, farming and pastoralism. The study of adaptation patterns in African groups is therefore important as the variety of environments and lifestyles probably caused different selective constraints.
Peopling of Central Asia
Due to its location, Central Asia must have played an important role during the peopling of Asia and Europe by anatomically modern humans. Nevertheless, its peopling is poorly known (Nei and Roychoudhury 1993; Comas et al. 1998; Karafet et al. 2001; Wells et al. 2001; Cordaux et al. 2004; Macaulay et al. 2005). Three models have been proposed: Central Asia could be a source region from which populations have migrated to Europe and East Asia, a well population – the late meeting region of populations from Europe and East Asia – or finally the result of an east-to-west migration from East Asia to Europe (Chaix et al. 2008). Statistical analysis of genetic data (microsatellites and sequences of autosomal regions) suggest several waves of migrations in Central Asia. An ancient migration during the Paleolithic from East to West across Eurasia. A more recent both from West and East to Central Asia around 8.5kya and later a migration from the East 2-3kya (Palstra et al. 2015).
The first historical records of Central Asia describe the Aryan invasions of the actual Turkmenistan toward Iran around 3.3kya, and the building of the Persian Empire around 2.7kya. These nomadic peoples called the Scythians were speaking Indo-Iranian languages. Later, many expansion waves came from the East around 2.2kya with the Huns. The Silk Road, which started around 2.2kya, linking East Asia to the Mediterranean basin, contributed to Central Asia being a region of great exchange and movement of people.
From 1.8-1.7kya, numerous Turkic expansion waves provoked linguistic changes in Central Asia. This event put the milestone to constant invasions from empires from West or East such as muslim invasions from Persia (between 1.4 and 1.1kya) and the Mongol Empire of Genghis Khan spreading from China to Europe (around 900ya).
All these waves of migrations have caused a high ethnic, linguistic and lifestyle diversity in Central Asia today. People speaking Indo-Iranian languages, such as Tajiks, are supposed to descend from the first Iranian people described in 3.3kya but their ancestry may even trace back to the Neolithic. Groups speaking Turkic languages, such as the Kazaks, probably settled in the region after the eastern invasions starting 1.7kya.
Lifestyle transitions in the human history
From the first Homo groups to present-day humans, diet has radically changed. Changes in diet have probably led to adaptation among hominins. Three main events might have strongly influenced the diet: the transition to meat and animal products consumption, the use of fire and the emergence of agriculture.
The consensus about the diet of hominins predating the Homo genus is that they had a diet based on fruits and leaves. Robust Australopithecus groups might have been vegetarian while the more gracile ones would include some meat in their diet (Kay 1985). Nevertheless, isotope measures suggest that some of the robust groups might also have eaten animals in small amounts as it is thought for Australopithecus africanus (Sponheimer and Lee-Thorp 1999).
The “Food for thought” theory first suggested by Aiello and Wheeler (1995) assumes that the brain is a costly organ and therefore the diet of Homo groups, characterized by an increase in brain volume, must have been omnivorous with a certain extent of meat since vegetable foods are costly to digest and detoxify. Fossil records suggest that one of the first Homo individuals from Oldowan in Ethiopia were either scavengers or hunters. Remains of accumulated animal bones (but not whole skeletons) showing cut marks of stone tools are found in the site but whether they were killed by hominins or by other predators is uncertain. Some almost complete animal skeletons suggest that hominins, if not hunters, were efficient foragers that managed to get primary access to the animal carcasses (Bunn et al. 1986; Blumenschine et al. 1987; Domínguez-Rodrigo 2002; Domínguez-Rodrigo and Pickering 2003).
Anatomically modern human developed better tools for hunting and therefore would have a higher consumption of meat than earlier Homo groups although some evidence of scavenging activity remain as well (Binford 1984). Their diet was omnivorous from a broad spectrum economy from hunting (Mitchell 2002; Klein 2009), fishing (Mitchell 2002) and gathering tubers.
The ability to use fire has deeply modified human diet and metabolism by facilitating digestion of foods and helping in detoxification (e. g. parasites and toxins). The first widely accepted evidence of the use of fire dates to 800kya in Israel (Goren-Inbar et al. 2004), 670 to 400kya in China (Weiner et al. 1998) and 600 to 400kya in Europe (Roebroeks and van Kolfschoten 1994; Gowlett 2006; Valoch 2013). The older evidence for use of fire are few because the sites observed are mostly open air sites. A greater
abundance of cave sites starting from around 130kya with evidence of fire usage confirm that, from this period on, all Homo groups could make fire when needed. Nutrition of Homo groups might have changed together with the control of fire starting around 450kya or even earlier, although the frequency at which fire was used is difficult for assess before 130kya.
The emergence of agriculture and domestication, consisting in the cultivation of soil, production of crops and raising of livestock, modified the diet and demography of many human populations. Agriculture, frequently associated with a sedentary lifestyle, appears late in the archeological record but was not developed instantaneously. For example, it has been found that hunter-gatherer groups managed the plants around their settlements. The environmental changes played a crucial role (Allaby et al. 2008) for the emergence of agriculture, which coincided with an increase and stabilization in temperature starting around 14kya.
Humans developed agriculture independently in different regions of the world at various times (Fuller et al. 2011). The first signs of agriculture are from the Fertile Crescent about 10kya, followed by Mesoamerica and the lowland South America around 9-8kya, east China (8-7kya), about 5kya for eastern woodlands of North America, Sahel/West Africa and Ethiopia, and finally spanning from 7 to 4kya in New Guinea (Denham et al. 2003; Jobling et al. 2013) (see figure 4 for locations and species domesticated).
Figure 4: Map of the centers of agricultural innovation, some species domesticated
in each regions are given as well (adapted from Jobling et al. 2013)
The most important domesticated species are the widely spread and easy to find cereals: Wheat and barley in Near East, millet and rice in China, maize in the Americas, sorghum in Africa and sugarcane in New Guinea. What constraints the locations of origins of domestication, was the domestication of crops and animals that had restricted areas of repartition.
Agriculture had a dramatic impact on the diet of the populations that adopted it. The plant and animal resources that are used by agriculturalists are much less diverse than the resources exploited by hunter-gatherer societies (Harris and Hillman 2014). Although agriculture fed more people than hunting and gathering for an equal area, malnutrition, anemia and lack in nutrients and vitamins were initially frequent (Pinhasi and Stock 2011).
Agriculture not only modified diet and lifestyle but also population growth, which led to higher disease exposure (zoonosis due to close relationship to animals, infections and parasites from increased human and animal wastes, such as plague and cholera) and fast spreading (Armelagos and Cohen 1984).
Pastoralism is another globally spread lifestyle in the world. It is a strategy to raise livestock on pastures and by doing that, to benefit also from less productive land where agriculture is not suitable. It is usually a mobile lifestyle that adapts to seasons.
The origin of pastoralism is unclear. One hypothesis is that pastoralism derived from mixed farming: the increased productivity of irrigated agriculture led to less access to water and land for the livestock. Bordering areas of land remained in use for animal breeding and large distances had to be covered by herds to collect sufficient forage. Specialization occurred as a result of the increasing importance of both intensive agriculture and pastoralism. According to this hypothesis, both agriculture and pastoralism developed together, with constant interactions (Lees and Bates 1974). Another theory is that pastoralism evolved from hunting and gathering. Following herds for hunting indeed provided a good knowledge of wild goats and sheep mobility and needs. According to this theory, undomesticated animals were chosen to become more controllable for the proto-pastoralist nomadic hunter-gatherer groups by taming and domesticating them (Marshall 1990). In this thesis, I will present the case of Central Asia.
Three hypotheses have been proposed for the emergence of pastoralism in Central Asia. Two suggest that pastoralism come from agropastoralist cultures, either from the Djeitun culture found around 8kya (Renfrew 1996), or later 6.6-4.8kya from the Kourgan culture of the Volga region (Ukraine), which spread from the Altai mountains to Bulgaria (Anthony and Brown 1991; Gimbutas and Gimbutas 1991). The third hypothesis, is in favor of a direct transition from a hunting-gathering society into pastoralism by a cultural transition of hunter-gatherers to a Kourgan-related culture. This is supported by the observation in this region of hunter-gathering cultures (Khlobystina 1973; Shilov 1975) contemporary to exclusively pastoralist
cultures (Levine 1999; Jacobson-Tepfer 2008) without sign of agriculture. This suggests that the hunter-gathering cultures adopted pastoralism from already specialized pastoralist groups.
All of these lifestyles supposedly inherited by these transitions during human evolution, still exist among contemporary human populations and probably shaped their adaptive history.
Adaptation in modern humans
Since their appearance in Africa, anatomically modern humans have peopled almost all terrestrial environments on Earth from the richest to the most extremes: from tropical to polar, rain forests to tundra and deserts and up to high altitudes. Each environment presents both resources and constrains to which human populations have adapted.
Human populations present phenotypic variations from the most conspicuous to invisible ones. It is now generally understood that phenotypic variation in humans often have a genetic basis although it is often complex and interacting with the environment, some of the phenotypic variation is adaptive. The observation of body shapes from closely related species or subpopulations of a species from different climates show that animals from cold environments tend to have larger and rounder bodies (Bergmann’s rule) and shorter limbs (Allen’s rule) to improve thermal efficiency. This tendency can be observed in human populations as well with Inuits from cold environments having a rather short stature and stocky body while the Maasai or other groups from hot and dry environments have a long stature and long limbs (Ruff 1994).
Skin color is a highly variable trait in humans and correlates with the solar exposure of human populations: darker skin is found in tropical latitudes while lighter skin appeared partly independently in northern latitudes of East Asia and Europe. Several genes have been found to be affecting skin, hair and eye pigmentation and have also been the targets of adaptation (Lamason et al. 2005; Voight et al. 2006; Miller et al. 2007; Norton et al. 2007; Williamson et al. 2007; Coop et al. 2009; Pickrell et al. 2009). A potential explanation for selection on skin color is the protection against UV in lower latitudes, as well as a better sensibility to UV for better assimilation of vitamin D in higher latitudes.
A striking example of convergent adaptation to the environment is the case of adaptation to high altitude populations living in the Andes, Himalayas and East African plateau that possess alleles preventing against complication
during pregnancy in newborns as well as providing better oxygen fixation in blood in hypoxic conditions (Moore 2001; Beall 2007; Brutsaert 2007; Alkorta-Aranburu et al. 2012).
Many examples of local adaptation in humans are explained by adaptation to diseases and diet (Barreiro et al. 2008). A famous example is the selection on alleles that are protective against malaria in regions where malaria is endemic (Hamblin and Di Rienzo 2000; Tishkoff et al. 2001).
Depending on their environment and their lifestyles, human populations have various energy expenditures. Climatic conditions, such as temperature and humidity, as well as the mobility of the lifestyle (nomadic, hunter-gatherer, sedentary farmer) influence the energy spent by the body. Different environments do not present the same resources: the biodiversities vary greatly with the distance to the equator as well as variation along a year-cycle. These factors constitute constraints for humans both for climatic and food reasons. A simple thing as the drinking water can be at the basis of local adaptation, a recent example for that is the selection on haplotypes of a gene providing better excretion of arsenic in populations of the Andes living in regions were the drinking water is rich in arsenic (Schlebusch et al. 2015). Another famous and well-studied example is the lactase persistence developing independently in populations consuming dairy products in Europe, Middle East and East Africa (Enattah et al. 2002; Tishkoff et al. 2007; Schlebusch et al. 2012). Lifestyle and diet might also have led to selection on protective alleles against diabetes both in pastoralist and farmer populations of Central Asia (Ségurel et al. 2013), and better meat digestion in pastoralists (Ségurel et al. 2010). As an effect of agriculture and high starch consumption, there is evidence of selection on copy number variation of the amylase gene, facilitating the digestion of starch, in populations with high starch diet (Perry et al. 2007).
Although there are spectacular examples of phenotypic variations caused by local adaptation in humans for which the genetic basis is known, the large majority of human phenotypic variation is still little understood. This is probably due to the complexity of biological traits, making it unlikely that selection could happen on only one or few genes. Instead, it is more likely that selection acts on several genes and on already existing genetic variation in populations, making it difficult to detect (Pritchard et al. 2010; Pritchard and Di Rienzo 2010). New methods for detecting selection or enrichment analysis of Gene-Ontologies may provide insights of adaptation in humans.
Taste and diet
In its common meaning, taste is the general sensation provided in the mouth by food. This broad definition stands for a complex combination of olfactory, somatosensory and gustatory perceptions. What strictly defines taste is all the sensations generated by the stimulation of the gustatory system by water-soluble compounds dissolved in the saliva when eating. There are five major tastes: sweet, bitter, salty, sour and umami (savory). Taste perception informs on the quality and nutritious content of potential food and is therefore essential in food choices, nutrition and survival.
Each basic taste has its importance in the diet. Sweetness, produced mostly by carbohydrates, tells us about the potential energetic aspect, it generates an innate pleasure as shown by studies of facial expression of newborns stimulated by sweet solutions (Steiner 1974). Bitterness, often generated by toxins such as alkaloids, warns against potential poisons, but also about potential medicine. Umami (Japanese word meaning “savory”) is produced by glutamate and some nucleic acids and therefore suggests high energy value (proteins) as in meat and cheese (Breslin and Spector 2008). Salty taste is produced by alkali ions, important for terrestrial animals that loose minerals through sweating and excretion. Salty taste is therefore important in regulating the mineral balance of the body (Lindemann 1996). Strong sourness is aversive and potentially revealing either unripe fruits or spoiled food, whereas mild sourness is perceived as interesting and many beverages are sour (Lindemann 1996). As an example, vitamin C, present in many fruits and essential for humans, tastes sour (Schiffman and Dackis 1975). Taste is therefore considered as a way to prevent from eating harmful food as well as a manner to look for beneficial food fulfilling the organism’s needs.
Several studies on taste receptors in various species show a coevolution of taste perception with diet. The global tendency is that, regarding the diet (frugivore, insectivore, nectarivore, carnivore, etc.), species tend to lose the tastes that are not present in their diet. We can list some interesting examples. Both domestic and wild cats as well as lions, all carnivorous, lost the ability to taste sugar after a pseudogenization of their sweet receptor. Species from the Carnivora order but presenting another diet than exclusively carnivore, have the ability to taste some sugars (Li et al. 2009). On the contrary, a high sugar diet can produce a recovery of sugar perception that has been lost in a taxa, this is the case of some nectarivore hummingbirds that perceive sweet via the originally umami receptor that has been repurposed in these species to a carbohydrate receptor (Baldwin et al. 2014). The number of bitter taste receptors in genomes also vary tremendously among vertebrates and coincide with diet of species (Dong et
al. 2009). Many other interesting examples have been subjects of studies (bats, whales etc.), and made available due to genetic sequence data.
At one stage of human evolution, the use of fire potentially caused a relaxation on bitter and sour perception because cooking helps removing noxious and poisonous substances. But a study on bitter taste receptors suggests that these receptors evolved similarly in humans as in great apes with little selective constraint (Fischer et al. 2005). Since then, humans peopled almost all terrestrial environments and adopted various lifestyles (hunting, gathering, herding, agriculture etc.) in close relationship with the characteristics of the environment they lived in. Depending on the environment in which one lives, the food resources vary as well as the potential dangers. Therefore, tastes could have evolved differentially between populations because of natural selection. Moreover, within a same environment, depending on their lifestyle (nomad, sedentary) populations present different energetic needs and explore their environment differentially.
Anthropological studies comparing populations of diverse lifestyles and environments have reported variation in taste perception across human populations. Gieli and Aka Pygmies from forest environment are less sensitive to sugars than Mvae and Yassa populations from the savanna. Fruits in a forest environment are more abundant and sweeter than in the savanna where they can even be poisonous. In savanna conditions, being more sensitive to sweet would provide a selective advantage because of a better aptitude in exploring the environment in search for highly energetic foods. Inuits from Greenland, have a high fat and high protein diet from hunting sea mammals and therefore have a high concentration of urea in the blood. To eliminate the urea, they drink high amounts of water extracted from freshwater ice and this for a great deal of the year. The choice of the ice has to be careful in order not to take in salt from the sea water. Consumption of slightly salty water in such quantities could be harmful. Interestingly, Inuits are more sensitive to salt than any other populations studied supposedly because of selection toward a greater sensitivity to salt. So depending on the environment human populations have evolved in, their tastes seem to have adapted probably at a genetic level (Hladik and Simmen 1993).
Mechanisms of taste perception in humans
Among the five senses humans can experience – vision, olfaction, hearing, taste and touching –, taste is essential for nutrition and survival.
Because of the connection between the oral and the nasal cavities, smell is also stimulated when eating. The combination in the brain of olfactory and gustatory information generate the flavor of the food (Rolls and Baylis 1994; Small and Prescott 2005). For this reason, during a cold, flavor is considerably diminished, while tastes are still perceived. In addition, the somatosensory system – detecting sensations of temperature, pain and texture – is also involved when eating mint or chili for example. Although generally included in the broader definition of taste, these sensations are perceived by different systems. In this thesis, I will use the strict definition of taste which involves the gustatory system for the perception of sweet, bitter, umami, salty and sour.
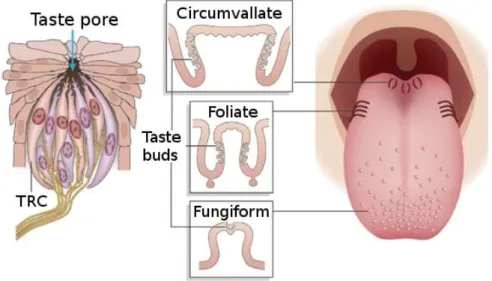
Taste sensation is mediated by taste receptor cells (TRCs) located in taste buds, themselves organized in papillae (see figure 5). Taste buds are embedded in the stratified tongue epithelium and are open to the oral cavity via a small opening in the tongue epithelium, called taste pore. Taste buds are pseudostratified and consist in several cell types: mature polarized elongated cells of type I, II & III as well as basal cells (Roper 2006). Basal cells are nonpolarized, presumably undifferentiated, whose function is supposed to be the regulation of the turnover of taste receptor cells.
Type I cells are presumed to have a role in terminating synaptic transmission and restricting the spread of transmitters and may also transduce salt taste perception (Vandenbeuch et al. 2008). Type II cells can perceive sweet, umami and bitter, each cell expresses only receptors dedicated to one taste. Type III cells, or presynaptic cells, are characterized by clear synaptic contacts with gustatory nerve fibers and therefore are thought to be responsible for information transmission to the nervous system. Type III cells also respond to sour taste stimuli and could be the receptor cells for sour taste (Chandrashekar et al. 2006; Huang et al. 2006). It is currently accepted that each cell type is tuned to detect one taste each.
Four types of papillae can be distinguished by their shape and structure: fungiform, foliate, circumvallate and filiform (Figure 5). The latter are found all over the tongue but do not contain any taste bud and therefore are not thought to be directly involved in taste perception but to have a mechanical function. The three other type of papillae do contain taste buds: fungiform papillae are located in the anterior two-third of the dorsal surface of the tongue and contain one or two taste buds, foliate papillae are on the lateral
edge of the tongue and consist in up to hundreds of taste buds, last, circumvallate papillae are found at the extreme back of the tongue and contain up to thousands of taste buds. Several nerves innervate the taste papillae. Fungiform papillae and anterior foliate papillae are innervated by the facial nerve, posterior foliate papillae and circumvallate papillae are innervated by the glossopharyngeal nerve.
Figure 5: Location and structure of taste receptor cells, taste buds and taste papillae
in the oral cavity (taken from Chandrashekar et al. 2006).
Each basic taste is mediated by a specific mechanism of signal transduction initiated by specialized taste receptors. Perception of bitter, sweet and umami tastes, the best understood, are initiated by G-protein coupled receptors (GPCR) from TAS1R and TAS2R gene families (taste 1 receptor and taste 2 receptor families). Signal transduction for bitter, sweet and umami involve gustducin, a heterodimer of G-proteins, which induces calcium release permitting the release of neurotransmitter.
Humans have 25 genes coding for TAS2R bitter receptors (Adler et al. 2000; Chandrashekar et al. 2000), located on chromosome 5, 7 and 12. The complexity of bitterness perception is permitted by the different responsiveness of each receptors to bitter compounds. Some bitter compounds are detected by a large number of TAS2Rs while some TAS2Rs can be specific to one of few chemical compounds (Meyerhof et al. 2010). Sweet and umami taste are detected by only three TAS1R receptors functioning as heterodimers: TAS1R2 and TAS1R3 bind to create sweet receptors while TAS1R1 and TAS1R3 create umami receptors (Nelson et al. 2001; Zhao et al. 2003). Humans can distinguish many sugars and
umami-tasting compounds although only three genes code for the receptors of these tastes, the mechanism for the distinction between these compounds is still unknown.
Salty and sour tastes are less understood but the best candidate for salt perception are four genes forming an amilorid-sensitive ion channel with four subunits: alpha, beta, delta and gamma (SCNN1)(Heck et al. 1984; Avenet and Lindemann 1988). The best evidence so far for sour receptor is for the PKD2L1 gene (Huang et al. 2006). Sour and salt receptors directly induce cell-depolarization and calcium release (Meyerhof 2008). Several studies show the effect of other genes on taste perception, such as the effect of RTP/REEP genes in bitter (Behrens et al. 2006) and sweet (Ilegems et al. 2010) perception. Hormones also can have an effect on taste perception, such as angiotensin on sweet and salty tastes (Shigemura et al. 2013) and leptin on sweet (Yoshida et al. 2013).
Background and methods
This thesis focuses both on demographic inference of human history and adaptation in humans. The knowledge and methods necessary to understand the results of the papers are introduced in this section.
Genetic variation
DNA is the molecular basis of genetic information and is built up as a sequence consisting of four nucleotides. The nucleotides are themselves composed of a phosphate, a deoxyribose sugar and a nitrogenous base. There are two types of nitrogenous bases, the purines: Adenine (A) and Guanine (G) and the pyrimidines: Thymine (T) and Cytosine (C).
At each generation, parental DNA is replicated and eventually transmitted to the offspring. However, several types of mutations can occur during the replication of the DNA. In this thesis I will only consider one type, single nucleotide polymorphisms. Single nucleotide polymorphisms occur when a nucleotide in the original DNA sequence is replaced by another nucleotide in the copy. There are two types of single nucleotide polymorphisms: transitions which are mutations of a purine to a purine or a pyrimidine to a pyrimidine, and transversions which are mutations of a purine to a pyrimidine or a pyrimidine to a purine. The two variants of a locus after a mutation has occurred are called alleles.
After a mutation has occurred, and if the new allele is transmitted to following generations, the mutated locus will be variable. The term polymorphism is used when at least two alleles are present in a population and it is then called a Single Nucleotide Polymorphism (SNP). The most recent allele of the two, is called the derived allele, while the original is the ancestral allele.
One of the best understood and studied regions of the DNA are the coding genes: the sequences that are transcribed and translated into proteins, the main actors within organisms. In order to translate DNA into proteins, DNA is transcribed into RNA which is then read in groups of three nucleotides at a time, the codons. Each codon is translated into a corresponding amino-acid
determined by the genetic code (table 1). The new amino-acid is joined to the previous ones to form the protein. The genetic code also gives the start and stop signal for translation. Several codons can produce the same amino-acid. When a mutation happens in a genic sequence, its position in a codon plays a key role. A mutation is synonymous if the two alleles code for the same amino-acid (CTT and CTG for example, see table 1). In such cases, the function of the gene is most often unaffected. In some cases, a mutation can have a dramatic effect if it results in premature stop-codons (substitution from TCA to TAA, see table 1) or protein-damaging missense (substitution from ATC to ACC, see table 1) alleles.
Table 1: Table of the common nuclear genetic code. The colors refer to the chemical
properties of the amino-acids yellow: nonpolar, green: polar, blue: basic, rose: acidic, and grey: stop codon.
The rate at which mutations happen depends on many factors and varies across the genome as well as between species. In humans for example the genome averaged mutation rate has been estimated to be between 10-8 and
2.5*10-8/bp/generation (Nachman and Crowell 2000; Roach et al. 2010;
Scally and Durbin 2012). This is in fact a very small rate, therefore the probability that two independent mutations happen at a same site is low. For this reason, we can approximate the mutation process with the infinite-site model (Nei and Kumar 2000): if two variants are observed at a site, it is assumed to be the result of only one mutation event. If two chromosomes present the same allele at a locus, they are “identical by state” on this locus. Because of the infinite-site assumption, identical by state is considered to be “identical by descent” for the derived allele. In other words, two
chromosomes sharing a derived allele at a locus inherited it from a common ancestor.
In species with sexual reproduction, diploid individuals produce haploid gametes, and each copy of the chromosomes are separated among the gametes. During this process, recombination between the two copies of chromosomes occurs and shuffles the chromosomes. At each generation, recombination generates chromosomes that are mosaics of the genetic material from the previous generations. Recombination increases diversity by generating new combinations of genetic material as well as, over time, breaking down the dependence of sites located on the same chromosome.
Mutation and recombination are the motors of genetic diversity in natural populations. The genetic diversity of a population is thought to be directly associated with its ability to adapt to environmental constraints. By this logic, the more diverse a population is, the more likely it will harbor alleles that can improve the fitness of their carriers in a given environment (Hartl et al. 1997).
Evolutionary forces and equilibrium models
The term population refers to a group of individuals who have a high probability to reproduce together. On operational term, this means a group of individuals that share a certain criteria such as geography, culture, lifestyle, phenotype, ancestry. In humans, it can also be determined by self-identification. For this reason, populations are not immutable and usually interconnected with each other. Biological differences between populations often reveal what is called “population structure”, which refers to a global genetic differentiation between populations due to non-random mating of individuals.
I previously presented mutation and recombination processes as the basis of genetic diversity, but these are not the only motors of evolution. The survival of gametes is a stochastic process, and some alleles might not be transmitted to the next generation, producing genetic drift. Also, populations are not isolated from each other, and individuals migrate and exchange genetic material across populations potentially introducing new genetic diversity. In addition to stochasticity and gene flow, some alleles may increase their carriers’ probability to reproduce or survive and therefore increase their chance to transmit their genetic material to the next generation. All these evolutionary forces play a role in how populations change through time, and make the study of populations’ allelic diversity complex.
In a sexually reproducing diploid species, the autosomal chromosomes are combined in pairs (one maternal and one paternal). At each locus, the maternal and paternal alleles are jointly referred to as a genotype.
Given the allele frequencies, the Hardy-Weinberg equilibrium gives the frequency of genotypes in an ideal diploid population with sexual reproduction. Such a population fulfills the following properties: no mutations and no selection occur, all individuals mate randomly, the generations do not overlap, every individuals have offspring in the same amount and the population size is infinitely large. Under these conditions, allele frequencies remain the same over generations. Each alleles of a locus will be distributed in the population among homozygous individuals (two copies of the same allele) and heterozygous individuals (one copy of each allele). For each variable locus presenting alleles “A” and “a” with respective frequency p and q, the observed frequencies or the genotypes are: AA: p2, aa: q2, aA: 2pq. The heterozygosity of a population, gives an idea of
its diversity and represents the expected fraction of heterozygous individuals in the population.
As I presented at the beginning of this section, no natural population fulfills the Hardy-Weinberg model, but it permits to measure how far from the model populations are, and in that way we can evaluate the effect of evolutionary forces.
The human genome and genetic diversity
The human nuclear genome is distributed among 22 pairs of autosomes, common to all humans and one pair of sex chromosomes, women carrying two copies of the X chromosome and men one copy of the X and one copy of the Y chromosome. Each nucleus contains one copy of the nuclear genome. The mitochondrial genome (~16.5kb) is found in mitochondria which exist in many copies in each cell. The Y chromosome is transmitted from father to sons while mitochondria are found in everyone but only transmitted from the mother to children.
In 2001, the International Human Genome Consortium released the major parts of the human genome (Lander et al. 2001). This has been a milestone for understanding human genetics, gene functions as well as human history. This reference human genome has been obtained from several individuals and its assembly is constantly improved. The haploid genome size is approximately 3.2 gigabases. The human genome differs at some loci among individuals and it is estimated that on average there is a SNP every 1250 base pair.
The structure of the human genome has been extensively studied but is still not completely understood. We can distinguish two types of sequences, the coding part (less than 2% of the genome, containing information for the generation of proteins) and the non-coding part. The estimated number of coding genes by the ENCODE consortium is between 20.000 to 25.000 (Birney et al. 2007). Human genes are highly variable in their structure and size but they usually consist in introns (non-coding) and exons (translated into proteins), with a promoter sequence, as well as enhancer sequences for the transcription. Out of these, only exons belong to the coding part of the genome.
The non-coding part of the genome can be divided into several categories: pseudogenes, genes for non-coding RNA, introns and untranslated regions of mRNA, regulatory regions (up to 40% of the genome (Stamatoyannopoulos 2012)), repetitive DNA sequences and mobile genetic elements (transposons and relics).
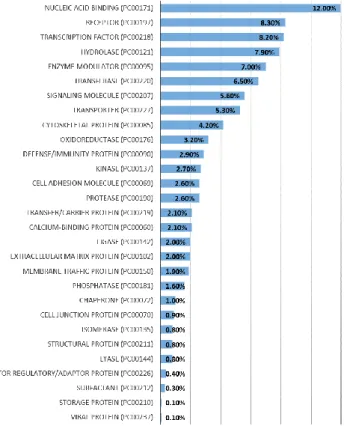
Together with the human genome project, many online tools have been developed for browsing the genome and describing gene functions. The UCSC (Kent et al. 2002) and Ensembl (Hubbard et al. 2002) genome browsers allow users to browse the genome for regions of interest. Other databases such as Gene Ontology (Ashburner et al. 2000; Gene Ontology Consortium 2015) and KEGG (Kyoto Encyclopedia of Genes and Genomes) (Kanehisa and Goto 2000) aim at classifying genes in functional sets. The PANTHER (Nikolsky and Bryant 2009) database classifies protein-coding genes into 29 functions that I display in figure 6. This classification gives an idea of the major functions and their relative importance in the genome in terms of the percentage of genes from the total number of genes in the database contained in each category. The first category is nucleic acid binding, revealing the importance of DNA handling, second comes receptors followed by transcription factors, several enzymes and signaling molecules. The “defense/immunity protein” category comes at the 11th place.
Figure 6: functional categories of human coding genes from PANTHER (Nikolsky
and Bryant 2009). The percentage represents the number of gene in each category compared to the total amount of genes in the database.
Fourteen years after the first publication of the human genome, many tools are available to access the genetic information of individuals and study the genetic diversity in populations. The capture of single base variant diversity can be easily obtained by SNP array technologies with more than 5 million variants. The access to almost complete sequences of coding genes can be performed using whole exome sequencing technology, targeting the coding sequences in the genome. Finally, the high coverage sequences of complete genomes has become more frequent and vast quantities of data is constantly being generated (Consortium 1000 Genomes Project 2010; Drmanac et al. 2010; Lachance et al. 2012; Fu et al. 2013).
This technological revolution has influenced many areas of science and health care. In population genetics, it has permitted the study of human diversity, inferring population history and detecting regions of local adaptation. These new technologies also make it possible to perform genome-wide association studies, linking phenotypes with genetic variants to improve the genetic understanding of diseases and other phenotypes.
Detecting local adaptation in populations
The survival of an individual is partly dependent on how well adapted its phenotype is to the environment. Beneficial phenotypes will increase the chance of an individual for survival and transmitting its genetic material. Deleterious phenotypes on the contrary will decrease the chance of survival and mating. Alleles at the basis of beneficial phenotypes tend to increase in frequency in the population while alleles causing deleterious phenotypes usually decrease in frequency. These phenomena are the product of natural selection. There are several ways to measure the impact of selection on the genetic diversity in order to study the adaptive history of a population.
Selection is one of the evolutionary force that will disturb the Hardy-Weinberg equilibrium described earlier, since individuals carrying a favorable variant tend to have more offspring compared to other individuals carrying the non-favorable variant. Measuring deviations from the expected under the Hardy-Weinberg equilibrium can be a way to detect selection. F-statistics (Wright 1943; Wright 1950) are measures of heterozygosity in a population as a distance from the heterozygosity expected under Hardy-Weinberg equilibrium. For example, FST measures the fraction of
heterozygosity that is between/among populations compared to the expected heterozygosity for the pooled population. Nei’s definition of FST is (Nei
1977):
is the expected heterozygosity in the whole population if it follows Hardy-Weinberg, and is the expected heterozygosity in subpopulations. If , the FST is null meaning that both populations are equally diverse,
whereas when the FST is positive showing a decrease in
heterozygosity in the subpopulation that might be due to selection.
FST reveals allele frequency differences between populations, in other words,
population structure. As selection impacts the frequency of beneficial variants in the population where it’s acting, it can increase the population allele frequency differences of selected variants. At the whole genome scale (considering all variants together), FST is a measure of genetic differentiation
between populations or structure.
Variants with a higher FST than the genome average might be due to the
effect of selection in one population, since selection might dramatically affect the allele frequency of the selected variant in the population concerned. In that logic, the outlier variants with the highest FST values over
When positive selection is acting on an allele, its frequency tends to increase in the population over time. If an allele increases rapidly in frequency, depending on the recombination rate, the frequency of the alleles next to the selected allele may also be affected. This process is called genetic hitchhiking or selective sweep. Selective sweeps leave particular patterns in the genome: unusually long haplotypes, low genetic diversity and high level of linkage disequilibrium between variants. Several statistics have been developed for detecting such signals focusing on detecting combinations of the specific patterns of selective sweeps. In this thesis, I used three statistics based on haplotypes: iHS, XP-EHH and MFPH (paper II).
iHS and XP-EHH are both based on extended haplotype homozygosity (EHH). EHH for a locus is the sum of the probabilities that two chromosomes which have the same allele at this locus, are identical by descent at other loci going further and further away from (Sabeti et al. 2006). The iHS statistic (Voight et al. 2006), is an integration of EHH, taking into account the derived/ancestral states of alleles. When iHS is negative, the selected allele is the derived allele, whereas when it is positive, the ancestral allele is selected. XP-EHH (Sabeti et al. 2007) is an extension of EHH that contrasts two population. When XP-EHH is positive, it reflects potential selection in one population, while when it is negative it reflects selection in the other population.
MFPH, which I develop in paper II, is also based on linkage disequilibrium but is looking for private haplotypes, found in only one population. Private haplotypes can be a result of population structure (figure 7), but may also reflect selective events. Population structure affects all loci equally while selection affect specific loci. The private haplotypes with the highest frequencies genome-wide, are therefore likely to represent loci that have been affected not only by population structure but also by selection. This phenomenon is illustrated in figure 7.
Figure 7: Principle behind MFPH. Population 1 and 2 evolved neutrally while
selection occurs in an allele that appeared in population 3.
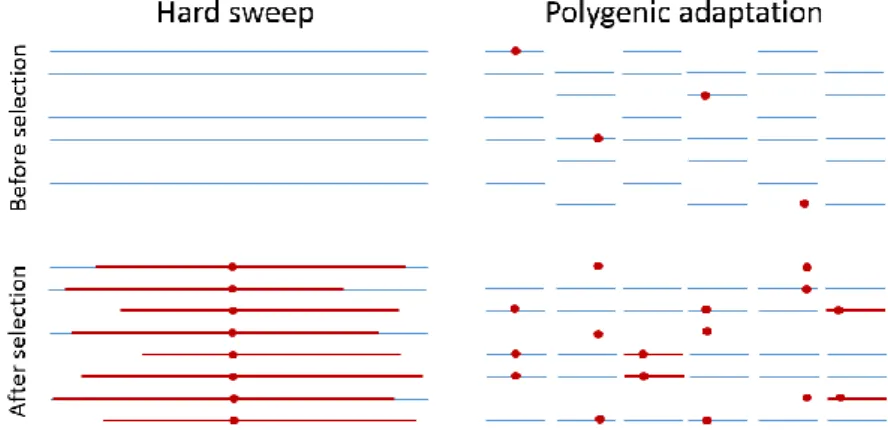
Since traits are usually complex, it is unlikely that selection on a trait is only linked to one variant of one gene. Moreover new mutations are relatively rare, and it is therefore unlikely that selection will bring them to fixation in a short time-span (unless the strength of selection is great). For these two reasons, it is more likely that selection affects several genes involved in the same trait, on pre-existing variation, this phenomenon is called polygenic selection (illustrated on figure 8) (Pritchard et al. 2010). In polygenic selection, variants existing in low frequency in the population before the selection pressure increase in frequency. New variants occurring during the selection pressure would also increase in frequency and create selective sweep patterns around them.
Figure 8: Illustration of hard sweep vs. polygenic sweep in adaptation. The blue
lines represent haplotypes, and the red lines represent regions that are identical by descent (IBD). The red circles indicate alleles that are favored following an environmental change. The figure is adapted from Pritchard et al. (2010).
Inferring human demography
Inferring past human demography is of key importance for understanding the evolution and history of our species. Evolutionary events leave footprints in the genome that can be utilized for demographic inference. Several methods have been developed to estimate demography from genetic data.
Genetic drift is a consequence of a finite population size and is a key concept in demographic inference. Importantly it is inversely proportional to population size but also depends on population structure and breeding structure among other factors. Because population size is an important determinant of genetic drift, but not the only one, the concept of effective population size has been introduced. This concept translates observed genetic drift into a population size that would result in the observed genetic drift. Genetic drift affects genetic diversity in populations and can therefore be studied if one makes assumptions of the mutational and recombinational processes.
A widely used mathematical tool in demographic inference is the coalescent. Coalescent theory studies the effect of genetic drift backward in time on the genealogy of a sample of individuals. In simple terms, the coalescent relates the distribution of mutations in a sample of individuals to demography.
In this thesis, I used a Bayesian approach to investigate bottlenecks in early modern humans. Bayesian statistical inference is a method to infer parameters of interests using Bayes’ theorem. Considering the genetic data and an evolutionary parameter , Bayes’ formula can be written as follows:
where –the posterior distribution– is the conditional distribution of a parameter given the data , –the prior distribution of the parameter– and the probability of the data given the parameter (also called the likelihood: ). In other words, the posterior distribution of a parameter is proportional to the product of the prior distribution of the parameter and the likelihood.
In human population genetics, because of the scale and complexity of the data, it is often difficult to evaluate the likelihood (Csilléry et al. 2010). It has therefore been suggested to use summary statistics to describe the data instead of using the whole data, which often has a too high dimensionality (Tavaré et al. 1997; Pritchard et al. 1999; Beaumont et al. 2002).
This method is referred to as Approximate Bayesian Computation (ABC) and is generally performed as follows:
The data is summarized using statistics that are sensitive to values of the parameters of interest (time of divergence, effective population size or migration events for example).
Models are designed to reflect knowledge of the studied population and scenarios that could explain the observed data. The parameters of interest are randomly sampled from a prior distribution. These models with the randomly chosen parameter values are then used to simulate data using a software such as ms (Hudson 2002).
The summary statistics are then computed on the simulated data. Only simulated datasets showing summary statistics that are close to the summary statistics calculated on the real data are kept (rejection algorithm).
There are two aims in performing ABC: choosing the best model and estimating the values of the parameters of interest. When several models are considered, the probability of the observed data being a product of each models, the posterior probabilities of each model, can be used to selected the most likely model (Pritchard et al. 1999; Beaumont 2008).
For the estimation of the parameters, the distribution of the parameter values kept in the simulated data is called the posterior distribution of the parameter. Posterior distributions of parameters can be corrected using heteroscedastic regression adjustment (Blum and François 2010; Csilléry et al. 2010).
In this thesis, we tested models for a putative bottleneck in early anatomically modern humans, to test the hypothesis on the origin of modern humans presented in the introduction of this thesis. Three models were considered, a model without any bottleneck, a bottleneck happening in one population, or a bottleneck happening in fragmented populations. The two latter models have been suggested to be part of human history and possibly linked to the emergence of anatomically modern humans (Lahr and Foley 1998).
Because of the time scale of the event studied, the choice of summary statistics favored statistics that have power to detect relatively old events (Sabeti et al. 2002). The mean and variance of the number of SNPs, Tajima’s D (Tajima 1989), Fu & Li’s D* (Fu and Li 1993), Fay & Wu’s H (Fay and Wu 2000) per 10kb windows were chosen as summary statistics.