ORIGINAL ARTICLE
Hypodense regions in unenhanced CT identify nonviable
myocardium: validation versus
18
F-FDG PET
Tobias A. Fuchs&Jelena R. Ghadri&Julia Stehli&
Catherine Gebhard&Egle Kazakauskaite&
Bernd Klaeser&Oliver Gaemperli&Michael Fiechter&
Philipp A. Kaufmann
Received: 4 May 2012 / Accepted: 31 July 2012 / Published online: 28 August 2012 # Springer-Verlag 2012
Abstract
Purpose The aim of the present study was to evaluate the accuracy of hypodense regions in non-contrast-enhanced cardiac computed tomography (unenhanced CT) to identify nonviable myocardial scar tissue.
Methods Hypodense areas were visually identified in unen-hanced CT of 80 patients in the left ventricular anterior, apical, septal, lateral and inferior myocardium and CT den-sity was measured in Hounsfield units (HU). Findings were compared to 18F-fluorodeoxyglucose uptake by positron emission tomography (FDG PET), which served as the standard of reference to distinguish scar (<50 % FDG up-take) from viable tissue (≥50 % upup-take).
Results Visually detected hypodense regions demonstrated a sensitivity, specificity, positive predictive value (PPV) and negative predictive value (NPV) of 74, 97, 84 and 94 %, respectively. A receiver-operating characteristic (ROC) curve analysis revealed a cutoff value of mean HU at <28.8 for predicting scar tissue with an area under the curve of 0.93 yielding a sensitivity, specificity, PPV and NPV of 94, 90, 67 and 99 %, respectively.
Conclusion Hypodense regions in unenhanced cardiac CT scans allow accurate identification of nonviable myocardial scar tissue.
Keywords Non-contrast coronary computed tomography (NCCT) . Viability . Positron emission tomography (PET) . Myocardial infarction . Computed tomography (CT)
Introduction
Non-contrast-enhanced cardiac computed tomography (unenhanced CT) is increasingly being used for attenuation correction of cardiac nuclear scans as it has been shown to improve image quality as well as diagnostic [1] and prog-nostic accuracy [2] of single photon emission computed tomography (SPECT) myocardial perfusion imaging (MPI) for the evaluation of coronary artery disease (CAD).
The use of unenhanced CT is likely to increase in the near future not only due to the joint recommendation by the Society of Nuclear Medicine and the American Society of Nuclear Cardiology [3], but also facilitated by the increasing availability of integrated SPECT/CT scanners. Similarly, the use of unenhanced CT for cardiac risk assessment by coro-nary calcium scoring is rapidly growing [4].
Unenhanced CT scans offer added diagnostic information on top of attenuation correction and coronary calcium scoring [4, 5] such as evaluation of pulmonary artery dimensions reflecting pulmonary hypertension [6], clinically relevant inci-dental findings [7,8], left ventricular (LV) mass and volume [9] and epicardial fat volume as a predictor of cardiac events [10]. A recent study has suggested a relation between hypodense myocardial areas in unenhanced CT and fixed perfusion defects on 99mTc-sestamibi SPECT [11]. However, 99m Tc-sestamibi SPECT is less accurate than 18 F-fluorodeoxyglu-cose positron emission tomography (FDG PET) for detecting
Tobias A. Fuchs and Jelena R. Ghadri contributed equally to this work as first coauthors.
Michael Fiechter and Philipp A. Kaufmann contributed equally to this work as senior coauthors.
T. A. Fuchs
:
J. R. Ghadri:
J. Stehli:
C. Gebhard:
E. Kazakauskaite
:
B. Klaeser:
O. Gaemperli:
M. Fiechter:
P. A. Kaufmann
Department of Radiology, Cardiac Imaging, University Hospital Zurich,
Ramistrasse 100, NUK C 42, 8091 Zurich, Switzerland
M. Fiechter
:
P. A. Kaufmann (*)Zurich Center for Integrative Human Physiology (ZIHP), University of Zurich,
Zurich, Switzerland e-mail: [email protected]
hypoperfused but viable myocardium with the potential for functional recovery after revascularization [12,13]. Further-more, in the latter study irreversible perfusion defects were assessed visually rather than quantitatively, which is a major limitation due to the high variability of visual assessment [12]. Therefore, the aim of the present study was to explore the accuracy of hypodense LV areas in unenhanced CT for identifying nonviable myocardial scar tissue using FDG PET as the gold standard.
Materials and methods
Study population
The study population consisted of 80 consecutive patients with angiographically proven CAD, who were referred for viability evaluation by FDG PET. All patients included in the present study routinely underwent low-dose unenhanced CT scanning for calcium scoring and/or attenuation correction of nuclear cardiac scanning. The need for written informed con-sent was waived by the Institutional Review Board (Local Ethics Committee) due to the retrospective nature of this study with solely clinical data collection.
FDG PET image acquisition and analysis
The patients were advised to fast for at least 6 h before the PET examination. After a standardized oral glucose load, 250 MBq
of FDG were injected as previously reported [14,15] accord-ing to the recommendations of the American Society of Nu-clear Cardiology [16]. One hour later images were acquired on a Discovery (LS/RX) PET/CT scanner (GE Healthcare, Mil-waukee, WI, USA). CT attenuation maps were used for atten-uation correction as previously described [17, 18]. Reconstructions of acquired images were performed by using attenuation weighted ordered subset expectation maximiza-tion iterative reconstrucmaximiza-tion (2 iteramaximiza-tions and 8 subsets).
FDG uptake polar maps were derived by using CardIQ Physio software package (GE Healthcare, AW 4.4 or 4.6). Regional FDG uptake in per cent of maximal uptake was assessed in a polar plot representing five regions, i.e. anterior, apical, septal, lateral and inferior LV wall. Nonviable tissue was defined as regions with less than 50 % FDG uptake [19]. In order to account for differences in the definition of the FDG uptake threshold to predict viability we have provided the results for different thresholds, i.e. 30, 40, 50 and 60 %.
Unenhanced CT acquisition and analysis
Unenhanced CT scans covering the whole heart were per-formed using prospective ECG-triggered sequential images as previously reported in detail [5]. Briefly, CT scans were obtained on a LightSpeed VCT scanner (General Electric Medical Systems, Milwaukee, WI, USA) or high-definition
Table 1 Patient characteristics (n080)
Characteristic Value
Age, years (mean ± SD) 64.5±12.4
Male 74 (93 %)
BMI, kg/m2(mean ± SD) 26.7±4.4
EF (%) 26.7±11.6
Cardiovascular risk factors
Hypertension 43 (54 %)
Dyslipidaemia 49 (61 %)
Smoking 48 (60 %)
Positive family history 17 (21 %)
Diabetes 21 (26 %)
History of CAD
Myocardial infarction 60 (75 %)
PCI 56 (70 %)
CABG 25 (31 %)
SD standard deviation, BMI body mass index, EF ejection fraction, CAD coronary artery disease, PCI percutaneous coronary intervention, CABG coronary artery bypass grafting
Table 3 Visual regional prediction of scar using a threshold of 50 % FDG uptake
Region Sensitivity Specificity PPV NPV
Anterior 50 % (15–85) 97 % (91–99) 50 % (15–85) 97 % (91–99) Apical 90 % (74–96) 98 % (90–100) 96 % (82–100) 94 % (85–99) Septal 71 % (47–87) 94 % (85–98) 75 % (51–90) 92 % (83–97) Lateral 67 % (30–90) 96 % (89–99) 57 % (25–84) 97 % (91–99) Inferior 56 % (33–77) 100 % (94–100) 100 % (70–100) 90 % (81–95)
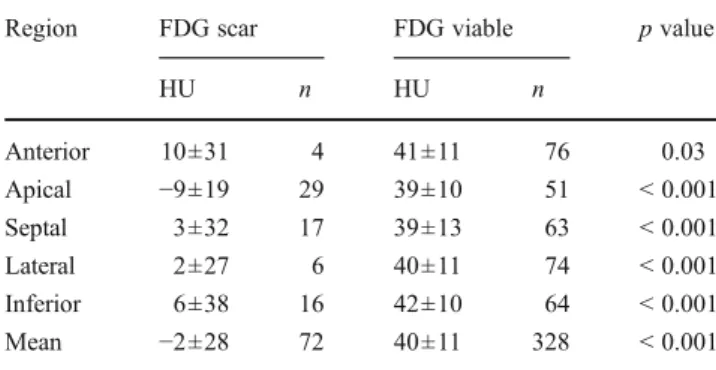
Values in parentheses indicate 95 % confidence interval PPV positive predictive value, NPV negative predictive value Table 2 Regional mean LV myocardial HU prediction of scar using a threshold of 50 % FDG uptake
Region FDG scar FDG viable p value
HU n HU n Anterior 10±31 4 41±11 76 0.03 Apical −9±19 29 39±10 51 < 0.001 Septal 3±32 17 39±13 63 < 0.001 Lateral 2±27 6 40±11 74 < 0.001 Inferior 6±38 16 42±10 64 < 0.001 Mean −2±28 72 40±11 328 < 0.001
CT scanner (Discovery HD 750, GE Healthcare) during inspi-ration breath-hold using the following parameters: detector coverage 40 mm, slice thickness 2.5 mm, rotation time 0.35 s, tube voltage of 120 kV and tube current of 200 mA. CT images were reconstructed with 5.0 mm section thickness by using a reconstruction algorithm with a 512×512 matrix. These reconstructed images were transferred to a dedicated workstation (AW 4.4 or AW 4.6 GE Healthcare) for further analysis. Using multiplanar reconstructions of axial horizontal images, long- and short-axis views were used to evaluate 5 LV regions, i.e. anterior, apical, septal, lateral and inferior LV wall from base to apex as described for FDG analysis to ensure meaningful comparison of the two techniques. Hypodense regions of the LV myocardium were visually identified and mean Hounsfield units (HU) of normal and hypodense areas were measured in anterior, apical, septal, lateral and inferior wall of LV myocardium. A standard region of interest (ROI) of 1 cm2was used for LV myocardium. For areas with small hypoattenuation, a smaller ROI was used as previously de-scribed by Gupta et al. [11].
Two blinded independent nuclear cardiologists assessed interobserver variability using Spearman’s correlation and Bland-Altman’s analysis in 100 regions from a subset of 20 patients who were randomly selected.
Statistical analysis
The statistical software package SPSS 20.0 (SPSS, Chicago, IL, USA) was used for analysis. Quantitative variables were
Fig. 1 Horizontal axis view of unenhanced CT (a) and FDG PET (b) demonstrating a thin subendocardial apical hypodense region of LV myocardium (black arrows) in unenhanced CT (a) and a nonviable apical defect in FDG PET (b). Fusion of FDG PET and non-contrast CT demonstrates a good correlation of apical nonviable defect in FDG and hypodense LV myocardial region (c)
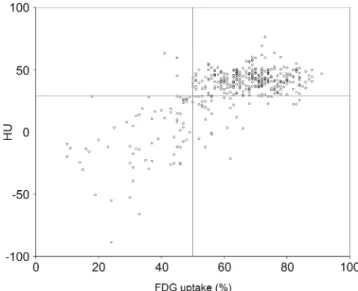
Fig. 2 Scatter plot showing distribution of HU and FDG uptake among 400 myocardial regions. The horizontal line at 28.8 HU denotes the cutoff derived from ROC analysis, and the vertical line at 50 % uptake denotes the standard of reference for FDG PET. Note that the majority of dots are located in the lower left or upper right corner, e.g.
expressed as mean ± standard deviation (SD) and categori-cal variables as frequencies or percentages. The diagnostic performance of hypodense regions as well as the cutoff threshold values of HU for optional identification of nonvi-able scar tissue was assessed with a receiver-operating char-acteristic (ROC) curve analysis. Sensitivity, specificity, positive predictive value (PPV), negative predictive value (NPV) and the area under the curve (AUC) of hypodense regions compared to the reference standard were calculated. Differences between groups were assessed, using the chi-square test for categorical variables and Mann–Whitney U test for continuous variables. A p value <0.05 was consid-ered statistically significant.
Results
Patient characteristics
All 80 patients had angiographically documented CAD, 60 (75 %) had a history of myocardial infarction (MI), 56 (70 %) a history of percutaneous coronary intervention (PCI) and 25 (31 %) had undergone coronary artery bybass graft surgery (CABG). Patient characteristics are given in Table1.
FDG PET and unenhanced CT analysis
A total of 5×80 regions were successfully analysed. FDG uptake was <50 % in 72 regions of 48 patients. Mean HU of LV myocardium in regions with FDG uptake <50 % vs ≥50 % were −2±28 HU vs 40±11 HU (p<0.001). Details
are shown in Tables2and3. The mean HU was comparable (p 0 NS) in patients with conservative treatment (−1.9± 17.9, n019), PCI only (−2.7±25.6, n036) and revasculari-zation by CABG or CABG plus PCI (0.6±37.8, n025).
Visual analysis of unenhanced CT identified 63 hypo-dense regions in 45 patients resulting in a sensitivity of 74 % [confidence interval (CI) 62–83 %], specificity of 97 % (CI 94–99 %), PPVof 84 % (CI 73–92 %) and NPVof 94 % (CI 91–97 %) to detect nonviable LV myocardium using a threshold of 50 % (Fig.1).
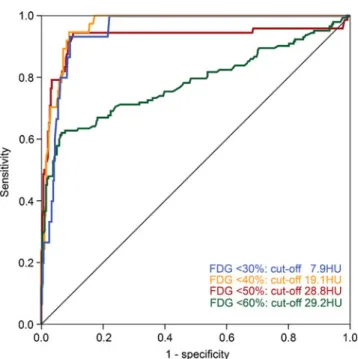
The ROC analysis of the quantitative analysis revealed a cutoff value of <28.8 HU for detecting nonviable tissue (<50 % FDG uptake) with an AUC of 0.93. Using the threshold of 28.8 HU, unenhanced CT identified 102 non-viable regions in 56 patients (Fig. 2), yielding a sensitivity of 94 % (CI 86–98 %), specificity of 90 % (CI 86–93 %), PPV of 67 % (CI 57–76 %) and NPV of 99 % (CI 97– 100 %), respectively. The respective values for all FDG uptake thresholds depicting scar (i.e. <30, <40, <50 and <60 %) are summarized in Tables 4 and 5 and illustrated in Fig.3.
Interobserver variability of CT density measurements was obtained in a subgroup of 100 regions by independent review of two blinded observers. Spearman’s correlation revealed an excellent correlation coefficient (r00.93, p< 0.001) and Bland-Altman’s analysis documents narrow lim-its of agreement (−11.95 to 12.92 HU; Fig.4).
The mean effective radiation dose from FDG was 5.02± 0.03 mSv (calculated from 251±16.3 MBq times the con-version factor 0.02 mSv/MBq [20]) and 0.9±0.1 mSv for unenhanced CT.
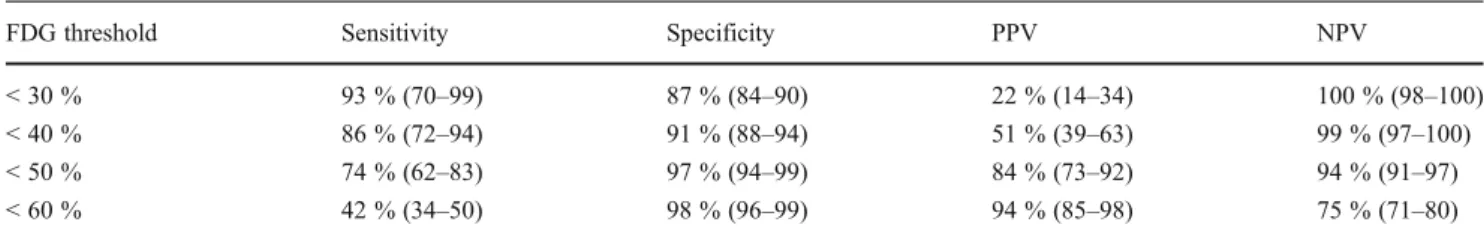
Table 4 Global accuracy of visual analysis in unenhanced CT to predict myocardial scar using different FDG thresholds
FDG threshold Sensitivity Specificity PPV NPV
< 30 % 93 % (70–99) 87 % (84–90) 22 % (14–34) 100 % (98–100)
< 40 % 86 % (72–94) 91 % (88–94) 51 % (39–63) 99 % (97–100)
< 50 % 74 % (62–83) 97 % (94–99) 84 % (73–92) 94 % (91–97)
< 60 % 42 % (34–50) 98 % (96–99) 94 % (85–98) 75 % (71–80)
Values in parentheses indicate 95 % confidence interval PPV positive predictive value, NPV negative predictive value
Table 5 Global accuracy of quantitative hypodense area analysis in unenhanced CT to predict myocardial scar using different FDG thresholds
FDG threshold Sensitivity Specificity PPV NPV AUC Cutoff
< 30 % 93 % (70–99) 91 % (87–93) 28 % (18–41) 100 % (98–100) 0.95 <7.9 HU
< 40 % 95 % (82–98) 91 % (88–94) 51 % (40–63) 99 % (98–100) 0.97 <19.1 HU
< 50 % 94 % (86–98) 90 % (86–93) 67 % (57–76) 99 % (97–100) 0.93 <28.8 HU
< 60 % 62 % (54–70) 93 % (90–96) 84 % (76–90) 82 % (77–86) 0.78 <29.2 HU
Values in parentheses indicate 95 % confidence interval
Discussion
The present results demonstrate that hypodense areas in unenhanced cardiac CT allow accurate identification of non-viable scar tissue as it shows excellent agreement with reduced myocardial FDG uptake. While contrast-enhanced CT angiography has been shown to accurately detect fixed perfusion defects or scar as areas of late enhancement com-paring well to MPI or cardiac magnetic resonance, no firm data on unenhanced CT are available using an established gold standard for viability. Our report is the first validation study documenting the accuracy of unenhanced cardiac CT for identifying nonviable myocardial scar using the well-established metabolic marker FDG. Preliminary studies
have suggested that after MI the process of ventricular remodelling including rarefaction due to fatty replacement and reduced capillary density may lead to hypoattenuation in unenhanced cardiac CT [21] and may be related to de-velopment of severe heart failure.
We have determined the optimal cutoff value for detec-tion of myocardial scar as <28.8 HU, yielding a sensitivity of 94 % and a specificity of 90 % with an excellent inter-observer agreement (r00.93, p<0.001). The latter is impor-tant in order to allow widespread use in routine clinical practice, where unenhanced cardiac CT scans are increas-ingly being used for coronary calcium scoring and/or atten-uation correction of nuclear myocardial imaging.
Although several noninvasive cardiac imaging modalities have been suggested for evaluation of viable myocardium, including cardiac MRI [15], low-dose dobutamine stress echocardiography [22] and SPECT [23], FDG PET has remained the gold standard and is the only technique evaluated in a prospective randomized outcome trial [24]. Interestingly, the findings of the present study remained consistent when using the most widely accepted thresholds of <40 % and <50 % for FDG uptake defining scar.
Accurate assessment of clinically silent MI is important for effective management as the cardiovascular event rate is as high as after clinically overt MI (45–55 % 10-year mor-tality) [25,26]. Hence, any methodological improvement for accurate MI detection is welcome, albeit its impact on patients’ outcome will require further prospective testing.
The results of the present study suggest that, besides calcium scoring, unenhanced cardiac CT scans may be used for detecting nonviable myocardial scars. In patients undergoing nuclear MPI, findings of hypodense regions may confer an added value in discriminating MI from attenuation artefact. In cases of known MI the choice of treatment strategy may rely on the accurate depiction or exclusion of viable tissue in the defect territory.
Interestingly, on the one hand, sensitivity of visual CT analysis was lower compared to the quantitative analysis. This suggests that a lower visual threshold dominates the subjective
Fig. 3 The ROC analysis of the quantitative HU measurement revealed cutoff values at <7.9, <19.1, <28.8 and <29.2 HU for detect-ing myocardial tissue <30, <40, <50 and <60 % FDG uptake with an AUC of 0.95, 0.97, 0.93 and 0.78
Fig. 4 Interobserver analysis of the mean regional HU from 100 myocardial regions in 20 patients. Spearman’s correlation reveals an excellent correlation coefficient (r00.93, p<0.001, left panel) and Bland-Altman’s analysis documents narrow limits of agreement (right panel)
interpretation of lower attenuation myocardial areas compared to the quantitative measurement of CT density units. On the other hand, the PPVof visual analysis was higher. Hence, in the presence of visible hypodense myocardial LV areas the preva-lence of myocardial viability is exceedingly rare and therefore these regions are unlikely to benefit from revascularization procedures. The highest sensitivity of unenhanced CT to detect scar tissue was found in the apex. This could be attributed to the fact that in the study population the prevalence of scar was highest in the apex, where scar was located in two thirds of patients with any scar. In addition, the HU values were lowest in the apex, possibly indicating more transmurality of apical infarction, translating into better detectability.
It may be perceived as a potential limitation of this study that neither a glucose-insulin clamp nor acipimox was used to optimize the myocardial FDG uptake. However, the oral glu-cose load method with insulin adjustments if needed is widely used and well established [27, 28]. Further, we used a 5-segment model of the polar plots of FDG instead of the classic 17-segment model. However, this was chosen to allow mean-ingful comparison with the unenhanced CT. The latter would not have allowed reliable segmentation of the left ventricle into 17 segments due to the lack of contrast signal. Moreover, in this validation study the prevalence of patients with MI was rela-tively high, while this may be lower in a population undergoing calcium scoring or evaluation of ischaemia with SPECT MPI. Indeed, lower prevalence would result in an even higher NPV to rule out nonviable tissue, which further strengthens our data. Finally, we did not use MPI to normalize FDG uptake. How-ever, this is in line with the evidence from many studies show-ing that viability is best characterized by FDG uptake, while the diagnostic role of perfusion has remained controversial [29].
In conclusion, hypodense areas in unenhanced CT accurate-ly detect nonviable LV myocardial regions as defined by FDG PET. In patients undergoing a CT scan for calcium scoring or for attenuation correction of nuclear MPI this may confer an added value for optimal subsequent patient management.
Acknowledgments The study was supported by grants from the Swiss
National Science Foundation to PAK (Grant No. 320030-127604/1) and to MF (Grant No. 323630-128868/1). Furthermore, we thank our radiol-ogist, Ennio Mueller, for his excellent technical support.
Conflicts of interest None.
References
1. Klocke FJ, Baird MG, Lorell BH, Bateman TM, Messer JV, Berman DS, et al. ACC/AHA/ASNC guidelines for the clinical use of cardiac radionuclide imaging—executive summary: a report of the American College of Cardiology/American Heart Association Task Force on Practice Guidelines (ACC/AHA/ASNC Committee to Revise the 1995 Guidelines for the Clinical Use of Cardiac Radionuclide
Imaging). J Am Coll Cardiol 2003;42(7):1318–33.
2. Pazhenkottil AP, Ghadri JR, Nkoulou RN, Wolfrum M, Buechel RR, Küest SM, et al. Improved outcome prediction by SPECT myocardial perfusion imaging after CT attenuation correction. J
Nucl Med 2011;52(2):196–200.
3. Heller GV, Links J, Bateman TM, Ziffer JA, Ficaro E, Cohen MC, et al. American Society of Nuclear Cardiology and Society of Nuclear Medicine joint position statement: attenuation correction of myocardial perfusion SPECT scintigraphy. J Nucl Cardiol 2004;11(2):229–30.
4. Schepis T, Gaemperli O, Koepfli P, Namdar M, Valenta I, Scheffel H, et al. Added value of coronary artery calcium score as an adjunct to gated SPECT for the evaluation of coronary artery disease in an intermediate-risk population. J Nucl Med 2007;48
(9):1424–30.
5. Ghadri JR, Pazhenkottil AP, Nkoulou RN, Goetti R, Buechel RR, Husmann L, et al. Very high coronary calcium score unmasks obstructive coronary artery disease in patients with normal
SPECT MPI. Heart 2011;97(12):998–1003.
6. Burger IA, Husmann L, Herzog BA, Buechel RR, Pazhenkottil AP, Ghadri JR, et al. Main pulmonary artery diameter from attenuation correction CT scans in cardiac SPECT accurately predicts pulmo-nary hypertension. J Nucl Cardiol 2011;18(4):634–41.
7. Husmann L, Tatsugami F, Aepli U, Herzog BA, Valenta I, Veit-Haibach P, et al. Prevalence of noncardiac findings on low dose 64-slice computed tomography used for attenuation correction in myocardial perfusion imaging with SPECT. Int J Cardiovasc
Imaging 2009;25(8):859–65.
8. Husmann L, Tatsugami F, Buechel RR, Pazhenkottil AP, Kaufmann PA. Incidental detection of a pulmonary adenocarcino-ma on low-dose computed tomography used for attenuation cor-rection in myocardial perfusion imaging with SPECT. Clin Nucl
Med 2010;35(9):751–2.
9. Nasir K, Katz R, Mao S, Takasu J, Bomma C, Lima JA, et al. Comparison of left ventricular size by computed tomography with magnetic resonance imaging measures of left ventricle mass and volumes: the multi-ethnic study of atherosclerosis. J Cardiovasc
Comput Tomogr 2008;2(3):141–8.
10. Cheng VY, Dey D, Tamarappoo B, Nakazato R, Gransar H, Miranda-Peats R, et al. Pericardial fat burden on ECG-gated non-contrast CT in asymptomatic patients who subsequently experi-ence adverse cardiovascular events. JACC Cardiovasc Imaging 2010;3(4):352–60.
11. Gupta M, Kadakia J, Hacioglu Y, Ahmadi N, Patel A, Choi T, et al. Non-contrast cardiac computed tomography can accurately detect chronic myocardial infarction: validation study. J Nucl Cardiol
2011;18(1):96–103.
12. Rajani R, Dey D, Berman DS. Non-enhanced cardiac computed
tomography-still an open book. J Nucl Cardiol 2011;18(1):21–3.
13. Schinkel AF, Bax JJ, Poldermans D, Elhendy A, Ferrari R, Rahimtoola SH. Hibernating myocardium: diagnosis and patient
outcomes. Curr Probl Cardiol 2007;32(7):375–410.
14. Nkoulou R, Pazhenkottil AP, Buechel RR, Husmann L, Valenta I, Herzog BA, et al. Impact of CT attenuation correction on the viability pattern assessed by 99mTc-tetrofosmin
SPECT/18F-FDG PET. Int J Cardiovasc Imaging 2011;27(6):913–21.
15. Knuesel PR, Nanz D, Wyss C, Buechi M, Kaufmann PA, von Schulthess GK, et al. Characterization of dysfunctional myocardi-um by positron emission tomography and magnetic resonance: relation to functional outcome after revascularization. Circulation 2003;108(9):1095–100.
16. Dilsizian V, Bacharach SL, Beanlands RS, Bergmann SR, Delbeke D, Gropler RJ, et al. ASNC imaging guidelines for nuclear cardi-ology procedures. PET myocardial perfusion and metabolism clin-ical imaging. J Nucl Cardiol 2009;16(4):651.
17. Koepfli P, Hany TF, Wyss CA, Namdar M, Burger C, Konstantinidis AV, et al. CT attenuation correction for myocardial
perfusion quantification using a PET/CT hybrid scanner. J Nucl
Med 2004;45(4):537–42.
18. Burkhard N, Herzog BA, Husmann L, Pazhenkottil AP, Burger IA, Buechel RR, et al. Coronary calcium score scans for attenuation correction of quantitative PET/CT 13N-ammonia myocardial per-fusion imaging. Eur J Nucl Med Mol Imaging 2010;37(3):517–21. 19. Slart RH, Bax JJ, van Veldhuisen DJ, van der Wall EE, Dierckx RA, de Boer J, et al. Prediction of functional recovery after revascularization in patients with coronary artery disease and left ventricular dysfunction by gated FDG-PET. J Nucl Cardiol
2006;13(2):210–9.
20. Johansson L, Mattsson S, Nosslin B, Leide-Svegborn S. Effective dose from radiopharmaceuticals. Eur J Nucl Med 1992;19
(11):933–8.
21. Rodríguez-Granillo GA, Rosales MA, Renes P, Diez E, Pereyra J, Gomez E, et al. Chronic myocardial infarction detection and char-acterization during coronary artery calcium scoring acquisitions. J
Cardiovasc Comput Tomogr 2010;4(2):99–107.
22. Sawada SG, Lewis SJ, Foltz J, Ando A, Khouri S, Kaser S, et al. Usefulness of rest and low-dose dobutamine wall motion scores in predicting survival and benefit from revascularization in patients with ischemic cardiomyopathy. Am J Cardiol 2002;89(7):811–6. 23. Udelson JE, Coleman PS, Metherall J, Pandian NG, Gomez AR,
Griffith JL, et al. Predicting recovery of severe regional ventricular
dysfunction. Comparison of resting scintigraphy with 201Tl and
99mTc-sestamibi. Circulation 1994;89(6):2552–61.
24. Beanlands RS, Nichol G, Huszti E, Humen D, Racine N, Freeman M, et al. F-18-fluorodeoxyglucose positron emission tomography imaging-assisted management of patients with severe left ventric-ular dysfunction and suspected coronary disease: a randomized, controlled trial (PARR-2). J Am Coll Cardiol 2007;50(20):2002– 12.
25. Yano K, MacLean CJ. The incidence and prognosis of unrecog-nized myocardial infarction in the Honolulu, Hawaii, Heart
Program. Arch Intern Med 1989;149(7):1528–32.
26. Kannel WB, Abbott RD. Incidence and prognosis of unrecognized myocardial infarction. An update on the Framingham study. N
Engl J Med 1984;311(18):1144–7.
27. Tillisch J, Brunken R, Marshall R, Schwaiger M, Mandelkern M, Phelps M, et al. Reversibility of cardiac wall-motion abnormalities predicted by positron tomography. N Engl J Med 1986;314
(14):884–8.
28. Brunken R, Schwaiger M, Grover-McKay M, Phelps ME, Tillisch J, Schelbert HR. Positron emission tomography detects tissue metabolic activity in myocardial segments with persistent thallium perfusion defects. J Am Coll Cardiol 1987;10(3):557–67. 29. Camici PG, Prasad SK, Rimoldi OE. Stunning, hibernation, and