ORIGINAL ARTICLE
Discrimination and anatomical mapping of PET-positive
lesions: comparison of CT attenuation-corrected PET images
with coregistered MR and CT images in the abdomen
Felix P. Kuhn&David W. Crook&Caecilia E. Mader&
Philippe Appenzeller&G. K. von Schulthess&
Daniel T. Schmid
Received: 28 February 2012 / Accepted: 17 August 2012 / Published online: 7 September 2012 # Springer-Verlag 2012
Abstract
Purpose PET/MR has the potential to become a powerful tool in clinical oncological imaging. The purpose of this prospective study was to evaluate the performance of a single T1-weighted (T1w) fat-suppressed unenhanced MR pulse sequence of the abdomen in comparison with unen-hanced low-dose CT images to characterize PET-positive lesions.
Methods A total of 100 oncological patients underwent se-quential whole-body18F-FDG PET with CT-based attenuation correction (AC), 40 mAs low-dose CT and two-point Dixon-based T1w 3D MRI of the abdomen in a trimodality PET/CT-MR system. PET-positive lesions were assessed by CT and MRI with regard to their anatomical location, conspicuity and additional relevant information for characterization.
Results From among 66 patients with at least one PET-positive lesion, 147 lesions were evaluated. No significant difference between MRI and CT was found regarding ana-tomical lesion localization. The MR pulse sequence used performed significantly better than CT regarding conspicu-ity of liver lesions (p<0.001, Wilcoxon signed ranks test), whereas no difference was noted for extrahepatic lesions. For overall lesion characterization, MRI was considered superior to CT in 40 % of lesions, equal to CT in 49 %, and inferior to CT in 11 %.
Conclusion Fast Dixon-based T1w MRI outperformed low-dose CT in terms of conspicuity and characterization of PET-positive liver lesions and performed similarly in extra-hepatic tumour manifestations. Hence, under the assumption that the technical issue of MR AC for whole-body PET
examinations is solved, in abdominal PET/MR imaging the replacement of low-dose CT by a single Dixon-based MR pulse sequence for anatomical lesion correlation appears to be valid and robust.
Keywords PET/MR . PET/CT . Multimodality imaging
Introduction
Integrated PET/CT systems have been successfully imple-mented in clinical workflow—particular in oncology—since their introduction approximately one decade ago [1,2]. The integration of functional and anatomical information in PET/CT with low-dose CT at 40 mAs has resulted in sig-nificant improvements in lesion localization and classifica-tion compared to PET imaging alone [2].
Recently several groups have started to study the possi-bility of replacing CT by MR in PET/MR systems. Integrat-ed PET/MR opens new perspectives in biomIntegrat-edical research and clinical multimodality imaging [3–6]. In addition to better soft tissue contrast and lack of ionizing radiation exposure, MRI offers a wide range of advanced imaging techniques [7, 8], such as apparent diffusion coefficient maps for quantification of cellular density [9], arterial spin labelling for measurement of blood flow [10], dynamic contrast enhancement to assess the characteristics of tumour vasculature, including perfusion, blood vessel permeabil-ity, blood volume and extravascular extracellular volume fraction [11], and quantification of tissue metabolite concentrations by calibrated 1H-MR spectroscopy [12,
13] or based on hyperpolarized 13C [14]. Hence, multi-parametric PET/MR has the potential to become a pow-erful tool for accurate primary diagnosis and early evaluation of therapy response.
F. P. Kuhn (*)
:
D. W. Crook:
C. E. Mader:
P. Appenzeller:
G. K. von Schulthess:
D. T. SchmidDepartment of Medical Radiology, University Hospital Zurich, CH-8091 Zurich, Switzerland
In a clinical setting the cost-effectiveness of an inte-grated multimodality scanner is of major importance [15]. Most of the advanced MR imaging techniques are time-consuming, and therefore limited to a body region of particular interest, while integrated PET/CT imaging in oncological patients typically surveys a much larger part of the body. In addition to detecting distant metastases, PET/CT can also detect second pri-mary tumours, e.g. in head and neck cancer, and has therefore a major impact on patient management [16]. Full coverage of the PET field of view (FOV) with a fast and robust MR pulse sequence is therefore neces-sary in oncology patients to provide anatomical correla-tion similar to that achieved with a low-dose CT scan [17]. Furthermore, this survey MR pulse sequence should ideally also provide data for anatomical MR-based attenuation correction (AC) of PET data equiva-lent to that provided by CT. Currently, the proposed approaches for MR AC in torso imaging are mainly based on tissue segmentation, pattern recognition tech-niques, templates or atlases [18–23]. Apart from lesions in bone [24] and in the skull [25, 26], MR AC based on such techniques has been shown to yield comparable results to CT AC of PET data.
The purpose of this prospective study was to com-pare a single T1-weighted (T1w) fat-suppressed MR pulse sequence of the abdomen without administration of contrast medium acquired in the axial plane with low-dose CT images without administration of contrast medium. The latter are acquired in our routine PET/CT protocols. Comparison was made in terms of anatomical localization, lesion conspicuity and characterization of PET-positive lesions.
Materials and methods Patient population
A total of 100 adult patients (49 men, 51 women; mean age 59 years, range 21–78 years) were enrolled in this prospec-tive study. All patients were referred for a clinical18F-FDG PET/CT examination for either staging or restaging/follow-up of various malignant tumours. Exclusion criteria were unwillingness to undergo an additional MR examination, claustrophobia, MR-incompatible medical devices (e.g. car-diac pacemaker, insulin pump, neurostimulator, cochlear implant), possible metallic fragments in the body or a body habitus (e.g. excessively obese patients) such that the patient would not have fitted into the relatively confined MR gantry due to the specially mounted surface coils (see below). This study was approved by the institutional ethics committee and written informed consent was obtained from all patients.
PET/CT and MR imaging
Sequential PET/CT and MR imaging was performed on a trimodality PET/CT-MR setup (full-ring, time-of-flight Dis-covery PET/CT 690 and a 3-T DisDis-covery MR 750; both GE Healthcare, Waukesha, WI). All patients were positioned on a shuttle board which was placed on top of either the PET/ CT table or the MR table. A mechanism able to transfer the shuttle board from one to the other table ensured that patient transport from the PET/CT to the MR system and place-ment/removal of dedicated radiofrequency (RF) coils were possible without repositioning the patient. The shuttle board had caudal space holders permitting insertion and removal of the posterior coil components without having to move the patient, but added approximately 7 cm to the table height, which resulted in a restricted AP diameter bore available for patient placement in the MR scanner. The RF coils used enabled fast and high signal-to-noise MR coverage and the special shuttle transport board enabled PET/CT scanning free of coil-induced artefacts.
PET/CT was performed according to the EANM proce-dure guidelines for tumour PET imaging [27]. Patients fasted for at least 4 h prior to injection of a standard dose of approximately 350 MBq of 18F-fluorodeoxyglucose (FDG). After a standardized uptake time of 60 min (range 58–62 min), unenhanced low-dose CT and PET emission data were acquired from the mid-thigh to the vertex of the skull. CT data were acquired in breath-hold with 50–80 mA/ slice, 120 kVp, a pitch of 0.984:1, a collimation of 64× 0.625 mm, a measured FOV of 50 cm, a noise index of 20 %, reconstructed to images of 0.625 mm transverse pixel size and 3.75 mm slice thickness. PET data was acquired in 3D time-of-flight mode with a scan duration of 2 min per bed position, an axial FOV of 153 mm and a 23 % overlap of bed positions, resulting in a total PET acquisition time of 12 min. The emission data were corrected for randoms, dead time, scatter and attenuation and iteratively reconstructed (three iterations, 18 subsets) using the CT data. After shuttle transfer to the MR system and placement of the dedicated RF coil (32 channel torso coil; GE Healthcare, Waukesha, MI) an axial two-point Dixon-based T1w 3D gradient echo sequence (LAVA-Flex; GE Healthcare) was performed and water images were reconstructed. The scanning parameters were 48 cm FOV with 80 % phase FOV, 320×256 acquisi-tion matrix, 6.8 mm slice thickness with slice overlap of 3.4 cm and a reconstructed voxel size of 1.5×1.5×3.4 mm, 3.8 ms repetition time (TR), 1.7 ms echo time (TE), 13° flip angle, 781.25 Hz pixel bandwidth, 0.7 number of excita-tions (NEX), and parallel imaging acceleration factor 2 using k-space-based autocalibrating reconstruction for Car-tesian imaging (ARC; GE Healthcare). Scan duration was 16 s for coverage of an axial FOV of 200 mm with image acquisition in breath-hold mode. The scan covered the
abdomen as well as the lower parts of the chest (two adja-cent axial FOVs). No intravenous contrast agent was admin-istered, either for the MR or the CT studies.
Image processing
The PET, CT and MR images acquired were sent to a dedicated review workstation (Advantage workstation, ver-sion 4.5; GE Healthcare, Milwaukee, WI) which allows simultaneous review of PET, CT and MR images side by side or in fused/overlay mode (PET/CT, PET/MR). Due to a fixed table height of the PET/CT and MR system and consistent laser light landmarking on the top of the longitu-dinal transfer table, no software-based image registration was necessary.
Image analysis
All images were analysed by two double board-certified nuclear medicine physicians/radiologists. The analysed axial abdominal images included the basal parts of the chest.
Detection of PET-positive lesions First, each PET examina-tion was evaluated for the presence of PET-positive lesions within the body area covered by the abdominal MRI scan. Patients without any PET-positive lesions in this area were excluded from further evaluation. Lesions were considered PET-positive if their maximum standardized uptake value (SUVmax; corrected for body weight) was at least double that of the surrounding background activity. The threshold value as percentage of SUVmax was manually adjusted for each lesion such that the borders of the volume of interest only included activity that could be ascribed to tumour. Up to eight PET-positive lesions were evaluated per patient with a maximum of three lesions per single organ/structure [28]. In patients with multiple lesions in the same organ (e.g. disseminated liver metastases), lesions that were clearly distinguishable from each other were selected for analysis. Lesions were selected in consensus to make sure that both readers evaluated the same lesions. This was done jointly by the two readers.
Image quality assessment As the next step each reader had to classify the axial CT image and the MR image section at the level of the PET-positive lesion in terms of image artefacts using a three-point scale: grade 0 (no artefacts), grade 1 (mild artefacts but still sufficient image quality for correct anatomical assignment), grade 2 (substantial artefacts with image quality insufficient for correct anatomical assignment of PET-positive lesions). This assessment was done independently by the two readers.
Anatomical assignment of PET-positive lesions Each reader individually and independently had to note the anatomical struc-ture corresponding to the PET-positive lesion based on the combination of the PET and CT data and the PET and MR data. Lesion conspicuity Lesion conspicuity was assessed based on a three-point scale: grade 0 (complete delineation), grade 1 (partial delineation), grade 2 (not detectable).
Lesion characterization Each reader had to decide if the CT or the MR scan provided more relevant information for lesion characterization in combination with the PET data. A value of 1 was assigned when the MR scan provided more relevant information than the CT scan (e.g. better delinea-tion of liver lesion extent or determinadelinea-tion of the affected liver segment not visible on the unenhanced low-dose CT scan). A value of −1 was assigned when the CT scan pro-vided more information than the MR scan (e.g. presence of air bubbles not visible on the MRI scan in a PET-positive lesion suggestive of an inflammatory process). A value of 0 was assigned when both the CT scan and the MR scan provided the same amount of information.
Lesion size As a last step, measurements of the maximum lesion diameters on CT and MR images and of the metabolic lesion volumes were obtained in consensus. Lesions not visible on the CT or MR images were not measured in that particular modality and noted as“not measurable”. Statistical analysis
All statistical tests were performed using the IBM SPSS Statistics, version 19.0, software package for Microsoft Windows. Statistical significance was assumed for p values less than 0.05. The Wilcoxon signed ranks test was used for intraobserver comparisons of lesion conspicuity ratings for CT vs. MR images and for comparisons of lesion diameter measurements on CT and MR images from the consensus reading. The Cohenκ statistic was used to evaluate interob-server agreement for anatomical assignment of PET-positive lesions and for lesion conspicuity, and for the question as to whether low-dose CT or Dixon-based MRI provided more relevant information for PET-positive lesion characteriza-tion. According to Landis and Koch [29],κ values smaller than 0.20 indicate poor agreement, and values in the ranges 0.21–0.40, 0.41–0.60, 0.61–0.80 and 0.81–1.00 indicate fair, moderate, good and very good agreement, respectively.
Results
Detection of PET-positive lesions Of the 100 patients exam-ined with sequential PET/CT and MRI, 66 (33 men, 33
women; mean age 60 years, range 21–78 years) showed at least one PET-positive lesion in the body area covered by the abdominal MRI, and were remained for further evaluation. A total of 147 PET-positive lesions were evaluated. How many patients not willing or not able to undergo an MR examination was not determined. Quantitative PET measurements yielded a median metabolic volume of 3.0 ml (range 0.2–431 ml) and a mean SUVmax of 11.9 (range 3.0–52.0). The primary malignancies in these 66 patients were lung cancer (12 patients, 18.2 %), colon cancer (11 patients, 16.7 %), pancre-atic cancer (6 patients, 9.1 %), breast cancer (5 patients, 7.6 %), Hodgkin’s lymphoma (5 patients, 7.6 %), non-Hodgkin’s lymphoma (2 patients, 3.0 %), rectal cancer (4 patients, 6.1 %), malignant melanoma (4 patients, 6.1 %), stomach cancer (3 patients, 4.5 %), pleural mesothelioma (3 patients, 4.5 %), oesophageal cancer (2 patients, 3.0 %) and gastrointestinal stromal tumour (2 patients, 3.0 %). There were also seven patients with a primary tumour located in the hypopharynx, parotid gland, thyroid, biliary tract, adrenal gland, kidney, and anus (each 1.5 %).
Image quality assessment Neither of the two readers reported substantial (grade 2) artefacts in the low-dose CT images for the corresponding image sections where the 147 PET-positive lesions were best visualized. For the corresponding MR images substantial (grade 2) artefacts were reported in 3 of 147 image sections (2.0 %) and in 1 of 147 image sections (0.7 %) by the two readers, respec-tively. The mean frequencies of mild artefacts on MR images and low-dose CT images were 19.5 % and 9 %, respectively.
Anatomical assignment of PET-positive lesions Interob-server agreement for anatomical assignment of PET-positive
lesions to a specific organ/structure was very good for PET/ CT (κ00.95) and for PET/MR (κ00.89). Furthermore, there was very good interobserver agreement between PET/CT assignments of reader 1 and PET/MR assignments of reader 2 and vice versa (κ00.93 and 0.89, respectively). Anatomical assignment remained inconclusive for three PET-positive lesions considered“not measurable” on CT images and for two lesions considered “not measurable” on MRI images, respectively.
Comparison between lesion conspicuity and lesion size The conspicuity of liver lesions was better on MR images than on CT images (n051; p<0.001, Wilcoxon signed ranks test). For lung lesions (n014), one reader found MRI to be inferior to CT (p00.046). For all other lesions no significant differences were found between MR images and CT images (Table 1). Single lesions in the breast, oesophagus, small intestine, paracolic space, spleen and peritoneum were not considered in this evaluation. Interobserver agreement on lesion conspicuity was good for CT (κ00.72) and fair for MR (κ00.46).
Morphologically measurable lesions No statistically signif-icant difference in lesion diameter was found between low-dose CT and MR images (p00.472, Wilcoxon signed ranks test). The median largest lesion diameter was 19 mm (range 5–101 mm) for CT images and 18 mm (range 4–123 mm) for MR images.
Lesions “not measurable” Of the 147 PET-positive lesions, 52 (35.4 %) and 26 (17.7 %) were not visible on low-dose CT images and MR images, respectively. These lesions were located in the following anatomical structures: liver (CT/MRI: 30/2), bone (6/9), colon (4/4),
Table 1 Intraobserver compari-son of PET-positive lesion con-spicuity on corresponding T1w fat-suppressed unenhanced MR images and unenhanced low-dose CT images
aThe sum of all lesions is greater
than 147 because lesions were compared when at least one reader indicated a lesion in a particular organ/anatomical structure in at least one modality (CT or MR). This was done to circumvent the subjective aspect of a consensus reading.
b
Wilcoxon signed ranks test; p values < 0.05 were considered significant.
Lesion location Number of lesionsa Reader 1 Reader 2
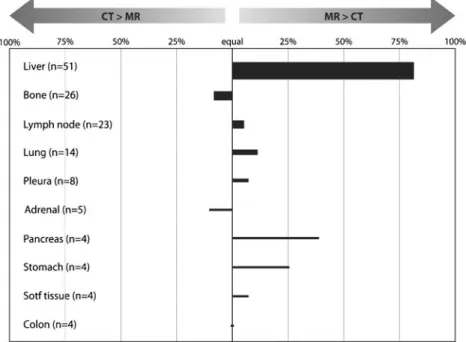
Conspicuity rating p valueb Conspicuity rating p valueb Liver 51 MR > CT <0.001 MR > CT <0.001 Bone 26 MR0 CT 0.701 MR0 CT 0.976 Lymph nodes 23 MR0 CT 0.317 MR0 CT 0.257 Lung 14 MR0 CT 0.317 MR < CT 0.046 Pleura 8 MR0 CT 0.102 MR0 CT 0.414 Soft tissue 8 MR0 CT 0.180 MR0 CT 0.317 Chest wall 6 MR0 CT 0.450 MR0 CT 0.713 Adrenal glands 5 MR0 CT 0.317 MR0 CT 0.317 Pancreas 4 MR0 CT 0.180 MR0 CT 0.317 Stomach 4 MR0 CT 0.317 MR0 CT 0.317 Colon 4 MR0 CT 1.000 MR0 CT 1.000 Unclear 4 MR0 CT 0.317 MR0 CT 0.317
stomach (4/3), pancreas (3/2), lung (1/2), adrenal gland (1/1), pleura (1/1), paracolic space (1/1), muscle (0/1), chest wall (1/0); 19 lesions (12.9 %) were not measur-able on both CT and MR images.
Interobserver comparison of lesion characterization Re-garding the question as to whether low-dose CT or MRI pro-vided more relevant information for the overall interpretation of the 147 PET-positive lesions (including anatomical location, conspicuity, infiltration of adjacent structures, additional imag-ing features helpful to increase diagnostic confidence), MRI was considered superior to CT in 40 % of the lesions, equal to CT in 49 % and inferior to CT in 11 % (mean values of the two readers). Interobserver agreement was good (κ00.70). The superiority of MRI over low-dose CT for overall interpretation of liver lesions had a major impact on these results. Considering only the 99 extrahepatic lesions, MRI was superior to CT in 20 % of the lesions, equal to CT in 65 % and inferior to CT in 15 %. The results of this evaluation are illustrated in Fig.1.
Discussion
In this study we showed that a fast axial two-point Dixon-based T1w 3D gradient echo MR sequence (LA-VA-Flex; 16 s/200 mm in breath-hold, no intravenous contrast agent) provided similar clinical information to a
nonenhanced 40-mAs low-dose CT scan with respect to anatomical mapping, lesion conspicuity and character-ization of extrahepatic abdominal PET-positive lesions. In PET-positive liver lesions coregistered PET and unen-hanced MR images outperformed unenunen-hanced PET/CT. These results are in line with those of Eiber et al. [17] who used Dixon-based MR sequences (volumetric inter-polated breath-hold examination) in comparison with a 20-mAs low-dose CT scan for anatomical correlation and delineation of PET-positive findings. However, there are important differences between the studies:
1. In the present study MR pulse sequences were compared with a 40-mAs low-dose CT scan as routinely used as a first step in PET/CT in many institutions. It was shown in the early PET/CT literature that unenhanced CT up to 40 mAs improves lesion characterization compared to PET alone, but no further improvement is achieved by increasing the mAs of the CT scan [2].
2. Our system permitted sequential PET, CT and MR image acquisition using a patient shuttle system which avoided the need for patient repositioning between the PET/CT into PET/MR systems and vice versa. For comparative image analysis the CT and the MR images were automat-ically coregistered with a single PET dataset rather than two PET datasets as are generated in studies where PET/ MR only systems are used (PET1/CT vs. PET2/MR).
Fig. 1 Average ratings of the two readers as to whether CT or MRI provided more relevant information for the anatomical localization, delineation and characterization of PET-positive lesions. The thickness of the bars indicates the number of lesions available for evaluation. Structures where fewer than four PET-positive lesions were found in total are not included in this illustration. The unexpected superiority of
MRI over CT in the lung can be explained by the fact that three patients showed mediastinal (two patients) or a chest wall (one patient) lesion or infiltration with better conspicuity on MR images, while other pulmonary lesions were visible on images of either modality. One metastatic lesion in the right adrenal was better visualized on CT than on MR images
3. Due to the small number of patients in the study by Eiber et al. [17], the number of organ-specific lesions was not high enough for statistical analysis comparing low-dose CT and Dixon-MRI. Our larger and prospective study was able to provide statistically significant information. MR image quality was found to be robust with only about 1–2 % nondiagnostic datasets. Regarding the crucial breath-hold during MR image acquisition, 16 s of breath-breath-hold seemed to be achievable by most patients. This robustness of image quality renders the applied Dixon-MR sequence also a potentially reliable sequence for MR AC based on tissue segmentation, pattern recognition techniques, templates or atlases. Both MR and CT were similar in their ability to anatomically localize PET-positive lesions. The relatively low interobserver agreement for MR lesion conspicuity was caused by diverging judgements as to whether a lesion was partly or completely delineated. Using a two-point scale in-stead (not visible vs. visible) the interobserver agreement was very good (κ00.89). A relatively high number of PET-positive lesions were considered “not measurable” on CT images (35.4 %), whereas on MRI only 17.7 % of the lesions were considered“not measurable”. Again, this difference was mainly caused by liver lesions not visible on unenhanced CT images. The better performance of MRI in liver imaging was primarily due to the high MR soft tissue contrast. This advan-tage enabled better delineation of small liver lesions as well as reliable localization of lesions to the corresponding liver seg-ment (Fig.2). Regarding the slight superiority of CT for lung
lesions it has to be noted that only PET-positive lesions were assessed. Thus, only 2 of 14 lung lesions in this evaluation were smaller than 1 cm. The mean diameter of the lung lesions on CT images was 14.6 mm (range 5–62 mm). MR tended to perform better for the determination of tumour infiltration into the chest wall or the mediastinum (Fig.3).
For the prospective detection of very small lung nodules it is generally accepted that CT performs better. However, different new imaging strategies might yield an applicable dedicated MR sequence capable of also identifying smaller lung nodules [30]. In our study CT and MRI performed similarly in charac-terizing bone lesions. However, CT enabled the evaluation of lytic bone destruction and consequently allowed better assess-ment of the fracture risk. In the future, ultrashort echo time
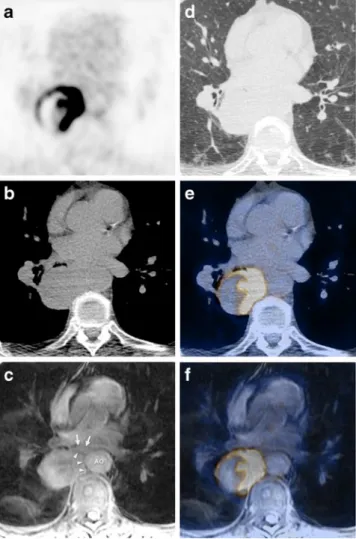
Fig. 2 A 52-year-old male patient suffering from metastasizing ma-lignant melanoma: unenhanced low-dose CT image (a), T1w fat-suppressed MR image (b), fused18F-FDG PET/CT image (c), PET/
MR image (d). In MRI melanin shortens the T1 relaxation time and therefore appears hyperintense on T1w images. This enables precise lesion delineation on MR images as seen in the liver (arrowheads), in the stomach wall (arrows) and in a coeliac lymph node (circle)
Fig. 3 A 70-year-old male patient with newly diagnosed non-small cell bronchial carcinoma in the right lower lobe referred for tumour staging: axial18F-FDG (a) image with corresponding unenhanced
low-dose CT image in soft tissue (b) and lung window (d), T1w fat-suppressed MR image (c), fused PET/CT image (e), fused PET/MR image (f). Mediastinal tumour infiltration was assumed on both the CT image (c) and MR image (d). However, in comparison with low-dose CT image (b), tumour conspicuity on the MR image (c, arrowheads) in relation to the aorta (AO) and to the oesophagus (arrows) is slightly better
sequences might be an option to gain such information using MRI [25,26]. In the delineation of lymph nodes, no tendency for better performance of MRI over CT was found. A relatively high in-plane resolution and fat suppression supported lymph node detection on MR images.
Limitations
In this study only the fat-suppressed images of the two-point Dixon MR sequence were evaluated, because our aim was to investigate the diagnostic potential of a single fast MR se-quence as a potential replacement for low-dose CT in the abdomen. Information provided by in-phase, out-of-phase and fat-only images of the Dixon MR sequence can be used as an additional benefit. Easy detection of fat replacement by tumour tissue might help distinguish benign from malignant lesions in bone, adrenal glands or liver with a higher accuracy [31].
It is important to note that the results of this study cannot be extrapolated to other body parts, i.e. chest or head and neck. The diagnostic potential of a single fast MR sequence in these regions needs evaluating in further studies. Furthermore (and as stated at the outset), on the basis of the data presented here we cannot make any statements with regard to the benefits of MR AC over CT AC, but rather assume that eventually MR AC will be possible. Finally, the access of the two readers to CT and MR images at the same time might have induced a bias to the results. However, this direct side-by-side compar-ison ensured that the same PET-positive lesions were morpho-logically characterized on the CT and MR images.
Conclusion
In this prospective study coregistered PET (using CT for PET attenuation and scatter correction) and unenhanced fast MR imaging (using a single Dixon-based MR sequence) out-performed unenhanced PET/CT with a 40 mAs low-dose CT scan for anatomical localization, conspicuity and characterization of PET-positive liver lesions. For extrahe-patic PET-positive abdominal lesions the PET and MR com-bination and the PET and CT comcom-bination were found to perform comparably, even in the basal parts of the lung, which might be the most challenging organ for MR to match CT in hybrid PET imaging. Hence, in abdominal PET im-aging the replacement of low-dose CT by a single Dixon-based MR sequence appears to be valid and robust for the assessment of PET-positive lesions. This short imaging se-quence provides the ability to survey extended body parts in times comparable to those needed for a PET survey. It may therefore become the preferred MR pulse sequence to be acquired in parallel with PET in a PET/MR scanner capable of simultaneous PET and MR data acquisition.
Acknowledgments This research project was supported by an insti-tutional research grant from GE Healthcare. The study team thanks Sabine Knoefel, Monika Kandziora and Raji Kanagasabai for their excellent technical support and P. Crandall, B. Perelman and F. Brands-berg for their continuing technical advice.
References
1. Beyer T, Townsend DW, Brun T, Kinahan PE, Charron M, Roddy R, et al. A combined PET/CT scanner for clinical oncology. J Nucl Med. 2000;41:1369–79.
2. Hany TF, Steinert HC, Goerres GW, Buck A, von Schulthess GK. PET diagnostic accuracy: improvement with in-line PET-CT sys-tem: initial results. Radiology. 2002;225:575–81.
3. Pichler BJ, Kolb A, Nagele T, Schlemmer HP. PET/MRI: paving the way for the next generation of clinical multimodality imaging applications. J Nucl Med. 2010;51:333–6. doi:10.2967/ jnumed.109.061853.
4. Wehrl HF, Judenhofer MS, Wiehr S, Pichler BJ. Pre-clinical PET/ MR: technological advances and new perspectives in biomedical research. Eur J Nucl Med Mol Imaging. 2009;36 Suppl 1:S56–68. doi:10.1007/s00259-009-1078-0.
5. Ratib O, Beyer T. Whole-body hybrid PET/MRI: ready for clinical use? Eur J Nucl Med Mol Imaging. 2011;38:992–5. doi:10.1007/ s00259-011-1790-4.
6. Herholz K, Coope D, Jackson A. Metabolic and molecular imag-ing in neuro-oncology. Lancet Neurol. 2007;6:711–24. doi:10.1016/S1474-4422(07)70192-8.
7. Gore JC, Manning HC, Quarles CC, Waddell KW, Yankeelov TE. Magnetic resonance in the era of molecular imaging of cancer. Magn Reson Imaging. 2011;29:587–600. doi:10.1016/ j.mri.2011.02.003.
8. Dhermain FG, Hau P, Lanfermann H, Jacobs AH, van den Bent MJ. Advanced MRI and PET imaging for assessment of treatment response in patients with gliomas. Lancet Neurol. 2010;9:906–20. doi:10.1016/S1474-4422(10)70181-2.
9. de Bondt RB, Hoeberigs MC, Nelemans PJ, Deserno WM, Peutz-Kootstra C, Kremer B, et al. Diagnostic accuracy and additional value of diffusion-weighted imaging for discrimination of malig-nant cervical lymph nodes in head and neck squamous cell carci-noma. Neuroradiology. 2009;51:183–92. doi: 10.1007/s00234-008-0487-2.
10. Detre JA, Rao H, Wang DJ, Chen YF, Wang Z. Applications of arterial spin labeled MRI in the brain. J Magn Reson Imaging. 2012;35:1026–37. doi:10.1002/jmri.23581.
11. Yankeelov TE, Gore JC. Dynamic contrast enhanced magnetic resonance imaging in oncology: theory, data acquisition, analysis, and examples. Curr Med Imaging Rev. 2009;3:91–107. doi:10.2174/157340507780619179.
12. Chen X, Pavan M, Heinzer-Schweizer S, Boesiger P, Henning A. Optically transmitted and inductively coupled electric reference to access in vivo concentrations for quantitative proton-decoupled (13)C magnetic resonance spectroscopy. Magn Reson Med. 2012;67:1–7. doi:10.1002/mrm.23110.
13. Pinker K, Stadlbauer A, Bogner W, Gruber S, Helbich TH. Mo-lecular imaging of cancer: MR spectroscopy and beyond. Eur J Radiol. 2012;81:566–77. doi:10.1016/j.ejrad.2010.04.028. 14. Gallagher FA, Bohndiek SE, Kettunen MI, Lewis DY, Soloviev D,
Brindle KM. Hyperpolarized 13C MRI and PET: in vivo tumor biochemistry. J Nucl Med. 2011;52:1333–6. doi:10.2967/ jnumed.110.085258.
15. von Schulthess GK, Burger C. Integrating imaging modalities: what makes sense from a workflow perspective? Eur J Nucl Med Mol Imaging. 2010;37:980–90. doi:10.1007/s00259-009-1378-4.
16. Strobel K, Haerle SK, Stoeckli SJ, Schrank M, Soyka JD, Veit-Haibach P, et al. Head and neck squamous cell carcinoma (HNSCC)–detection of synchronous primaries with (18)F-FDG-PET/CT. Eur J Nucl Med Mol Imaging. 2009;36:919– 27. doi:10.1007/s00259-009-1064-6.
17. Eiber M, Martinez-Moller A, Souvatzoglou M, Holzapfel K, Pickhard A, Loffelbein D, et al. Value of a Dixon-based MR/PET attenuation correction sequence for the localization and evaluation of PET-positive lesions. Eur J Nucl Med Mol Imaging. 2011;38:1691–701. doi:10.1007/s00259-011-1842-9.
18. Schulz V, Torres-Espallardo I, Renisch S, Hu Z, Ojha N, Bornert P, et al. Automatic, three-segment, MR-based attenuation correction for whole-body PET/MR data. Eur J Nucl Med Mol Imaging. 2011;38:138–52. doi:10.1007/s00259-010-1603-1.
19. Hofmann M, Bezrukov I, Mantlik F, Aschoff P, Steinke F, Beyer T, et al. MRI-based attenuation correction for whole-body PET/MRI: quantitative evaluation of segmentation- and atlas-based methods. J Nucl Med. 2011;52:1392–9. doi:10.2967/jnumed.110.078949. 20. Martinez-Moller A, Souvatzoglou M, Delso G, Bundschuh RA,
Chefd’hotel C, Ziegler SI, et al. Tissue classification as a potential approach for attenuation correction in whole-body PET/MRI: eval-uation with PET/CT data. J Nucl Med. 2009;50:520–6. doi:10.2967/jnumed.108.054726.
21. Hofmann M, Pichler B, Scholkopf B, Beyer T. Towards quantita-tive PET/MRI: a review of MR-based attenuation correction tech-niques. Eur J Nucl Med Mol Imaging. 2009;36 Suppl 1:S93–104. doi:10.1007/s00259-008-1007-7.
22. Beyer T, Weigert M, Quick HH, Pietrzyk U, Vogt F, Palm C, et al. MR-based attenuation correction for torso-PET/MR imaging: pit-falls in mapping MR to CT data. Eur J Nucl Med Mol Imaging. 2008;35:1142–6. doi:10.1007/s00259-008-0734-0.
23. Zaidi H. Is MR-guided attenuation correction a viable option for dual-modality PET/MR imaging? Radiology. 2007;244:639–42. doi:10.1148/radiol.2443070092.
24. Samarin A, Burger C, Wollenweber SD, Crook DW, Burger IA, Schmid DT, et al. PET/MR imaging of bone lesions– implications for PET quantification from imperfect attenuation correction. Eur J Nucl Med Mol Imaging. 2012;39:1154–60. doi: 10.1007/s00259-012-2113-0.
25. Keereman V, Fierens Y, Broux T, De Deene Y, Lonneux M, Vandenberghe S. MRI-based attenuation correction for PET/MRI using ultrashort echo time sequences. J Nucl Med. 2010;51:812–8. doi:10.2967/jnumed.109.065425.
26. Catana C, van der Kouwe A, Benner T, Michel CJ, Hamm M, Fenchel M, et al. Toward implementing an MRI-based PET attenuation-correction method for neurologic studies on the MR-PET brain prototype. J Nucl Med. 2010;51:1431–8. doi:10.2967/ jnumed.109.069112.
27. Boellaard R, O’Doherty MJ, Weber WA, Mottaghy FM, Lonsdale MN, Stroobants SG, et al. FDG PET and PET/CT: EANM proce-dure guidelines for tumour PET imaging: version 1.0. Eur J Nucl Med Mol Imaging. 2010;37:181–200. doi: 10.1007/s00259-009-1297-4.
28. Wahl RL, Jacene H, Kasamon Y, Lodge MA. From RECIST to PERCIST: evolving considerations for PET response criteria in solid tumors. J Nucl Med. 2009;50 Suppl 1:122S–50S. doi:10.2967/jnumed.108.057307.
29. Landis JR, Koch GG. The measurement of observer agreement for categorical data. Biometrics. 1977;33:159–74.
30. Bruegel M, Gaa J, Woertler K, Ganter C, Waldt S, Hillerer C, et al. MRI of the lung: value of different turbo spin-echo, single-shot turbo spin-echo, and 3D gradient-echo pulse sequences for the detection of pulmonary metastases. J Magn Reson Imaging. 2007;25:73–81. doi:10.1002/jmri.20824.
31. Erly WK, Oh ES, Outwater EK. The utility of in-phase/opposed-phase imaging in differentiating malignancy from acute benign compression fractures of the spine. AJNR Am J Neuroradiol. 2006;27:1183–8.