HAL Id: hal-00299057
https://hal.archives-ouvertes.fr/hal-00299057
Submitted on 1 Mar 2004
HAL is a multi-disciplinary open access
archive for the deposit and dissemination of
sci-entific research documents, whether they are
pub-lished or not. The documents may come from
teaching and research institutions in France or
abroad, or from public or private research centers.
L’archive ouverte pluridisciplinaire HAL, est
destinée au dépôt et à la diffusion de documents
scientifiques de niveau recherche, publiés ou non,
émanant des établissements d’enseignement et de
recherche français ou étrangers, des laboratoires
publics ou privés.
Atmospheric tide disturbances as Earthquake precursory
phenomena
D. N. Arabelos, G. Asteriadis, A. Bloutsos, M. E. Contadakis, S. D. Spatalas
To cite this version:
D. N. Arabelos, G. Asteriadis, A. Bloutsos, M. E. Contadakis, S. D. Spatalas. Atmospheric tide
disturbances as Earthquake precursory phenomena. Natural Hazards and Earth System Science,
Copernicus Publications on behalf of the European Geosciences Union, 2004, 4 (1), pp.1-7.
�hal-00299057�
SRef-ID: 1684-9981/nhess/2004-4-1
© European Geosciences Union 2004
and Earth
System Sciences
Atmospheric tide disturbances as Earthquake precursory
phenomena
D. N. Arabelos1, G. Asteriadis1, A. Bloutsos2, M. E. Contadakis1, and S. D. Spatalas1
1Department of Geodesy and Surveying, Aristotle University of Thessaloniki, Greece 2Department of Meteorology and Climatology, Aristotle University of Thessaloniki, Greece
Received: 5 May 2003 – Revised: 23 July 2003 – Accepted: 24 July 2003 – Published: 1 March 2004
Abstract. The tidal changes of the barometric pressure in the area of Thessaloniki were studied by analysing a sam-ple of 21 years of hourly measurements. The resulted tidal parameters (amplitude and phase difference) were consid-ered as “mean values” of the corresponding parameters for this long time period. Using these parameters, barometric changes were computed and subtracted from the observa-tions. Assuming that the residuals might include local (in terms of time) information,the residual time series was split in 21 blocks and a new analysis was performed for each block separately. The 21 amplitude values computed for each tidal wave were considered as the amplitude variation with respect to the correspondingmean value. An observable correlation of the amplitude exalting of the most of the tidal waves was found to Earthquakes of magnitude >4, occurred close to Thessaloniki in the test period.
1 Introduction
It is well-known that the changes in the barometric pressure influence the measurement of the gravity field and a great deal of research is directed to the determination of this influ-ence (see, Merriam, 1992).
Theoretical calculation based on mathematical models lead to a value of −0.43×10⁻⁸ms−2/hPa. In fact, litho-spheric and water surface deformations due to baromet-ric pressure changes reduce this influence to −0.2 to
−0.3×10⁻⁸ms−2/hPa (Deike, 1975).
Although the effect of the atmospheric tides is much weak-er than that of the oceanic tides, it has been found that atmo-spheric tides are mainly responsible for the noise to the de-termination of the local potential (Warburton and Goodkind, 1977). So the knowledge of the atmospheric tides at a site became of particular interest.
Correspondence to: D. N. Arabelos
(arab@eng.auth.gr)
Atmospheric tides have been a subject of extensive the-oretical and observational research during the last two cen-turies, so that today we posses an adequate theoretical expla-nation of the observed phenomena. An extensive presenta-tion of the state-of-the-art up to the recent years is given by Chapman and Lindzen (1970) while an extensive analysis of the diurnal and semidiurnal thermogravitational solar tide of the Earth atmosphere in the area of Greece was performed by Barzokas (1989).
In addition to the diurnal and semidiurnal lunisolar tidal constituents, S1, S2, M1 and M2, whom the effect on the Earth atmosphere is well documented, there are also the weaker lunisolar tidal constituent of lower frequencies, whose effect on the Earth atmosphere has not been subject to detailed research until today.
However, the marginal presence of the frequencies 0.03629 and 0.073036 cycles/day in the power spectrum of the daily measurements series of barometric pressure was detected during an investigation upon the influence of the barometric pressure and the Earth tides on the shallow under-ground water level variations in the area of Volvi, Northern Greece. These frequencies coincide with those of the Mm (period of 27.55 days) and Mf (period of 13.69 days) con-stituents of the Earth tides indicating a possible influence of the Earth tides on barometric pressure (Contadakis, 1994).
In an earlier paper (Arabelos et al., 1997) an analysis of a sample of 11.75 years of hourly measurements (103 032 val-ues) showed a clear tidal response at Sa, Ssa, S1 and S2, which corresponds to the solar annual, semiannual, diurnal and semidiurnal constituents. In the same analysis the re-sponse at P1, K1 and K2 was detectable, while the diurnal M1, semidiurnal M2 and terdiurnal M3 lunar constituents failed to be identified since the value of the corresponding signal-to-noise ratio was very low.
The present work was inspired from a recent paper pre-sented at the last EGS General Assembly (Biagi, et al., 2003). In this paper low frequency radio signals were analysed, in order to reveal exalting in atmospheric tides. The exalting found was correlated with a strong seismic crisis in Slovenia
2 D. N. Arabelos et al.: Atmospheric tide disturbances as Earthquake precursory phenomena during the following months, since the preparatory phase of
Slovenia Earthquakes could have produced such a local ex-alting of the atmospheric tides. According to the authors, the possible explanation is the following: The preparatory phase of the seismic crisis produced a diffusion of fluids in a broad area around the Earthquake epicentres. Such a diffu-sion of fluids was observed many times before Earthquakes. As a consequence, the ground density in this zone decreased, resulting in a local decrease of gravity. Due to the gravity decrease, the lower atmosphere overlying the perturbed zone expands and its density decreases. In consequence of this density decrease the local atmospheric tides can be ampli-fied.
In the present paper it was attempted to reveal exalting in atmospheric tides by analyzing barometric pressure mea-surements. A 21 years data set of hourly values was used for this analysis. In order to exclude that the atmospheric tide disturbances are due to changes of the atmospheric tempera-ture close to the Earth’s surface, the correlation between at-mospheric tides and atat-mospheric temperature was estimated using a similar data set of hourly atmospheric temperature values. A linear regression model was used for this purpose. Then the correlated part was subtracted from the original ob-servations.
The analysis of such a long period data set provided tidal parameters that could be considered as “mean values”, de-scribing the general behaviour of atmospheric tides in the area. In fact there are not considerable deviations between the estimated amplitudes in the present analysis and the cor-responding ones, found from the analysis of the 11.75 years of hourly measurements by Arabelos et al. (1997).
Using these parameters, hourly atmospheric tides were computed for the same period and subtracted from the obser-vations. Assuming that the residuals might include local (in terms of time) information, the residual data set was split in 21 blocks and a new analysis was carried out for each block separately. The 21 amplitude values computed for each tidal wave were considered as the amplitude variation with respect to the corresponding “mean value” mentioned previously.
The advantage in this procedure is that we are able to have a detailed analysis for all waves with periods from 365.2568 to 0.2588 days. On the other hand, in order to get reliable information concerning the annual waves such as Sa, it is necessary to analyse time series covering a period at least of one year. In this way, the resolution of this method is restricted. In fact, the estimation of the amplitude for the an-nual solar waves in our analysis of the yearly blocks resulted in relatively large estimation errors with respect to the corre-sponding error for the parameters of lower-period waves.
2 Observational material and model of normal poten-tial
In the present analysis the data sets used were the following: – Model of tidal potential
From the models of Normal Tidal Potential we chose that of Tamura (1987), which comprises 1200 waves. – Barometric pressure data
The atmospheric pressure has been recorded with the help of a membrane box barograph and corrected with the help of a mercury pipe barometer installed at the same place with the barograph. The accuracy of each measurement of pressure is ±0.1 hPa.
The data set includes 184 080 hourly values of the barometric pressure covering the period from 1 Jan-uary 1981 to 31 December 2001 (totally 7670 days). These values have been derived from analog recordings of the meteorologic station of the Department of Mete-orology and Climatology of the Aristotle University of Thessaloniki. The data set was used for the determina-tion of the atmospheric tidal parameters. The statistical characteristics of these values are given in Sect. 3. – Atmospheric temperature data
The atmospheric temperature was recorded with the help of a bimetallic thermograph and corrected with the help of a mercury thermometer. The accuracy of each measurement of temperature is ±0.1◦C. The hourly
val-ues of the temperature for the same period as in the sec-tion on Barometric pressure data have been used to es-timate the correlation between atmospheric temperature close to the Earth’s surface and barometric pressure at the tidal frequencies. The statistical characteristics of these values are given in Sect. 3.
– Earthquake catalogue
The catalogue of the Geodynamic Institute/National Observatory of Athens was used, compris-ing 43 128 Earthquakes from 1964 up to now, which occurred in the area bounded by 33.47◦<ϕ<42.20◦, 16.26◦<λ<30.36◦. The mag-nitude of these events varies from 1.4 to 7.
3 Analysis of the barometric measurements
In order to detect tidal signal in the changes of the barometric pressure the following analysis of the barometric measure-ments has been performed. The barometric measuremeasure-ments were compared with the normal values of the tidal potential and the residuals are used in order to estimate the tidal pa-rameters of the barometric tides through a least squares pro-cedure. These parameters can be used to predict the baromet-ric tides in the same station at any time. The method of the analysis was similar to that used for the analysis of the gravi-metric tides (e.g. Arabelos, 2002) or the ocean tides (e.g. Spatalas, 1995). There is a difference in relation to the gravi-metric tides: The corresponding measurements are usually affected by the instrumental drift. Consequently, an appro-priate filtering procedure is necessary in order to remove the drift effect from the corresponding time series. This filtering
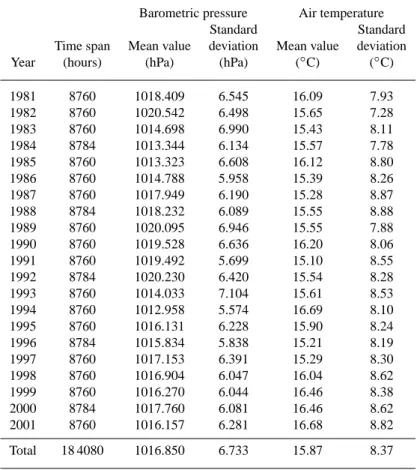
Table 1. Statistics of the barometric measurements and air temperature measurements.
Barometric pressure Air temperature
Standard Standard
Time span Mean value deviation Mean value deviation
Year (hours) (hPa) (hPa) (◦C) (◦C)
1981 8760 1018.409 6.545 16.09 7.93 1982 8760 1020.542 6.498 15.65 7.28 1983 8760 1014.698 6.990 15.43 8.11 1984 8784 1013.344 6.134 15.57 7.78 1985 8760 1013.323 6.608 16.12 8.80 1986 8760 1014.788 5.958 15.39 8.26 1987 8760 1017.949 6.190 15.28 8.87 1988 8784 1018.232 6.089 15.55 8.88 1989 8760 1020.095 6.946 15.55 7.88 1990 8760 1019.528 6.636 16.20 8.06 1991 8760 1019.492 5.699 15.10 8.55 1992 8784 1020.230 6.420 15.54 8.28 1993 8760 1014.033 7.104 15.61 8.53 1994 8760 1012.958 5.574 16.69 8.10 1995 8760 1016.131 6.228 15.90 8.24 1996 8784 1015.834 5.838 15.21 8.19 1997 8760 1017.153 6.391 15.29 8.30 1998 8760 1016.904 6.047 16.04 8.62 1999 8760 1016.270 6.044 16.46 8.38 2000 8784 1017.760 6.081 16.46 8.62 2001 8760 1016.157 6.281 16.68 8.82 Total 18 4080 1016.850 6.733 15.87 8.37
corresponds to an amplification of the tidal frequencies and an attenuation of the drift frequencies (Wenzel, 1976). Dur-ing this filterDur-ing procedure it is dangerous to interpret a part of the tidal signal as drift and vice versa. In the case of baro-metric measurements it is not necessary to take care for the estimation of the drift and the corresponding correction since the barograph is considered to be a drift-free instrument, at least for the time periods used in this analysis.
The time series covering 21 years of barometric pressure registrations enabled us to include also long period waves in the analysis. Specifically, parameters for 22 waves were estimated, covering periods from 365.2568 to 0.345 days.
A significant step in the procedure of the analysis is the test of the accuracy of the observations. For a short time period the observed signal could be approximated by the function (Wenzel, 1976)
y(t )=a1+a2t + a3t2+a4cos 15◦t + a5sin 15◦t
+a6cos 30◦t + a7sin 30◦t + a8cos 45◦t
+a9sin 45◦t. (1)
The values of the coefficients a1, . . . , a9 are defined
through an adjustment procedure substituting in Eq. (1) the values t = − 11h, . . . ,11h, t 6=0. The deviation between the observation corresponding to t = 0 and the approximation
D = L(0)− ˜y(0)=L(0)−( ¯a1+ ¯a4+ ¯a6+ ¯a8) (2)
could be used as a criterion for the existence of errors in the observations. Equation (2) describes the numerical filtering of the measurements
D =fTl L, (3)
where fT
l is the vector of the coefficients of the numerical
filter and L the vector of the observations
L(t ), t = −11, . . . , 0, . . . , 11.
Applying the above described procedure and adopting the value D = 5 hPa, a number of outliers was detected arising from digitization errors. After the correction of these values the statistics of the data is shown in Table 1.
From Table 1 it is evident that the annual standard devi-ation of the barometric pressure in Thessaloniki was almost stable during the period of the twenty one years with the ex-ception of 1986, 1991, 1994 and 1996.
The FORTRAN program ETERNA (Wenzel, 1996) has been used for the analysis. This program allows the adjust-ment of tidal parameters from either unfiltered or highpass filtered observations and the computation of the FOURIER-amplitude spectrum of the residuals. When using unfiltered observations, tidal parameters from long- to short-periodic waves may be adjusted. Also, the program computes the error estimation of the adjusted tidal parameters: (a) by a
4 D. N. Arabelos et al.: Atmospheric tide disturbances as Earthquake precursory phenomena
Table 2. Adjusted tidal parameters of the barometric field in the area of Thessaloniki, taking into account the correlation between pressure
and air temperature. Error estimation by FOURIER-spectrum of residuals. In parentheses is the error estimation by least squares method.
Period Signal-to- Amplitude Phase Difference
Waves (days) noise ratio (hPa) (degree)
Sa 365.2568 19.2(84.6) 2.538 ± 0.10 403(.01 542) 105.622 ± 2.989(2.028) Ssa 182.6217 2.4(15.7) 0.312 ± 0.01 652(.00 281) 101.832 ± 24.278(.141) MM 27.5545 3.2(23.0) 0.418 ± 0.01 456(.00 158) −18.136 ± 18.129(.115) MF 13.6608 1.9(13.7) 0.248 ± 0.00 769(.00 083) −132.482 ± 30.651(.060) MTM 9.1329 1.1 (8.4) 0.145 ± 0.04 015(.00 416) −148.640 ± 52.203(.302) Q1 1.1195 0.3 ( .2) 0.005 ± 0.00 022(.00 025) −120.018 ± 165.947(.018) O1 1.0758 1.5 (1.0) 0.020 ± 0.00 004(.00 005) −31.309 ± 37.716(.004) M1 1.0347 0.4 ( .3) 0.005 ± 0.00 054(.00 058) 122.900 ± 145.515(.042) P1 1.0027 17.4(11.5) 0.227 ± 0.00 009(.00 015) −176.446 ± 3.290(.008) S1 1.0000 113.9(43.5) 1.486 ± 0.00 386(.01 181) −46.456 ± 0.503(.576) K1 .9973 19.0(12.6) 0.248 ± 0.00 003(.00 006) 145.199 ± 3.012(.003) PSI1 .9946 4.2 (2.8) 0.055 ± 0.00 386(.00 747) 158.276 ± 13.511(.330) PHI1 .9919 3.2 (2.1) 0.041 ± 0.00 212(.00 344) 41.209 ± 18.047(.185) J1 .9624 0.9 ( .6) 0.011 ± 0.00 054(.00 062) 102.921 ± 66.658(.045) OO1 .9294 0.8 ( .7) 0.011 ± 0.00 099(.00 094) 20.827 ± 69.559(.068) 2N2 .5363 0.3 ( .1) 0.002 ± 0.00 050(.00 089) −35.769 ± 227.108(.064) N2 .5274 0.5 ( .2) 0.004 ± 0.00 008(.00 018) 141.364 ± 107.726(.013) M2 .5175 2.5 ( .8) 0.017 ± 0.00 002(.00 004) 169.438 ± 23.007(.003) L2 .5080 0.5 ( .2) 0.004 ± 0.00 055(.00 109) 42.840 ± 108.577(.079) S2 .5000 69.5(23.5) 0.464 ± 0.00 003(.00 008) −154.667 ± 0.824(.006) K2 .4986 9.0 (3.2) 0.060 ± 0.00 012(.00 027) 167.962 ± 6.358(.020) M3 .3450 0.4 ( .1) 0.002 ± 0.00 084(.00 228) 55.980 ± 137.304(.166)
least squares adjustment procedure and (b) by FOURIER-amplitude spectrum of the residuals of the adjustment, us-ing average spectral amplitudes over individual tidal bands. The last method is known to give more realistic error esti-mations, especially when adjusting simultaneously long- and short-periodic tidal parameters (Wenzel, 1976) as in our case. As it was mentioned in Sect. 1 the correlation between barometric pressure and air temperature was estimated, us-ing a linear regression model. The analysis showed a rela-tively weak correlation with a regression coefficient equal to
−0.36864 ± 0.00420 hPa/◦C being obtained. However, the last result is still significant. This was shown through the fol-lowing numerical experiment. The analysis of the entire time series was carried out in two ways: (i) ignoring the correla-tion and (ii) taking into account this correlacorrela-tion by removing from the observations the correlated part. The results showed that the waves mainly affected from the temperature are the solar Sa (15% amplitude decrease), Ssa (107% amplitude in-crease), S1 (142% amplitude increase) and S2 (21% ampli-tude increase). Significant changes also appeared in the case of the diurnal waves P1 and K1.
In Table 2 the results of the analysis of the barometric pres-sure meapres-surements for the 21 years period is shown. The correlation between barometric pressure and air temperature was taken into account and the error estimation was com-puted from the FOURIER-spectrum of the residuals. The error estimation by the least squares method is also shown in parentheses.
The standard deviation of the weight unit in this ad-justment was 0.973 hPa. There is a very good agreement with corresponding results computed from the analysis of an 11.75 years data set (Arabelos et al., 1997). This is a confir-mation that the estimated amplitudes are characteristic of the atmospheric tides in the test area.
Using the values of the tidal parameters of Table 2, the tidal changes of the barometric field during the entire period were computed and subtracted from the observations. Sub-sequently, the resulted residual data set was split in 21 blocks and a new analysis was carried out for each block separately. The computed 21 “residual amplitude” values for each tidal wave were considered as the amplitude variation of each wave, with respect to the corresponding “mean value” of Ta-ble 2.
In order to examine if these variations include some infor-mation related to the preparatory phase of seismic events, we have split the tidal waves in three groups according to their period and plotted the residual amplitudes together with the seismic events retrieved from the Earthquake catalogue men-tioned in Sect. 2. However, only the waves presenting a sig-nal to noise ratio >8 (according to least squares estimation of Table 2) were included in these plots. In Figs. 1 , 2 and 3 the annual variation of the residual amplitudes for the var-ious wave groups is shown, together with the Earthquakes of M≥4 up to a distance of 200 km from Thessaloniki. The real-time of occurrence of the Earthquakes is expressed as Ju-lian Date (J.D.) since 1980, and their focal depths are shown
-4 -3 -2 -1 0 1 2 3 A m p lit u d e (h Pa ) 730 1095 1460 1825 2190 2555 2920 3285 3650 4015 4380 4745 5110 5475 5840 6205 6570 6935 7300 7665 Time (J.D. since 1980) -4 -3 -2 -1 0 1 2 3 A m p lit u d e (h Pa ) 730 1095 1460 1825 2190 2555 2920 3285 3650 4015 4380 4745 5110 5475 5840 6205 6570 6935 7300 7665 Time (J.D. since 1980) -4 -3 -2 -1 0 1 2 3 A m p lit u d e (h Pa ) 730 1095 1460 1825 2190 2555 2920 3285 3650 4015 4380 4745 5110 5475 5840 6205 6570 6935 7300 7665 Time (J.D. since 1980) -4 -3 -2 -1 0 1 2 3 A m p lit u d e (h Pa ) 730 1095 1460 1825 2190 2555 2920 3285 3650 4015 4380 4745 5110 5475 5840 6205 6570 6935 7300 7665 Time (J.D. since 1980) 0 10 20 30 40 50 60 70 80 90 100 110 120 130 140 150 Focal_Depth Km
Fig. 1. Upper part: Annual amplitude
variation of Sa (red) and Ssa (green). Lower part: Earthquakes that occurred during the test period, up to a distance of 200 km from Thessaloniki. -4 -3 -2 -1 0 1 2 3 D is ta n ce fr o m T h es sa lo n ik i ( K m x 5 0) A m p lit u d e (h Pa ) 730 1095 1460 1825 2190 2555 2920 3285 3650 4015 4380 4745 5110 5475 5840 6205 6570 6935 7300 7665 Time (J.D. since 1980) -4 -3 -2 -1 0 1 2 3 D is ta n ce fr o m T h es sa lo n ik i ( K m x 5 0) A m p lit u d e (h Pa ) 730 1095 1460 1825 2190 2555 2920 3285 3650 4015 4380 4745 5110 5475 5840 6205 6570 6935 7300 7665 Time (J.D. since 1980) -4 -3 -2 -1 0 1 2 3 D is ta n ce fr o m T h es sa lo n ik i ( K m x 5 0) A m p lit u d e (h Pa ) 730 1095 1460 1825 2190 2555 2920 3285 3650 4015 4380 4745 5110 5475 5840 6205 6570 6935 7300 7665 Time (J.D. since 1980) -4 -3 -2 -1 0 1 2 3 D is ta n ce fr o m T h es sa lo n ik i ( K m x 5 0) A m p lit u d e (h Pa ) 730 1095 1460 1825 2190 2555 2920 3285 3650 4015 4380 4745 5110 5475 5840 6205 6570 6935 7300 7665 Time (J.D. since 1980) -4 -3 -2 -1 0 1 2 3 D is ta n ce fr o m T h es sa lo n ik i ( K m x 5 0) A m p lit u d e (h Pa ) 730 1095 1460 1825 2190 2555 2920 3285 3650 4015 4380 4745 5110 5475 5840 6205 6570 6935 7300 7665 Time (J.D. since 1980) 0 10 20 30 40 50 60 70 80 90 100 110 120 130 140 150 Focal_Depth Km
Fig. 2. Upper part: Annual amplitude
variation of Mm (red), Mf (magentda)
and Mtm(blue). Lower part:
Earth-quakes that occurred during the test pe-riod, up to a distance of 200 km from Thessaloniki.
through the coloured scale. The magnitude of the Earthquake is expressed by the radius of the corresponding circle.
However, there is a problem in comparing a single ampli-tude value computed from the analysis of a year-long time series with the flowing, real-time occurrence of the seismic events. This problem is more serious in the case of the annual waves, because here it is necessary to analyze observations of at least one year in duration. A possible solution might be to present monthly release of energy, instead of just Earthquake count. But in the time period considered, there are only few Earthquakes with M≥5. In Figs. 1, 2 and 3 the computed an-nual amplitudes were plotted at the beginning of each year.
In Figs. 1, 2 and 3 it is shown that the amplitudes of Sa and Ssa waves present an increase correlated with most of the Earthquakes that occurred near Thessaloniki, with some exceptions. It is characteristic the exalting of both waves in the case of the seismic sequence close to J.D. 2920. However, there are cases such as the seismic sequence at the end of J.D. 7665, where the amplitude of Ssa was increased, while the amplitude of Sa was decreased. But it should be mentioned again, that the accuracy estimation of the Sa amplitudes is relatively lower than the accuracy estimation for the other waves, as it was explained in Sect. 1.
6 D. N. Arabelos et al.: Atmospheric tide disturbances as Earthquake precursory phenomena -4 -3 -2 -1 0 1 2 3 D is ta n ce fr o m T h es sa lo n ik i ( K m x 5 0) A m p lit u d e (h Pa ) 730 1095 1460 1825 2190 2555 2920 3285 3650 4015 4380 4745 5110 5475 5840 6205 6570 6935 7300 7665 Time (J.D. since 1980) -4 -3 -2 -1 0 1 2 3 D is ta n ce fr o m T h es sa lo n ik i ( K m x 5 0) A m p lit u d e (h Pa ) 730 1095 1460 1825 2190 2555 2920 3285 3650 4015 4380 4745 5110 5475 5840 6205 6570 6935 7300 7665 Time (J.D. since 1980) -4 -3 -2 -1 0 1 2 3 D is ta n ce fr o m T h es sa lo n ik i ( K m x 5 0) A m p lit u d e (h Pa ) 730 1095 1460 1825 2190 2555 2920 3285 3650 4015 4380 4745 5110 5475 5840 6205 6570 6935 7300 7665 Time (J.D. since 1980) -4 -3 -2 -1 0 1 2 3 D is ta n ce fr o m T h es sa lo n ik i ( K m x 5 0) A m p lit u d e (h Pa ) 730 1095 1460 1825 2190 2555 2920 3285 3650 4015 4380 4745 5110 5475 5840 6205 6570 6935 7300 7665 Time (J.D. since 1980) 0 10 20 30 40 50 60 70 80 90 100 110 120 130 140 150 Focal_Depth Km
Fig. 3. Upper part: Annual amplitude
variation of S1 (red) and S2 (green). Lower part: Earthquakes that occurred during the test period, up to a distance of 200 km from Thessaloniki.
The situation in the case of the moon-monthly, semi-monthly and ter-monthly waves is rather confusing (see Fig. 2). In both cases of Figs. 1 and 2 exalting is shown in the period from about J.D. 5290 to 6570, without the occurrence of any Earthquakes, at least close to Thessaloniki.
More clear is the behaviour of the S1 amplitude (Fig. 3) presenting a systematic increase before the most of the Earth-quakes, with a very few exceptions. On the other hand, the amplitude of the semi-diurnal solar constituents does not show any correlation with the seismic events, even for those occurred very close to Thessaloniki.
4 Conclusions
The tidal analysis of the twenty one years of hourly baromet-ric pressure measurements, showed a clear tidal response at Sa, Ssa, S1 and S2, and a detectable response at P1, K1 and K2 constituents. In the same analysis, the response of the lunar Mm, Mf and Mtm is marginal, while the lunar diurnal M1, semidiurnal M2 and terdiurnal M3 failed to be identi-fied. The results of this analysis agree very well with the results of an earlier analysis of a sample of 11.75 years. This is a confirmation that the estimated amplitude and phase dif-ference parameters of the atmospheric tides are characteristic for the area of Thessaloniki.
An attempt to estimate the correlation between barometric pressure and air temperature using a linear regression model resulted in the estimation of a correlation coefficient equal to
−0.36864 ± 0.0042 hPa. The correlated part was subtracted from the original observations, leading in the estimation of tidal parameters independent from the air temperature varia-tions.
The analysis of the residual signal separated in one-year blocks, showed considerable amplitude variations that might include information related to other phenomena, such as Earthquakes. A preliminary attempt in this direction showed that in many cases, an amplitude exalting of some waves may precede an Earthquake close to the test area. Such a behaviour is more evident in the case of S1, but is also ob-servable in the case of Sa and Ssa. However, this does not prove the existence of a relationship between atmospheric tide disturbances and Earthquakes. It merely demonstrates that such a relationship cannot be ruled out, at least without additional meticulous research.
A more detailed analysis aiming to the estimation of pa-rameters from blocks covering shorter time intervals could be very helpful in concluding if the exalting of the tidal waves could be considered as Earthquake precursors.
Acknowledgements. The latest version of Wenzel’s FORTRAN
program ETERNA was kindly supplied by ICET. Edited by: M. E. Contadakis
Reviewed by: P. F. Biagi and A. Tzanis
References
Arabelos, D., Asteriadis, G., Contadakis, M. E., Spatalas S. D., and Sachsamanoglou, H.: Atmospheric tides in the area of Thessa-loniki, J. Geodynamics, 23, 65–75, 1997.
Arabelos, D.: Comparison of Earth-tide parameters over a large lat-itude difference, Geoph. J. Int., 151, 950–956, 2002.
Bartzokas, A.: Dynamical factors influencing the daily barometric fluctuation in the vicinity of the ground, in the area of Greece, Ph. Dr. Thesis, University of Ioannena, Greece, 208, 1989.
Bartzokas A., Repapis, C. C., and Metaxas, D. A.: Temporal Vari-ations of Atmospheric Tides over Athens, Meteorol. Atmos. Phys., 55, 113–123, 1995.
Biagi, P. F., Piccolo, R., Capozzi, V., Ermini, A., Martellucci, S., and Ballecci, C.: Exalting in atmospheric tides as Earthquake precursor, Natural Hazards and Earth System Sciences, 3(3/4), 197–201, 2003.
Burrage, M. D., Hays, P. B., Skinner, W. R., Hagan, M. E., and Wu, D. L.: Long-term variability in the solar diurnal tide ob-served by HRDI and simulated by the GSWM, GRL, 22(19), 2641–2644, 1995.
Chapman, S. and Lindzen, R. S.: Atmospheric Tides, Dortrecht-Holland, Reidel, D., 200, 1970.
Contadakis, M. E.: On the influence of non tectonic factors upon the shallow underground water level variations, Proceedings of the European Seismological Commission 2nd Workshop on Statisti-cal Models and Methods in Seismology, Applications on Preven-tion and Forecasting of Earthquakes, Cephalonia 2–5 June 1993, 42–48, 1994.
Deike, N.: Einfluss von Luftdruck und Lufttemperatur auf die Mes-sung von Schwereunterschieden, Diplomarbeit (not published), Institut f¨ur Theoretische Geod¨asie der TU Hannover, Hannover, 1975.
Haurwitz, B. and Cowley, A. D.: The lunar barometric tide,its global distribution and annual variation, PAGEOPH, 75, 1–29, 1970.
Haurwitz, B. and Cowley, A. D.: The diurnal and semidiurnal barometric oscillations global distribution and annual variation, PAGEOPH, 102(1), 193–222, 1973.
Hsu, H.-H. and Hoskins B.: Tidal fluctuations as seen in ECMWF data, Q. J. R. Meteorol. Soc., 115, 247–264, 1989.
Merriam, J. B.: Atmospheric pressure and gravity, Geophys. J. Int., 109(3), 488–500, 1992.
Spatalas, S. D.: The effect of different instrumental errors and the sea-tides on astrogeodetic observations, Dissertation (in Greek), Thessaloniki, Greece, 1995.
Tamura, Y.: A Harmonic development of the Tide Generating Po-tential, Bull. Inf. Mar´ees Terrestres, 99, 6813–6855, 1987. Warburton, R. J. and Goodkind, J. M.: The influence of
barometric-pressure variations on gravity, Geophys. J. R. Astr. Soc., 48, 281– 292, 1977.
Wenzel, H.-G.: Zur Genauigkeit von gravimetrischen Erdgezeit-enbeobachtungen, Wissenschaftliche Arbeiten der Lehrst¨ule f¨ur Geodesie, Photogrametrie und Kartographie an der Technischen Universit¨at Hannover Nr. 67, Hannover, 1976.
Wenzel, H.-G.: The nanogal software: Earth tide data processing package ETERNA, Bull. Inf. Mar´ees Terrestres, 99, 9425–9439, 1996.