Zsolt Szucs-Farkas Michael A. Patak Seyran Yuksel-Hatz Thomas Ruder Peter Vock Received: 5 May 2009 Revised: 1 September 2009 Accepted: 11 September 2009 Published online: 21 November 2009 # European Society of Radiology 2009
Improved detection of pulmonary nodules
on energy-subtracted chest radiographs
with a commercial computer-aided diagnosis
software: comparison with human observers
Abstract Objective: To retrospec-tively analyze the performance of a commercial computer-aided diagnosis (CAD) software in the detection of pulmonary nodules in original and energy-subtracted (ES) chest radio-graphs. Methods: Original and ES chest radiographs of 58 patients with 105 pulmonary nodules measuring 5– 30 mm and images of 25 control subjects with no nodules were rando-mized. Five blinded readers evaluated firstly the original postero-anterior images alone and then together with the subtracted radiographs. In a sec-ond phase, original and ES images were analyzed by a commercial CAD program. CT was used as reference standard. CAD results were compared to the readers’ findings. True-positive (TP) and false-positive (FP) findings with CAD on subtracted and non-subtracted images were compared. Results: Depending on the reader’s
experience, CAD detected between 11 and 21 nodules missed by readers. Human observers found three to 16 lesions missed by the CAD software. CAD used with ES images produced significantly fewer FPs than with non-subtracted images: 1.75 and 2.14 FPs per image, respectively (p=0.029). The difference for the TP nodules was not significant (40 nodules on ES images and 34 lesions in non-subtracted radiographs, p=0.142). Conclusion: CAD can improve lesion detection both on energy subtracted and non-subtracted chest images, especially for less experi-enced readers. The CAD program marked less FPs on energy-subtracted images than on original chest
radiographs.
Keywords Pulmonary nodule . Radiography . Energy subtraction . Chest . Computer aided diagnosis
Introduction
Even in the era of low-dose chest computed tomography (CT) for lung cancer screening, chest radiography remains the primary investigation to exclude pulmonary nodules in many countries due to its easy application, low cost and radiation dose [1,2]. The overlay of bones and soft tissue structures, such as mediastinum, pulmonary vessels and diaphragm, is a well-known drawback of summation chest radiography that significantly hampers the recognition of lung lesions. Dual-energy radiography with energy sub-traction (ES) has been developed to produce soft tissue images of the chest and, thus, to eliminate or reduce the
disturbing effects of the ribs and the clavicles. Though the method has been shown to improve the detection rate and diagnostic confidence for both calcified and non-calcified lung nodules, it can also increase the number of false-positive (FP) findings in human observer studies [3–6]. Computer-aided detection (CAD) programs are increas-ingly used to yield a secondary opinion in reading chest radiographs in detecting and characterizing pulmonary nodules [7–11]. Recently, a commercial CAD software has been shown to mark a substantial proportion of visually subtle lung cancers missed by radiologists on standard postero-anterior (PA) chest radiographs [12]. Though the combination of ES and CAD had been shown to be Z. Szucs-Farkas (*) . M. A. Patak .
S. Yuksel-Hatz . T. Ruder . P. Vock Department of Diagnostic,
Interventional and Pediatric Radiology, University Hospital of Berne,
Freiburgstrasse 4,
Berne, CH-3010, Switzerland e-mail: [email protected] Fax: +41-31-6320570
promising for detecting simulated lung nodules with an experimental CAD system [13], we are not aware of any published results on the behavior of commercial CAD programs for energy-subtracted chest images in patients. Thus, the purpose of our retrospective study was to evaluate the performance of a commercially available CAD program for the detection of pulmonary nodules on soft tissue chest radiographs with special regard to the number of FP marks and to compare the results with findings by human observers.
Materials and methods
Patients
This retrospective study was performed according to the regulations of the institutional review board and, thus, the need of informed consent has been waived. Study subjects were a subgroup of a patient collective that had been analyzed for pulmonary lesions in a human observer study [6]. In the current investigation, readers’ data were only used for cross-reference with CAD results and to compare the effect of ES on nodule detection by human observers and the CAD software.
Our electronic database was searched for patients examined with single-shot dual-ES chest radiography between January and December 2005, with at least one pulmonary nodule in chest CT performed within a 14-day interval. When more than one chest radiograph was acquired in the same patient within the 2-week period, that radiograph taken closest to the date of the CT examination was chosen. Patients with chest surgery between the two examinations and three patients with significant pleural effusion obscuring at least two-thirds of one hemichest were excluded. The CT examinations of the remaining 77 patients were analyzed, and the size (average of the shortest and longest diameters) of each pulmonary lesion was measured. These patients had been analyzed in the primary reader study [6].
Pulmonary masses larger than 3 cm are usually obvious in chest radiographs not requiring CAD assistance. On the other hand, lung nodules smaller than 5 mm are hardly visible on conventional radiographs [14] and, if inciden-tally discovered, are rather insignificant with an estimated malignancy rate of only 1% [15–18]. Additionally, more than five pulmonary nodules probably do not have an impact on therapeutic decision. Therefore, only subjects with no more than five pulmonary nodules measuring between 5 and 30 mm were included in the current series and patients with pulmonary masses ≥3 cm (n=14) and those with more than five lesions (n=5) were excluded (Fig. 1). These selection criteria based on clinical arguments corresponded best with the specifications of the CAD software used in the study, which was optimized to detect up to five solid pulmonary lesions measuring 9–
30 mm on PA/AP chest images. Fifty-eight patients (23 female, 35 male, mean age 62.9±13.9 years; range, 31– 94 years) met the selection criteria and were included in the study. The diagnoses, which were proven with either biopsy or surgery, were primary lung cancer in 27 patients, pulmonary metastases in 23 cases and benign disease (aspergillosis, sarcoidosis, Wegener’s granulomatosis, hamartoma and granuloma) in eight patients.
Control subjects
The control group consisted of 25 patients (eight female, 17 male, mean age 61.8±13.1 years, range 28–89 years) which were randomly selected from subjects undergoing ES chest radiography and having no focal findings (i.e., nodule, consolidation, atelectasis and ground glass opacity) at chest CT within a 2-week interval in the study period.
Digital radiography and chest CT
PA single-shot dual-energy radiography of the chest was performed on a Fuji XU-D1 (Fujifilm Medical, Tokyo, Japan) upright imaging system. The X-ray tube potential was set at 125 kVp at a constant focus-detector distance of 2 m. Tube current was selected automatically by the unit at a reference dose of 3.5μGy. The spatial resolution was 5 pixels/mm, equaling 2,140×1,760 pixels per image with a format of 43×35 cm. Lateral view radiographs, which had Fig. 1 Selection process for the study population
routinely been taken in all subjects, were not used in the study since the CAD software had been developed for PA chest images.
All chest CT examinations were performed on a Siemens Somatom Cardiac 64 multidetector system (Siemens Medical Solutions, Forchheim, Germany) using a tube rotation time of 0.5 s, a collimation of 24×1.2 mm, pitch of 1.125 and continuous image reconstruction at 2 mm and 5 mm. In both patient and control groups, 80 ml iodinated contrast agent (Ioversol, Optiray 350; Tyco Healthcare/ Mallinckrodt, St. Louis, Mo.) was administered intrave-nously in an antecubital vein at a flow rate of 3–4 ml/s.
All images were stored in a picture archiving and communication system (PACS).
Image analysis by human observers
The PA chest radiographs of 83 study subjects were anonymized and images with or without lung nodules were shown to readers in a randomized order. Image analysis was performed on two high-resolution liquid crystal display (LCD) monitors (ME355i2; Totoku Electric, Japan) by five radiologists with a professional experience of 0.5–30 years and with experience of 2 months to 2 years with ES. The observers marked suspicious localizations on evaluation sheets especially designed for this study. As in clinical situations, readers first analyzed the non-subtracted radiographs and then the soft tissue images in the same session. After marking suspicious localizations on the original radiograph, observers were not allowed to correct marks in retrospect after having seen the subtracted image.
Image analysis with CAD software
Non-subtracted and soft tissue PA chest radiographs of all subjects were analyzed by a CAD software (OnGuard Version 4.0, Riverain Medical, Miamisburg, Ohio), which is commercially available in Europe and pending Food and Drug Administration approval in the United States. The software marked up to five suspicious areas in each image by placing circular regions of interest (ROIs) with a radius of 2.5 cm.
Data analysis and statistics
Marks made by the readers and the CAD software were compared with the CT findings by the conductor of the study using two high-definition LCD monitors in a side-by-side manner. For better accuracy, 2-mm transverse CT images at lung and soft tissue window settings as well as multiplanar reconstructions were analyzed as necessary. A CAD mark was rated true positive (TP) if the center of the ROI fell within the boundaries of a pulmonary nodule verified at CT, otherwise it was regarded as FP. Lesions evident at CT and not marked by the radiologists or the CAD program were rated as false negative (FN). The underlying causes for FP findings with CAD were identified by analyzing both the chest radiographs and CT images at the level of the FP localization.
The study design involved both lesion localization and multiple lesions per image. Furthermore, the CAD software did not provide confidence rates along the marks. For these reasons, neither the classic receiver-operating characteristic
Table 1 Statistical analysis of findings by five human observers and a CAD software in 58 patients with 105 pulmonary nodules confirmed on CT and 25 control subjects. For each observer and the CAD software, the first row shows data of original chest radiographs
without ES and the second row contains numbers derived from the energy-subtracted images. TP, FN and FP findings refer to marks or nodules and TN findings refer to patients; therefore, specificity and accuracy were not calculated
Reader (experience) TP FN FP TN Sensitivity (%)
Reader 1 without ES 38 67 20 20 36.2 (11 years) with ES 39 66 28 19 37.1 Reader 2 without ES 38 67 21 20 36.2 (30 years) with ES 44 61 28 19 41.9 Reader 3 without ES 27 78 44 22 25.7 (4 years) with ES 34 71 55 19 32.4 Reader 4 without ES 30 75 13 23 28.6 (7 years) with ES 34 71 12 24 32.4 Reader 5 without ES 22 83 21 21 21.0 (1/2 years) with ES 33 72 19 21 31.4
Mean all without ES 31 74 24 21 29.4
Readers with ES 37 68 28 20 35.0
CAD without ES 34 71 178 5 32.4
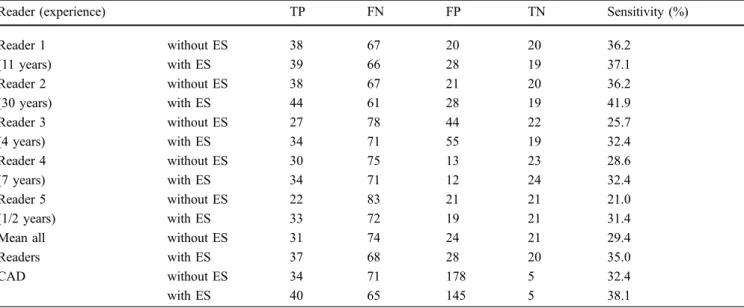
methodology nor statistical methods used for the evalua-tion of marks collected in a free-response manner could be applied to compare performance of CAD with human observers Thus, each pulmonary nodule was analyzed if it was detected or missed by the readers and the CAD software, and the results were compared using the McNemar test. CAD findings with and without ES were compared using the Wilcoxon matched pairs test. FP marks with CAD in patients and control subjects were compared with the Mann-Whitney U-test. The age and gender distribution in the patient and control groups were compared using the t-test for independent samples and the chi-square test. To rule out that clustering might have influenced the results by the human observers, the probability of detecting nodules lying closer than 3 cm to each other was compared with the detection probability of disseminated nodules of the same size using the chi-square test. This analysis was not necessary with the CAD system since the program treats each candidate nodule independent of other nodules in the neighborhood. Statistical analyses Fig. 2 Original (a) and energy-subtracted (b) PA chest radiographs
and a transverse contrast enhanced CT scan (c) in a 53-year-old woman with pulmonary metastases of a pancreatic carcinoma. Two lesions in the left lung were correctly identified by CAD software on both images. A third nodule measuring 9 mm in the right lower lobe was missed on both radiographs (white arrow in b and c). CAD marked three FP localizations on the non-subtracted radiograph and no FP findings on the subtracted image
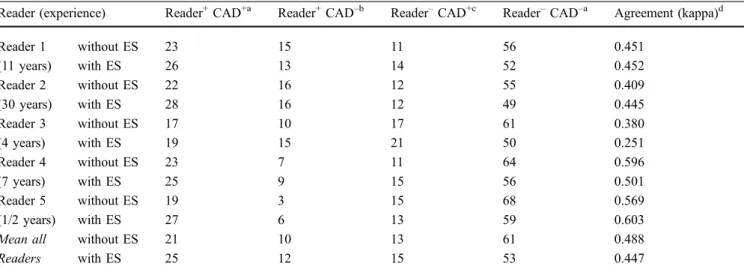
Fig. 3 A 67-year-old female patient with pulmonary embolism but no nodules on chest CT (not shown). The CAD program marked hilar vessels as a suspicious area for nodules on both the standard (a) and energy-subtracted (b) chest radiographs. Two additional FP locations on the original radiograph correspond to overlay of the clavicles with ribs
were performed with the Statistica 7 software (StatSoft, Tulsa, Okla.); a p value <0.05 was considered significant. Kappa-statistics were used to assess both the inter-reader agreement and the agreement between readers and the CAD program in a lesion-to-lesion manner (MedCalc, Mariakerke, Belgium).
Results
The patient and control groups did not differ significantly in respect to age (p=0.97) and gender ratio (p=0.51). A total of 105 pulmonary nodules measuring 5–30 mm (mean, 11.3±6.6 mm) were found in the chest CT of 58 patients. Thirty-three patients had one lesion, 11 patients had two lesions and 14 patients had three to five lesions.
Three readers marked more FPs in the soft tissue images compared with non-subtracted radiographs (Table 1). De-pending on the reader’s experience, the number of FPs,
ranged from 12 to 55, corresponding to 0.14–0.66 FP findings per image. The sensitivities ranged between 21.0 and 41.9%. The mean inter-observer agreement was good with a kappa-value of 0.512 (range, 0.401–0.698). Cluster-ing did not have any significant effect on the lesion detection by the human observers, since nodules in close vicinity (>3 cm) were detected with the same probability as disseminated nodules of the same size (p=0.804, odds ratio=1.19, 95% confidence interval= [0.321; 4.454]).
The CAD software detected non-significantly more true positive nodules on the soft tissue images compared with the non-subtracted radiographs, (p=0.142, Table 1). The number of FP findings ranged between none and five per image, reaching a total of 178 FPs (2.14 FPs per image) in the original radiographs and 145 FPs (1.75 FPs per image) in the soft tissue images (p=0.029; Figs.2,3). The number of FPs with CAD was significantly higher than FPs marked by the readers both with and without ES (p< 0.0001). The number of FP marks made by the CAD
Table 2 Lesion-by-lesion comparison of findings by readers and CAD software (+ correctly identified nodules, – missed lesions) Reader (experience) Reader+CAD+a Reader+CAD–b Reader–CAD+c Reader–CAD–a Agreement (kappa)d
Reader 1 without ES 23 15 11 56 0.451 (11 years) with ES 26 13 14 52 0.452 Reader 2 without ES 22 16 12 55 0.409 (30 years) with ES 28 16 12 49 0.445 Reader 3 without ES 17 10 17 61 0.380 (4 years) with ES 19 15 21 50 0.251 Reader 4 without ES 23 7 11 64 0.596 (7 years) with ES 25 9 15 56 0.501 Reader 5 without ES 19 3 15 68 0.569 (1/2 years) with ES 27 6 13 59 0.603
Mean all without ES 21 10 13 61 0.488
Readers with ES 25 12 15 53 0.447
a
Concordant findings by the readers and the CAD program
b
Lesions that were found by readers but missed by the CAD progam
c
Lesions that were found by the CAD software but missed by the readers. In these cases, CAD was potentially beneficial to avoid FN findings
d
A high kappa value simply indicates the proportion of concordant findings, i.e., lesions found or missed both by the reader and the CAD software, and does not necessarily reflect a good diagnostic performance
Table 3 Distribution of CAD findings grouped by size of the lung lesions
Size range Number of lesions Findings without ES Findings with ES
TP FN TP FN 5–10 mm 66 4 62 6 60 10–15 mm 18 17 1 17 1 15–20 mm 9 6 3 8 1 20–25 mm 7 4 3 6 1 25–30 mm 5 3 2 3 2 Total 105 34 71 40 65
software in patients and controls were not significantly different (without ES, 2.27 vs 1.84 FPs per image, p=0.19; with ES, 1.67 vs 1.92 FP per image, p=0.63). Mean sensitivity of the observers and sensitivity of the CAD software did not differ significantly (p=0.24 without ES, p=0.27 with ES).
On average, 61 out of 105 lesions (58.1%) were not detected by either the human observers or by the CAD software in the non-subtracted radiographs; this rate was 53 out of 105 (50.5%) in the soft tissue images (Table 2). Depending on the reader’s experience, CAD found 11–17 lesions on the original radiographs and 12–21 nodules on subtracted images that had been missed by the readers. For the three less-experienced radiologists (readers 3, 4 and 5), the total number of nodules found by CAD but missed by the readers was greater than the number of nodules correctly identified by the human observers but missed by CAD software (without ES, 43 vs 20 nodules, p=0.006; with ES, 49 vs 30 nodules, p=0.043). For the more experienced radiologists (readers 1 and 2), non-significantly more lesions were detected by the readers only compared with nodules found by the CAD program only (without ES, 31 vs 23, p=0.341; with ES, 29 vs 26 nodules, p=0.787). The kappa-value for the agreement between readers and CAD software varied between 0.251 and 0.603.
The CAD program detected 77% (30/39) of nodules larger than 1 cm in the non-subtracted radiographs, while this rate was 87% (34/39) in the soft tissue images. Nodules measuring 5–10 mm were missed in 94% (62/66) on the original and 91% (60/66) in the subtracted images (Table3). Although CAD found more nodules in the size range of 15–25 mm with ES compared with non-subtracted images, this difference failed to reach statistical signifi-cance (14 vs 10 lesions, p=0.102).
Most FP marks made by the CAD system were attributed to vascular structures both in standard and soft tissue images (Table4). In 9% of the cases, diminished quality of ES was responsible for FP findings (Fig.4).
Discussion
ES and the use of CAD programs are two different ways to improve the detection of pulmonary nodules on chest radiographs. There is no experience with the combination of these techniques on lesion depiction in patients, and it is unknown if ES might increase the number of FP findings with CAD as it did for human observers [6].
Fig. 4 Example for misregistration by the CAD software on a low-quality energy-subtracted chest radiograph (b) performed in a 60-year-old male with no focal lesions at chest CT (not shown). The ghost of the bony structures led to four new FP marks compared with the original radiograph (a)
Table 4 Causes for FP findings with the CAD software on chest radiographs without and with ES (NA not applicable)
Without ES, n (%) With ES, n (%) Bones (1st sternocostal and sternoclavicular joints, superimposition of two ribs) 53 (30%) 12 (8%)
Pulmonary vessels (running orthogonal to the detector plane) 82 (46%) 65 (45%)
Lung pathologies (atelectasis, consolidation, fibrotic changes, scarring) 21 (12%) 34 (23%) Extrapulmonal soft tissue densities (nipple, skin fold, diaphragm, pleural effusion) 11 (6%) 7 (5%)
Medical devices (pacemaker, port chamber, stopcock) 2 (1%) 3 (2%)
Low-quality subtraction NA 13 (9%)
No identifiable cause 9 (5%) 11 (8%)
The two primary goals of the current retrospective series were (1) to look for pulmonary nodules missed by human observers but detected by a commercially available CAD program and (2) to define the rate of FP findings with the CAD software on subtracted and non-subtracted chest radiographs. Notably, our study design was different from the scheme used for CAD programs in the clinical routine as nodules were evaluated by the readers and CAD program in two separate sessions. This was done to avoid that CAD marks interact with the decision process of the human observers. The analysis of the impact of CAD on the observers’ performance will be the subject of a future study.
Although we clearly analyzed a selected population, a bright spectrum of patients with one to five lesions and normal subjects with no focal findings at CT were included in the study. Even in this heterogeneous collective the rate of FP marks made by the CAD software remained acceptably low reaching only 2.14 FPs per image in original chest X-rays and 1.75 FPs per image in the soft tissue radiographs. Thirteen FPs were attributed to low-quality ES and thus, were potentially avoidable. Former series on CAD reported 5.9–15 FP lesions per image [12, 19]. The low FP rate in our study was most likely caused by the better lesion marking algorithm of our CAD software. The lower rate of FP findings will probably increase the usability of the CAD systems and their acceptance among radiologists.
The relatively low sensitivity of human observers corresponds to the data in the literature [20–23]. Similarly, CAD detected only about one third of all lesions. In our series, 63% of the analyzed nodules measured 10 mm or less, which can explain the low overall sensitivity. Not surprisingly, the detection rate with CAD for these lesions <10 mm in size was low both on non-subtracted and subtracted images, reaching only 6% and 9%, respectively. CAD with ES images detected only non-significantly more nodules than with original images, which can be explained by the relatively low number of lung nodules analyzed in
the study. The advantage of ES might reach statistical significance in a larger collective.
Eleven to 21 lesions, equaling 10–20% of all nodules, were only detected by the CAD program and missed by individual observers. The number of lesions detected by the readers only was higher for experienced observers than for less experienced observers. Furthermore, the software and the readers often identified different lesions. These results indicate that CAD can help human observers in lesions detection and physicians with less experience would profit from the use of CAD software more than experienced physicians. However, it remains open whether the increased conspicuity of parenchymal changes as cause for FP in subtracted images might mislead human observers. A prospective multiobserver study comparing the performance before and after applying the CAD program in combination with ES is obviously necessary to answer this question. Another interesting topic for future investigation would be the analysis of the impact of CAD on patient management and time needed for interpreting images.
We conclude that, depending on the observer’s experi-ence in interpreting chest radiographs, CAD can help in nodule detection both on standard and energy-subtracted images. The tested commercial CAD program produced significantly less FP findings on energy-subtracted soft tissue images compared with non-subtracted chest radio-graphs, which can increase the acceptance of the technique for routine use. Though identifying pulmonary nodules smaller than 10 mm remains a problem, the combined use of ES and CAD has the potential to improve sensitivity of lesion detection on chest radiographs. We think that further investigations are needed to analyze the clinical feasibility of this combination and to establish its role in the daily routine.
Acknowledgements The authors wish to express their thanks to Dr. Mathias Gugger, Institute of Pathology, University of Berne, for providing the histological diagnoses.
References
1. Bach PB, Kelley MJ, Tate RC, McCrory DC (2003) Screening for lung cancer: a review of the current litera-ture. Chest 123:72S–82S
2. McAdams HP, Samei E, Dobbins J 3rd, Tourassi GD, Ravin CE (2006) Recent advances in chest radiography. Radiol-ogy 241:663–683
3. Ho JT, Kruger RA (1989) Comparison of dual-energy and conventional chest radiography for nodule detection. In-vest Radiol 24:861–868
4. Oestmann JW, Greene R, Rhea JT, Rosenthal H, Koenker RM, Tillotson CL, Pearsen KD, Hill JW, Velaj RH (1989)“Single-exposure” dual energy digital radiography in the detection of pulmonary nodules and calcifications. Invest Radiol 24:517–521
5. Ricke J, Fischbach F, Freund T, Teichgraber U, Hanninen EL, Rottgen R, Engert U, Eichstadt H, Felix R (2003) Clinical results of CsI-detector-based dual-exposure dual energy in chest radiography. Eur Radiol 13:2577–2582
6. Szucs-Farkas Z, Patak MA, Yuksel-Hatz S, Ruder T, Vock P (2008) Single-exposure dual-energy subtraction chest radiography: detection of pulmonary nodules and masses in clinical practice. Eur Radiol 18:24–31
7. Kobayashi T, Xu XW, MacMahon H, Metz CE, Doi K (1996) Effect of a computer-aided diagnosis scheme on radiologists’ performance in detection of lung nodules on radiographs. Radi-ology 199:843–848
8. MacMahon H, Engelmann R, Behlen FM, Hoffmann KR, Ishida T, Roe C, Metz CE, Doi K (1999) Computer-aided diagnosis of pulmonary nodules: results of a large-scale observer test. Radiology 213:723–726
9. van Ginneken B, ter Haar Romeny BM, Viergever MA (2001) Computer-aided diagnosis in chest radiography: a sur-vey. IEEE Trans Med Imaging 20:1228–1241
10. Shiraishi J, Abe H, Engelmann R, Aoyama M, MacMahon H, Doi K (2003) Computer-aided diagnosis to distinguish benign from malignant sol-itary pulmonary nodules on radio-graphs: ROC analysis of radiologists’ performance—initial experience. Radi-ology 227:469–474
11. Bley TA, Baumann T, Saueressig U, Pache G, Treier M, Schaefer O, Neitzel U, Langer M, Kotter E (2008) Comparison of radiologist and CAD performance in the detection of CT-confirmed subtle pulmonary nodules on digital chest radiographs. Invest Radiol 43:343–348
12. Li F, Engelmann R, Metz CE, Doi K, MacMahon H (2008) Lung cancers missed on chest radiographs: results obtained with a commercial computer-aided detection program. Radiology 246:273–280
13. Kido S, Kuriyama K, Kuroda C, Nakamura H, Ito W, Shimura K, Kato H (2002) Detection of simulated pul-monary nodules by single-exposure dual-energy computed radiography of the chest: effect of a computer-aided diagnosis system (Part 2). Eur J Radiol 44:205–209
14. Kundel HL (1981) Predictive value and threshold detectability of lung tumors. Radiology 139:25–29
15. Aberle DR, Gamsu G, Henschke CI, Naidich DP, Swensen SJ (2001) A consensus statement of the Society of Thoracic Radiology: screening for lung cancer with helical computed tomogra-phy. J Thorac Imaging 16:65–68 16. MacMahon H, Austin JH, Gamsu G,
Herold CJ, Jett JR, Naidich DP, Patz EF Jr, Swensen SJ (2005) Guidelines for management of small pulmonary nod-ules detected on CT scans: a statement from the Fleischner Society. Radiology 237:395–400
17. Libby DM, Smith JP, Altorki NK, Pasmantier MW, Yankelevitz D, Henschke CI (2004) Managing the small pulmonary nodule discovered by CT. Chest 125:1522–1529
18. Beigelman-Aubry C, Hill C, Grenier PA (2007) Management of an inciden-tally discovered pulmonary nodule. Eur Radiol 17:449–466
19. Matsumoto T, Yoshimura H, Giger ML, Doi K, MacMahon H, Montner SM, Nakanishi T (1992) Potential useful-ness of computerized nodule detection in screening programs for lung cancer. Invest Radiol 27:471–475
20. Quekel LG, Kessels AG, Goei R, van Engelshoven JM (1999) Miss rate of lung cancer on the chest radiograph in clinical practice. Chest 115:720–724 21. Quekel LG, Kessels AG, Goei R, van
Engelshoven JM (2001) Detection of lung cancer on the chest radiograph: a study on observer performance. Eur J Radiol 39:111–116
22. Heelan RT, Flehinger BJ, Melamed MR, Zaman MB, Perchick WB, Caravelli JF, Martini N (1984) Non-small-cell lung cancer: results of the New York screening program. Radiology 151:289–293
23. Monnier-Cholley L, Arrive L, Porcel A, Shehata K, Dahan H, Urban T, Febvre M, Lebeau B, Tubiana JM (2001) Characteristics of missed lung cancer on chest radiographs: a French experience. Eur Radiol 11:597–605