Publisher’s version / Version de l'éditeur:
Macromolecules, 39, 2, pp. 720-730, 2006
READ THESE TERMS AND CONDITIONS CAREFULLY BEFORE USING THIS WEBSITE. https://nrc-publications.canada.ca/eng/copyright
Vous avez des questions? Nous pouvons vous aider. Pour communiquer directement avec un auteur, consultez la première page de la revue dans laquelle son article a été publié afin de trouver ses coordonnées. Si vous n’arrivez pas à les repérer, communiquez avec nous à [email protected].
Questions? Contact the NRC Publications Archive team at
[email protected]. If you wish to email the authors directly, please see the first page of the publication for their contact information.
NRC Publications Archive
Archives des publications du CNRC
This publication could be one of several versions: author’s original, accepted manuscript or the publisher’s version. / La version de cette publication peut être l’une des suivantes : la version prépublication de l’auteur, la version acceptée du manuscrit ou la version de l’éditeur.
For the publisher’s version, please access the DOI link below./ Pour consulter la version de l’éditeur, utilisez le lien DOI ci-dessous.
https://doi.org/10.1021/ma0520139
Access and use of this website and the material on it are subject to the Terms and Conditions set forth at
Structural study of proton-conducting fluorous block copolymer
membranes
Rubatat, Laurent; Shi, Zhiqing; Diat, Olivier; Holdcroft, Steven; Frisken,
Barbara J.
https://publications-cnrc.canada.ca/fra/droits
L’accès à ce site Web et l’utilisation de son contenu sont assujettis aux conditions présentées dans le site LISEZ CES CONDITIONS ATTENTIVEMENT AVANT D’UTILISER CE SITE WEB.
NRC Publications Record / Notice d'Archives des publications de CNRC:
https://nrc-publications.canada.ca/eng/view/object/?id=76f13d5a-1e86-4a52-b004-319320053417 https://publications-cnrc.canada.ca/fra/voir/objet/?id=76f13d5a-1e86-4a52-b004-319320053417
Structural Study of Proton-Conducting Fluorous Block Copolymer
Membranes
Laurent Rubatat,†Zhiqing Shi,‡,§Olivier Diat,⊥Steven Holdcroft,‡,§ and
Barbara J. Frisken*,†
Department of Physics, Simon Fraser UniVersity, Burnaby, BC V5A 1S6, Canada; Department of Chemistry, Simon Fraser UniVersity, Burnaby, BC V5A 1S6, Canada; Institute for Fuel Cell InnoVation, National Research Council Canada, 3250 East Mall, VancouVer, BC V6T 1W5, Canada; and UMR SPrAM 5819, CEA-Grenoble, 17 aV. des Martyrs, 38054 Grenoble, Cedex 9, France
ReceiVed September 15, 2005; ReVised Manuscript ReceiVed NoVember 3, 2005
ABSTRACT: Small-angle neutron scattering with contrast variation and transmission electron microscopy have been used to investigate the nanostructure of films cast from diblock copolymer solutions. The polymers are composed of a fluorocarbon block and a sulfonated polystyrene block, where the length and degree of sulfonation of the polystyrene segment have been controlled. This study shows that these films possess structure at two length scales: phase separation at length scales of the order of 40 nm due to the immiscibility of the two polymer blocks and substructure within the sulfonated polystyrene domains due to segregation of the hydrated ionic groups and the hydrophobic polystyrene chains. The longer length scale morphology is well-ordered for diblocks containing long and partially sulfonated polystyrene blocks whereas the short and fully sulfonated polystyrene blocks give rise to a more disordered structure.
Introduction
Proton exchange membranes (PEMs) are the most promising electrolyte medium for low-temperature fuel cells (PEMFCs). The ideal membrane should be chemically and electrochemically stable, have good mechanical strength and integrity, exhibit a high protonic conductivity, and have the potential to be prepared at low cost. In the past decade, a variety of ionomers have been synthesized to meet these requirements, but so far the mem-branes of referencesin terms of durability and performances are still the perfluorosulfonic acid (PFSA) membranes, of which Nafion is the premier example.1-3Unfortunately, these fluori-nated ionomer membranes are expensive to produce due to their complex synthesis. Moreover, they are not suitable for “high”-temperature PEMFCs (typically operating above 130°C) due to the dramatic drop of proton conductivity observed above 100 °C, and they are not good candidates for direct methanol fuel cells (DMFC) due to their poor resistance to methanol cross-over.4Because of these difficulties, the synthesis and charac-terization of new alternative ionomer materials must continue in order to achieve high-performance membranes and to support fuel cell commercialization.
An important component of any program to systematically improve ionomer membranes is the design and synthesis of model polymer materials. The main requirement for PEMs is to have good proton conductivity, typically 0.1 S/cm. The conductivity value is affected by many things including the chemical structure (composition and nature of the polymer backbone), the ion exchange capacity (IEC), the water content, and the material morphology. However, it is still not clear how different polymer structures and architectures affect the mac-roscopic features such as membrane conductivity. Studies of structure and conductivity of model materials will provide
insight into proton transport mechanisms and will ultimately leads to optimization of the design of the next generation of membranes for fuel cell applications.
Recently, interest has turned to ion-containing block copoly-mers. Diblock copolymer materials possess well-known and well-defined structures that confer ordered morphologies.5,6In the case of uncharged diblock copolymers, hexagonal cylinders, close-packed spheres, bicontinuous phases, and other structures can be achieved by changing the relative length or the degree of segregation of the blocks. Incorporation of ionic groups into block copolymers provides a system where conductivity and structure can be tuned and their correlation can be studied systematically.
Several ionomers based on polystyrene-containing block copolymers have been prepared. For example, the partially sulfonated poly(styrene-b-[ethylene-butylene]-b-styrene) co-polymer (S-SEBS) has been developed by DAIS-Analytical Corp.7Studies of morphological and physical properties as well as fuel cell testing of S-SEBS block copolymer membranes have been performed by several groups.8-16Sulfonated poly-(styrene-b-isobutylene-b-styrene) block copolymer (S-SIBS) has been synthesized in order to study methanol and proton transport properties17,18 and to develop novel ion-containing polymer composites.12,13 Other polystyrene block copolymer membranes that have been prepared and studied include sulfonated hydrogenated poly(butadiene-b-styrene) diblock co-polymer (S-HPBS),19,20 sulfonated
poly(styrene-b-[ethylene-alt-propylene]) (S-SEP),21,22 and poly(styrene-b-ethylene/ propylene-b-styrene) (S-SEPS).22
In this paper, we use a new model diblock copolymer system to study the correlation between structure and transport proper-ties in these materials. The system consists of sulfonated poly-([vinylidene difluoride-co-hexafluoropropylene]-b-styrene) block copolymers (P[VDF-co-HFP]-b-SPS). There are several reasons for choosing films made from this family of polymers as a model system. First, the two blocks are completely incompatible, which ensures self-assembly into nanostructures. Second, the method
†Department of Physics, Simon Fraser University. ‡Department of Chemistry, Simon Fraser University. §National Research Council Canada.
⊥CEA-Grenoble.
* To whom correspondence should be addressed. E-mail: [email protected].
10.1021/ma0520139 CCC: $33.50 © 2006 American Chemical Society Published on Web 12/27/2005
of synthesis of the polymers23,24achieves a low polydispersity of the block length and, consequently, well-defined structures. Furthermore, the ionic exchange capacity (IEC) can be con-trolled by adjusting either the length or degree of sulfonation of the polystyrene chains. The structure of membranes cast from solutions of these polymers was investigated over a large range of length scales using a combination of imaging and scattering techniques: transmission electron microscopy (TEM), small-angle neutron scattering (SANS), and wide-small-angle X-ray scat-tering (WAXS). These three techniques are complementary; TEM images structure from 10 to 100 nm, while SANS and WAXS probe structure from 1 to 50 nm and 0.1 to 1 nm, respectively.
Materials and Methods
Block Copolymer Synthesis and Membrane Preparation.
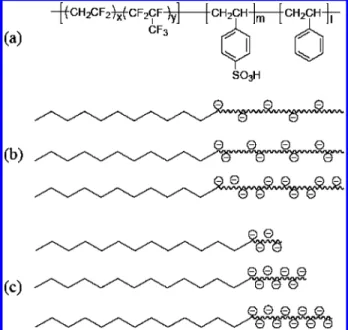
Poly([vinylidene difluoride-co-hexafluoropropylene]-b-styrene) (P[VDF-co-HFP]-b-PS) was synthesized by atom transfer radical polymerization (ATRP) of styrene initiated by a trichloromethyl-terminated fluorous macroinitiator (cf. Figure 1a).23-25The mac-roinitiator was prepared by emulsion polymerization in the presence of chloroform, which serves as a chain transfer agent. Hexafluo-ropropylene (16 mol % in the blocks) was added during the synthesis of the PVDF block to minimize the formation of crystalline structure and to improve the solubility of PVDF in common solvents (acetone, tetrahydrofuran, and butyl acetate). The polystyrene block sulfonation was carried out at 40 °C in 1,2-dichloroethane using acetyl sulfate as sulfonation agent.23,25 Sul-fonated diblock copolymer solutions are prepared in tetrahydrofuran (THF), which is a good solvent for both blocks. Films were cast
from those solutions onto a Teflon surface under ambient conditions. The resulting films possessed thicknesses of about 100 µm.
Two membrane series were prepared. Within each series, the fluorinated blocks are of identical length while the polystyrene blocks differ. The polystyrene blocks of series 1 are sulfonated to different degrees but all have the same length (cf. Figure 1b). Those of series 2 are fully sulfonated but have different lengths of polystyrene chain (cf. Figure 1c). The number-average molecular weight, Mn, degree of polymerization, DP, and degree of sulfona-tion, DS, of the polymer blocks as well as the IEC, number of water molecules per ionic group in the fully hydrated membrane, λ value, and conductivity measured at 100% RH can be found in Table 1. The techniques used to measure these quantities are presented in refs 23 and 25. For series 1, the number-average molecular weight of the fluorous blocks is 17 900 Da with a polydispersity index of 1.48, and the nominal molecular weight of polystyrene blocks is 8100 Da. There are three membranes in this series, 1A, 1B, and 1C, the polystyrene blocks having degrees of sulfonation 22%, 32%, and 40%, respectively. The number-average molecular weight of the fluorous block used in series 2 is 24 300 Da with a polydispersity index of 1.58. Three membranes, 2A, 2B, and 2C, were studied in this series; they consisted of polystyrene blocks whose degrees of polymerization were 9, 13, and 18, respectively.
Control of Membrane Counterion.Protons were exchanged
for tetramethylammonium (TMA+) ions for contrast measurement. This counterion has three properties: (i) it contains a large number of hydrogen atoms, (ii) the hydrogen atoms are not replaced by deuterium atoms when D2O solvent is used, and (iii) despite its methyl groups, TMA+is not a hydrophobic moiety and does not perturb membrane swelling.26 To exchange H+ for TMA+, the membranes were soaked in saturated tetramethylammonium chloride solution overnight and rinsed twice in water to remove excess salt.
Small-Angle Neutron Scattering (SANS).Neutron scattering
experiments were performed on NG7-SANS at the NIST Center for Neutron Research (NCNR, Gaithersburg, MD). Three different configurations involving different sample-to-detector distances Ds-d and wavelengths λ were used: (i) Ds-d) 1 m andλ ) 6 Å, (ii) Ds-d) 7 m andλ ) 6 Å, and (iii) Ds-d) 15.3 m andλ ) 8.09 Å. The samples were enclosed in quartz cells, with a gap of 1 mm between the two windows; the remaining space was filled with the appropriate solvent. The cells were maintained at ambient temper-ature during measurement. The technique of neutron scattering was chosen to take advantage of the contrast variation method. To vary the scattering contrast between the polymer matrix and the solvent, the membrane was soaked in different H2O and D2O mixtures. We used four different mixtures: 100-0 (100% H2O), 50-50 (50% H2O, 50% D2O), 30-70 (30% H2O and 70% D2O), and finally 0-100 (100% D2O); these mixtures have scattering length densities (SLD) of -0.56, 2.915, 4.305, and 6.39 × 1010 cm cm-3, respectively.
Wide-Angle X-ray Scattering (WAXS). WAXS experiments
were performed on a Siemens D-5000 diffractometer, using a Cu KR source. Samples were maintained at ambient temperature and humidity.
Transmission Electron Microscopy (TEM).Samples for TEM
were prepared according to the following procedure.23Membranes were stained by soaking them overnight in a saturated lead acetate solution. The membranes were then rinsed with water and dried under vacuum at room temperature for a minimum of 4 h. Following
Figure 1. (a) General chemical structure of the diblock copolymer. (b) Schematic structure of series 1. IEC increasing with the degree of sulfonation of the polystyrene block. (c) Series 2 schematic structure, IEC increasing the degree of polymerization of the fully sulfonated polystyrene block.
Table 1. Molecular Weight of the Fluorous (PVDF) and Polystyrene (PS) Blocks, Degree of Polymerization (DP) and Degree of Sulfonation (DS) of the Sulfonated Polystyrene (SPS) Blocks, Membrane Ion Exchange Capacity (IEC), Number of Water Molecules per Ionic Group in the Fully
Hydrated Membrane (λ Value), and Conductivity (σ) at 100% RH of Polymers and Membranes Used in This Study
membrane name PVDF (Da) SPS (Da) PVDF DP SPS DP SPS DS (%) IEC (mmol/g) λ value σ (S/cm)
1A 17 900 8100 ∼240 78 22 0.72 11 1.6 × 10⁻² 1B 17 900 8100 ∼240 78 32 0.89 24 5.5 × 10⁻² 1C 17 900 8100 ∼240 78 40 1.18 42 8 × 10⁻² 2A 24 300 950 ∼310 9 100 0.34 39 9 × 10⁻⁴ 2B 24 300 1350 ∼310 13 100 0.46 28 6.1 × 10⁻³ 2C 24 300 1870 ∼310 18 100 0.64 32 2.3 × 10⁻²
this, they were embedded in Spurr’s epoxy resin. The epoxy blocks were sectioned to yield slices 60-100 nm thick using a Reichert OM3 microtome and picked up on copper grids. Images were obtained using a Zeiss 10C transmission electron microscope with an accelerating voltage of 80 kV.
Conductivity, Water Uptake, IEC, and Molecular Weight.
Tangential proton conductivity at room temperature and at 100% RH was measured by ac impedance spectroscopy with a HP 8753A network analyzer, using a frequency range of 300 kHz to 1 GHz and a gold-plated coaxial probe23and using Nafion as a standard sample. The protocols used to measure and calculate the number of water molecules per ionic site, λ value, and the ion exchange capacity, IEC, of the whole molecule, are presented in the refs 23-25. The fluorous block number-average molecular weight, Mn, was measured using a gel permeation chromatograph, GPC, using three µ-Styragel columns, a Waters 510 HPLC, polystyrene standards, THF eluant, and a Waters 410 differential refractometer.23,25The number-average molecular weight of the polystyrene block in series 1 was obtained by subtracting that of the fluorous block from that of the whole diblock. In series 2, the polystyrene block molecular weight is derived from the IEC value.
Results
Transmission Electron Microscopy.TEM images reveal that
dry membranes from series 1 are well structured. Two domains, with light and dark regions, are clearly visible as shown in Figure 2. These correspond to fluorous domains and sulfonated polystyrene domains (SPS domains) with the dark regions representing SPS domains as the protons from the sulfuric acid group are exchanged for lead ions. Figure 3 shows TEM images for dry membranes from series 2, 2B and 2C, made with polymers with fully sulfonated polystyrene chains having degrees of polymerization of 13 and 18, respectively. The TEM images show that series 2 membranes are not as structured as those of series 1. As in the TEM images of series 1, the dark regions correspond to SPS domains and the lighter regions correspond to fluorous domains. Segregation between blocks becomes clearer for longer SPS chains.
Small-Angle Neutron Scattering.Membranes of the same
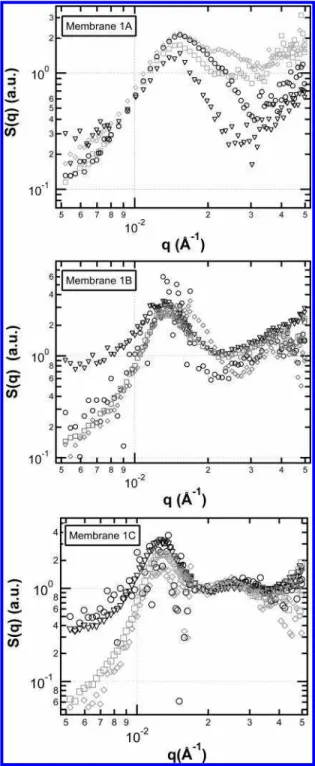
polymers used for TEM experiments were used for the neutron scattering study. The two-dimensional spectra are isotropic and azimuthal averages of them are shown in Figures 4 and 5, for membranes soaked in D2O. Two major peaks are distinguish-able: peak 1 at a scattering vector of ∼0.015 Å-1, corresponding to a characteristic size on the order of 500 Å, and peak 2 at a scattering vector of ∼0.15 Å-1, corresponding to a size of about 45 Å. Peak 1 is considerably broader in series 2 than in series 1. Peak 2 is not present in the scattering spectra of membrane 2A, which has the shortest fully sulfonated polystyrene block. There are significant shifts of the peak positions as the degree of sulfonation changes. In series 1, both peaks 1 and 2 shift to a smaller angle as the degree of sulfonation increases, as shown in Figure 4. The behavior of both peaks can be understood in terms of a swelling process of the material which occurs as the IEC and water content increase. For series 2, there is no trend in the evolution of peak 1 as a function of the length of the fully sulfonated polystyrene block, and the q-position of peak 2 do not change significantly between membranes 2B and 2C, as shown in Figure 5.
Neutron scattering spectra have been measured for each cast membrane soaked in each of the four different H2O-D2O ratio solutions; spectra for membranes from series 1 and 2 are shown in Figures 6 and 7, respectively. For solvents other than pure D2O, a third peak, peak 3, appears around 0.02-0.03 Å-1on the spectra from series 1 membranes. This peak 3 is clearly observable for membranes 1B and 1C, and it is slightly evident
for membrane 1A. Its q-position and intensity are strongly dependent on solvent contrast, though without any obvious trend. The position of this peak is typically in the q-range expected for a second-order peak associated with peak 1, but it does not correspond exactly.
Solvent contrast variation has a strong effect on the intensity of all three peaks but only affects the q-position of peak 3. Typically, peak 1 essentially disappears when the film is swollen in the 30-70 mixture, except in membrane 1A, whereas the intensity of peak 2 decreases dramatically when H2O or the 50-50 mixture is used.
In this neutron study, TMA+was used as the counterion in order to stain the ionic groups and enhance the contrast between those ionic groups, the PS domains and the solvent. Figure 8 shows spectra obtained for membrane 1C in both acidic form and TMA+ form. There is no significant difference in the scattering curves measured for membrane 1C in these two forms. That indicates that the counterions are not well localized in the structure; there is no clear manifestation of condensation of the counterion at the polymer/solvent interface, contrary to what has been observed in Nafion membranes.27
Wide-Angle X-ray Scattering.WAXS was performed in the qrange of 0.4-5 Å-1to probe the structure at molecular length Figure 2. TEM images of three films from series 1 (1A, 1B, and 1C) stained with lead ions.
scales and to check for crystalline domains in the membranes from both series. All spectra measured present the same features. Figure 9 shows the spectra from membranes 1B and 2B. Two major peaks can be distinguished at 1.25 and 2.85 Å-1, corresponding to sizes of 5.03 and 2.21 Å, respectively, in direct space. We notice a shoulder on the first peak (black arrows) of the series 2 spectra.
Discussion
Large Length Scale Morphology of Both Series.In both
series, peak 1 indicates structure that has a length scale of a few hundred angstroms. Varying the contrast of the solvent used to hydrate each membrane results in variation of the intensity of this peak. For all samples in series 2, this peak is significantly diminished when the samples are hydrated in the 30-70 mixture. In series 1, the behavior of all samples is not the same, and a third peak appears in some solvents. While we attribute the large scale structure to ordering of the fluorous and hydrated
sulfonated polystyrene domains because of the TEM images, the analysis of the spectra for the two series is different.
Detailed Analysis of Large Length Scale Morphology of the Series Containing Partially Sulfonated Polystyrene.To
analyze the large length scale structure in series 1, we assume that the intensity scattered by the membrane is proportional to the product of a structure factor S(q) and a form factor P(q)28
where K is a scaling factor that is independent of SLD contrast but related to the number of scattering objects in the irradiated sample volume. The form factor, P(q), describes the specific shape of the scattering objects, and the structure factor, S(q), describes the spatial ordering of these objects. This expression is true in two cases: the scattering objects are centrosymmetric (typically spheres) or the scattering objects are anisotropic (e.g., cylinders, disks) but are locally oriented.29Equation 1 is valid for qL > 1, where L corresponds to a length scale characteristic of the structure of interest.
Using eq 1, we can determine the form factor of the scattering objects by dividing the spectra obtained using solvents of different contrast. To do this, we must assume that changing the solvent has no effect on the structure of the material as has been shown for Nafion membranes;30the structure factor is then expected to be the same for all solvent mixtures. We also assume that the shape of the scattering objects remains the same but that the measured form factor is expected to change due to the variation of the SLD of the object components; this point will be discussed later. Under these assumptions, the division of two spectra obtained for the same membrane but soaked in two different mixtures will eliminate the structure factor component, S(q), and the scaling factor, K
The result of this division is a normalized ratio of two form factors, which can be compared to curves calculated for different object shapes. A similar approach has been used to analyze SANS spectra of Nafion membranes.27,31
The protocol of the analysis is as follows. First, the experimental spectra obtained for each membrane soaked in 50-50, 30-70, and D2O mixtures (solvent1) are divided by that measured in H2O (solvent2). Then theoretical estimates of Pdiv -(q) are fit to the experimental ones. Finally, the structure factors Figure 3. TEM images of two films from series 2 (2B and 2C) stained
with lead ions.
Figure 4. SANS spectra from membranes 1A, 1B, and 1C, corre-sponding to IEC of 0.72, 0.89, and 1.18 mmol/g, soaked in D2O.
Figure 5. SANS spectra from membranes 2A, 2B, and 2C, corre-sponding to IEC of 0.34, 0.46, and 0.64 mmol/g, soaked in D2O.
are calculated by dividing the measured spectra by the corre-sponding theoretical form factor for each mixture.
Figure 10 shows the results for the divided experimental spectra, or normalized spectra, of membranes 1A, 1B, and 1C. The fact that the normalized spectra from the same membrane soaked in different solvent mixtures are not flat means that the scattering objects cannot be modeled as consisting of only two scattering length densities (SLDs), such as homogeneous objects in a matrix. This observation motivated us to consider core-shell form factors with three SLD levels. The choice of the shape of the scattering object is of prime importance, as it is necessary to distinguish between the typical structures already observed
in diblock copolymer materials.5In particular, spherical, cylin-drical, and lamellar structures were tested. To test for lamellar structure, the form factor corresponding to discoidal shapes was used because a collection of discoidal objects also describes a lamellar structure in the limit of a large radius-to-thickness ratio. However, we found that the spherical and cylindrical core-shell form factors gave rise to unrealistic object diameters or low fit quality. Only the core-shell discoidal form factor gave rise to a reasonable analysis of the normalized spectra; results for these fits will be described.
The core-shell disk structure used is shown in Figure 11 (left). Each scattering object consists of a discoidal core with an external layer (or shell) on both sides as shown in Figure 11 (right). The core is defined by its radius r, thickness t, thickness polydispersity σ, and its SLD Fcore. The radius is maintained at Figure 6. SANS spectra from membranes 1A, 1B, and 1C for four
solvent contrasts: H2O (squares), 50-50 (H2O-D2O) (diamonds),
30-70 (H2O-D2O) (circles), and D2O (triangles).
Figure 7. SANS spectra from diblock copolymer membranes 2A, 2B, and 2C for four solvent contrasts: H2O (squares), 50-50 (H2O-D2O)
5000 Å for all of the analysis because this is ∼20 times larger than the thickness. The shell is defined by its thickness s and by its SLD, Fshell. Finally, the medium around the objects is defined by its SLD, Fext. Such a form factor can easily be calculated; the final expression used in the following analysis is derived in the Appendix.
Each component of the model system has a different chemical origin. It was necessary to try several assignments before the data could be analyzed consistently. It was found that a system composed of a discoidal core made up of solvent-containing, sulfonated polystyrene domains with a polystyrene shell and surrounded by a fluoropolymer medium was consistent with the data. At the length scale being probed in the vicinity of peak 1, Fcore can be calculated as an average of the sulfonated polystyrene SLD Fpoly) 1.41 × 1010cm/cm3and the solvent SLD, where Fsolventis a function of the H2O-D2O mixture, as shown by the equation
where Φpis the core polymer volume fraction. The SLD of the surrounding medium is that of the fluoropolymer, Fext) 3.22 ×1010cm/cm3,32and the SLD of the shell is that of polystyrene, Fshell) 1.41 × 1010cm/cm3. Note an alternate ordering of the constituents in the core shell disk form factor, namely a fluorous core and a polystyrene shell in a hydrated SPS medium, was considered, but this led to a shift of the minimum of the
normalized spectra that was inconsistent with experimental results.
In summary, the unknown parameters of the system varied in the fit of the normalized spectra are t, the core thickness with σ its polydispersity, Φp,the polymer volume fraction of the disk core, and s, the shell thickness. It is essential to note that the same set of parameters was used to fit all three normalized spectra from the same membrane, with only Fcorechanging due to the variation of Fsolvent. Curves showing the fit and the fitting parameters are presented in Figure 10 and Table 2, respectively. The fitting analysis has been done by hand, adjusting the unknown parameters to fit the maxima and minima positions as well as the absolute intensity of the data. The fit quality is good enough to support a lamellar model considering that most Figure 8. SANS spectra measured for membrane 1C containing either
TMA+or H+counterions and immersed in either H
2O or D2O. The
two spectra measured on the acidic form membranes (H+) have been
multiplied by 10 for sake of clarity.
Figure 9. WAXS spectra from membranes 1B and 2B in acidic form at ambient conditions. Intensity scale is in arbitrary units.
Fcore)ΦpFpoly+ (1 -Φp)Fsolvent (3)
Figure 10. SANS spectra for membranes 1A, 1B, and 1C divided by the H2O spectra: D2O/H2O (triangles), 30-70/H2O (circles), and
50-50/H2O (diamonds). The solid lines represent the theoretical results
for the normalized spectra. For the sake of clarity, the curves are offset. The fits are performed in absolute intensity.
of the parameters are strongly constrained and considering also the agreement of the curves in absolute intensity.
The parameter values presented in Table 2 are consistent from one membrane to another. As the degree of sulfonation increases and the region becomes richer in solvent, the polymer volume fraction in the hydrated sulfonated polystyrene domains Φp decreases from 65 to 40% and the thickness of these domains tincreases from 180 to 275 Å. The polystyrene layer thickness sdecreases slightly with increasing sulfonation, from 30 Å for membrane 1A to 25 Å for membrane 1C. The presence of this thin layer of polystyrene is probably due to the fact that hydrophobic polystyrene chains are more likely to rest in contact with the fluorous domains than with the hydrophilic sulfonated polystyrene. However, realistically, the layer cannot be totally free of ionic groups as the sulfonation is randomly distributed along the polystyrene chain. The ionic groups within this thin layer are probably isolated and nonhydrated, as the solvent contrast variation has no effect on the shell’s SLD.
The structure factor was then found by dividing the measured scattering intensity by the calculated form factor. Structure factors for membranes 1A, 1B, and 1C are shown in Figure 12. The calculated structure factors for each membrane and each solvent present a well-defined first-order peak, whose position (q*) can be used to calculate the distance of repetition between the lamellae using the Bragg relation, DBragg) 2π/q*. Values of 410, 460, and 490 Å were obtained for membranes 1A, 1B, and 1C, respectively. These values are reasonable, as the higher degree of sulfonation should result in an increase in swelling of the structure and an increase in the distance between the lamellae. The lamellae repetition distance includes the disk thickness (with the shell) and the thickness of the fluorinated medium in between two sulfonated polystyrene disks, tPVDF. Knowing the thicknesses of the disk from the previous analysis, we estimate tPVDFto be 170, 180, and 165 Å for membranes 1A, 1B, and 1C, respectively, consistent with the fact that all samples have PVDF blocks of the same molecular weight. These values are consistent with the PVDF lamellae thicknesses measured on the TEM images, which are between 100 and 200 Å.
Agreement between the structure factors calculated for each membrane in different solvents is generally good at q beyond
0.01 Å-1. This confirms our previous hypothesis that the scattering intensity can be analyzed with a product of a form and structure factor and that the nature of the solvent does not influence the membrane structure at length scales smaller than 500 Å. The structure factors for membrane 1C present well-defined first- and second-order peaks (q* and 2q*), which is an expected feature for a well-structured lamellar system. This result, coupled with the fact that the quality of the fits shown in Figure 10 increases with the degree of sulfonation, leads us to the conclusion that increasing the degree of sulfonation of the polystyrene block improves the quality and the ordering of the lamellar structure in this series. Note that this spectra analysis leads us to the understanding of the origin of peak 3 as a combination of the second-order peak of the structure factor and the first oscillation of the form factor.
Figure 11. The left side of the figure shows a sketch of the structure used to analyze the SANS spectra for series 1. This structure consists of stacks of disks defining domains presenting different orientations. The right side of the figure shows a sketch of a single core-shell disk.
Table 2. Parameters Obtained by Fitting Eqs 3 and 4 to the Normalized Spectra for Membranes 1A, 1B, and 1Ca
sample t(Å) s(Å) Φp(%) DBragg(Å) tPVDF(Å)
1A 180 ( 31 30 65 410 170
1B 224 ( 30 28 43 460 180
1C 275 ( 21 25 40 490 165
atis the core thickness, s the shell thickness, Φ
pthe polymer volume
fraction within the sulfonated polystyrene domains, and DBraggthe Bragg
distance from the first-order peak of the structure factor.
Figure 12. Calculated structure factor, S(q), for films (a) 1A, (b) 1B, and (c) 1C, swollen in H2O (square), 50-50 (diamonds), 30-70
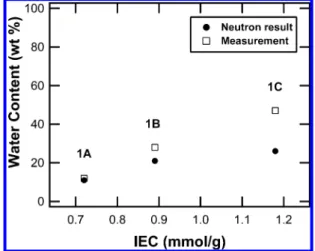
From the parameter values extracted from the neutron spectra analysis, we are able to calculate the water content for each membrane and to compare it with the measured water content. The results are shown in Figure 13; the values obtained from the neutron analysis underestimate the water content. This may be due to the fact that the model considers only the water within the lamellar domains and ignores the water contained in intermediate regions.
Large Length Scale Morphology of the Series Containing Fully Sulfonated Polystyrene.The fact that peak 1 essentially
disappears when membranes from series 2 are soaked in the 30-70 solvent mixture and that it is highly attenuated in the 50-50 solvent mixture, as is shown in Figure 7, can be explained in terms of a random two-phase system. In this basic model, peak 1 corresponds to the correlation length between the two phases, consisting of fluorous and hydrated SPS domains. At the length scale being probed in the vicinity of peak 1, both domains appear to be homogeneous, so their respective SLD can be estimated by averaging the SLD of each component weighted by their respective volume fractions. The SLD of the fluorous domains is estimated to be 3.22 × 1010 cm/cm3, the same as for series 1. The SLD of the SPS domains depends on solvent content and the nature of the counterions. The number of H2O molecules (or D2O) per ionic site, known as the λ value, used in this calculation is 35, which is an average
value for series 2 (cf. Table 1). Calculation of the SLD of the SPS domains hydrated with the 30-70 and 50-50 mixtures leads to 3.85 × 10¹⁰ and 2.65 × 1010 cm/cm3, respectively. The SLD of the SPS domains is closest to that of the fluorous domains hydrated by the 30-70 mixture but also similar to that of the fluorous domains hydrated by the 50-50 mixture. This contrast matching of the fluorous domains to the hydrated polystyrene domains leads to an important drop in scattering from the long length scale structure, explaining why peak 1 almost disappears from the scattering curve in these solvent mixtures.
Peak 1 from the second series is considerably broader than the ones in series 1; this implies that series 2 membranes have a larger polydispersity of the correlation distances and are less structured at this length scale. There is no trend in the evolution of peak 1 as a function of the length of the fully sulfonated polystyrene block, as can be seen from examination of Figure 5. The Bragg distances corresponding to the q-position of the peak are 460, 360, and 480 Å for membranes 2A, 2B, and 2C, respectively.
From the combination of TEM images and SANS spectra we can conclude that this series of membranes has a structure consistent with phase separation at length scales of the order of a few hundred angstroms due to the nonmiscibility of the two polymer blocks. But this structure is disordered; there is no evidence of well-defined morphology, such as lamellar, cylindrical, or spherical. On the other hand, the high conductivity in the second series, up to 2.3 × 10⁻²S/cm for membrane 2C, indicates that there is percolation of the hydrated sulfonated polystyrene domains in the membrane.
Small Length Scale Morphology of Both Series. The
analysis of peak 2 leads to a description of small length scale structure in these materials. This peak is least visible in membranes soaked in pure water and the 50-50 mixture; since the SLD of polystyrene, estimated to be 1.41 × 1010cm/cm3,33 is between that of pure water and the 50-50 mixture, we attribute peak 2 to structure within the SPS domains. This small length scale structure can be pictured as hydrated sulfonated polystyrene domains in a hydrophobic polystyrene matrix, as shown in Figure 14. The observation of a peak at around 0.15 Å-1is consistent with other studies of the structure of sulfonated polystyrene, which reveal a peak between 0.1 and 0.3 Å-1, whose position depends on the IEC and water content of the Figure 13. Water content of membranes as estimated from analysis
of neutron spectra (squares) and as measured (circles) for the samples from series 1.
Figure 14. Modified hard-sphere model from Yarusso and Cooper34 used to describe the structure within the sulfonated polystyrene domains in both series. The hydrated ionic aggregates are represented by spheres with a radius r1, arranged in a liquidlike order with a closest approach
distance 2rca.
Figure 15. Sketch of the structure of membranes from series 1. The large-scale lamellar morphology is shown, where the gray scale is consistent with the TEM pictures; the lighter gray corresponds to the fluorous lamellae with a thickness tPVDF, and the darker gray corresponds
to the PS lamellae. Within the PS lamellae there are two different regions: the central region contains hydrated sulfonated polystyrene, with a thickness t; at the extremities thin layers of nonsulfonated polystyrene exist with a thickness s. The white circles within the sulfonated polystyrene domains represent hydrated ionic aggregates.
material. This peak has been analyzed in terms of correlations either within34,35or between36aggregates of the ionic groups. More recent studies on sulfonated polystyrene37 and block copolymers containing sulfonated polystyrene14have confirmed that the origin of the peak is more likely due to interference between ionic group aggregates.
We used the modified hard-sphere model of Yarusso and Cooper34to describe the structure within the sulfonated poly-styrene domains in both series. As shown in Figure 14, the hydrated ionic aggregates are represented by spheres with a radius r1, arranged with liquidlike order, with a closest approach distance 2rca. We can use this model to estimate the size of the aggregates r1and the thickness of the polymer barrier between aggregates tb. r1is obtained from the polymer volume fraction, φp, of the hydrated sulfonated polystyrene which can be expressed as φp≈1 - r13/rca3, where 2rcais obtained from the
q-position of peak 2 and the Bragg relation. For series 1, φpis extracted from the previous neutron analysis. For series 2, an estimate is calculated from the λ values assuming that all the ionic groups are in the aggregates, which gives rise to a polymer volume fraction between 14 and 17%. The calculated radii for both series are presented in Table 3 along with the thickness of the polymer barrier between two aggregates, tb) 2(rca- r1), and the polymer volume fraction.
In series 1, r1 increases as the sulfonation rate increases, ranging from 15 to 22 Å, whereas tbdecreases from 12.5 to 8 Å. So in this series the hydrated aggregates get bigger and closer as the IEC increases, as expected for a classical swelling material. In series 2, r1and tbare constant with a value of about 20 and 2.6 Å, respectively, as the fully sulfonated polystyrene blocks get longer. Considering both series, we can see that increasing the sulfonation rate of the polystyrene block from 22% to 100% leads to a decrease of the barrier between the hydrated ionic groups that should permit better percolation and proton diffusion; this point is discussed later.
Molecular Length Scale Morphology of Both Series. In
the WAXS data, the same peaks are observed at the same position for all samples; the effect of IEC does not appear to be significant at molecular length scales. Nafion 115 shows similar features with two peaks at 1.17 and 2.64 Å-1. In the analysis of Nafion spectra, these two peaks are associated with correlation distances between fluorinated polymer chains and between carbon atoms along the polymer chain, respectively.38 No crystalline peak is observed in the spectra from membranes of series 1, confirming that the addition of hexafluoropropylene in the PVDF polymer block is effective in reducing the natural tendency of PVDF to crystallize. We notice a shoulder on the first peak (black arrows) of the series 2 spectra, which can be interpreted as an emerging crystalline peak. Crystallinity is more likely present in this series since the molecular weight of the fluorous block is larger than series 1 (cf. Table 1).
Summary of Structures Observed by SANS and WAXS.
Figure 15 shows a sketch of the structure of membranes from series 1 as probed by small-angle neutron scattering. At large length scales, the structure is characterized by stacks of hydrated
sulfonated polystyrene lamellae and PVDF lamellae separated by a thin layer of polystyrene. The presence of these thin layers of nonsulfonated polystyrene at the interface between the fluorinated and hydrated sulfonated polystyrene domains can be understood by the fact that hydrated ionic groups are more likely to be located further from the highly hydrophobic fluorinated region. At smaller length scales there is a substruc-ture within the hydrated sulfonated polystyrene, as observed in different block copolymers containing sulfonated polysty-rene.14,16The large length scale structure of membranes from series 2 is characterized by a more random structure but similar structure at smaller length scales.
Relationship between Observed Structure and the Phase Diagram of Diblock Copolymers.It is interesting to compare
the large-scale structures that we observe with the theoretical phase diagram obtained by Matsen and Bates using mean-field theory in the case of uncharged diblock copolymers.5The phase diagram depends on two variables: χN, the product of the Flory-Huggins parameter, χ, and the degree of polymerization of the blocks, N, and the fraction of the total volume occupied by one of the blocks, f. χ represents the degree of segregation between the two blocks; it is usually dependent on the temperature and on the nature of the blocks.
We can estimate f for samples in series 1 in two ways. The first method uses the parameters extracted from the SANS analysis, tPVDF, s, t, and φp, to estimate the volume fraction of the dry polystyrene domains as compared to the dry sample. The value we obtain by this method for all samples in this series, where the length of the PS block is constant, is 0.441. The second method makes use of the molecular weight and the density of both blocks. Using 1.8 and 1.05 g cm-3for the density of the PVDF and PS, respectively, leads to an f of 0.436. The consistency of these results provides additional confirmation of the model developed for this series. In series 2, we must use the second method only as our model is not as sophisticated. In this case, we calculate values for f of 0.063, 0.087, and 0.117 for membranes 2A, 2B, and 2C, respectively.
According to the theoretical phase diagram for uncharged diblock copolymers, series 1 should present a lamellar morphol-ogy over a broad range of χN, which is what is observed by both TEM and SANS. In the case of series 2, the theory predicts a disordered morphology at low χN and a close-packed sphere morphology at higher χN. We observe randomly oriented but poorly defined structure in these fully sulfonated samples. It appears that the combination of χN and f is sufficient for phase separation to occur but not large enough for the development of long-range order.
Note that the estimated values for f are effectively for dry, uncharged membranes. The membranes are cast from polymers dispersed in a nonpolar solvent, but they do swell when hydrated. We have not made any attempt to thermally or otherwise anneal the samples and so it is possible that the structures observed are not in thermodynamic equilibrium. Polydispersity of these systems may also affect the order. Further work will be required to clarify these issues.
Correlation between Structure and Conductivity.
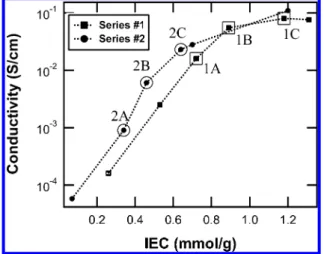
Mea-surements performed on both series show that the conductivities are comparable for similar IEC. Results from Shi and Hold-croft23,25are reproduced in Figure 16; the samples studied by SANS are indicated on the figure by large circles (series 2) or squares (series 1). The conductivity of membranes from series 1 appears to level off and even decrease at high IEC. This observation has been attributed to the decrease in proton concentration observed in these samples when highly
hy-Table 3. Parameters Extracted from the Analysis of Peak 2 Using the Modified Hard-Sphere Model (See Text for Definitions)
sample 2rca(Å) core φp(%) r1(Å) tb(Å) 1A 42.4 65 14.9 12.5 1B 49.2 43 20.4 8.4 1C 51.3 40 21.6 8 2A 14.3 2B 44 17.2 19.8 2.7 2C 44 16.3 20 2.5
drated.23,25 Unfortunately, the membrane with the highest conductivity, which was from series 2, was not studied by SANS because it swelled to a water content of 61% when hydrated and could not be handled easily.
The fact that the large-scale structure of the two series is so different, as seen in both SANS and TEM results, indicates that the large-scale structure may not be very relevant to proton conductivity. On the other hand, the short-scale structure is similar in both series. This is reasonable given that the large-scale structure corresponds to the ordering of the diblock copolymers while the short-scale structure corresponds to the structure of the hydrated polystyrene domains. Proton diffusion occurs within the polystyrene domains, so that structure of these domains should have the largest effect on the conductivity, with the large-scale structure providing a secondary perturbation. In addition, the fact that series 2 presents slightly higher proton conductivity than series 1 for comparable IEC is probably due to better percolation between hydrated ionic aggregates as the sulfonation rate of the polystyrene blocks increases.
Conclusions
We have performed an in-depth structural study of two related, but distinct, fluorous diblock copolymer membranes. We have used complementary techniques of electron microscopy and X-ray and neutron scattering to investigate both large and small length scale structure. Two series of copolymers have been studied; both have a fluorous block and one has a partially sulfonated polystyrene block of constant length while the other has a fully sulfonated polystyrene block of varying length. Large-scale structure, typically a few hundred angstroms, is found to correspond to the ordering of fluorous and hydrated sulfonated polystyrene domains within the membrane. Mem-branes made from partially sulfonated polystyrene blocks are found to present more structured morphology than membranes made from fully sulfonated polystyrene blocks. Small length scale structure, roughly a few tens of angstroms in size, is found to correspond to structure within the hydrated sulfonated polystyrene domains that is due to segregation of the hydro-phobic polystyrene and hydrated sulfonic acid groups. At molecular length scales, ordering of the polymer chains and interatomic spacing was observed. In addition, the variation in large length scale structure did not result in dramatically different conductivities; the less-ordered membranes from series 2 appeared to have slightly better proton conductivities, probably
due to a more favorable structure within the sulfonated polystyrene domains.
Acknowledgment. We acknowledge the support of the
National Institute of Standards and Technology, U.S. Depart-ment of Commerce, in providing the neutron facilities used in this work (proposal number S16-06). We thank Dr. L. Porcar for his help with the neutron scattering experiments. We thank Dr. E. Humphrey and Mr. G. Martens (UBC EMLab) for assistance in TEM.
Appendix
The analytical expression of the form factor of a disk is
where θ is the angle between the scattering wave vector q and the disk axis, t is the thickness and r is the radius of the disk.33 The expression for the form factor of a core-shell disk is given by
where s is the shell thickness. For randomly oriented mono-disperse disks the final form factor must averaged over all θ
Polydispersity is added to the disk thickness in order to be more realistic. A Gaussian distribution G(t0,σ) is used, where σ is the standard deviation and t0is the mean value of the thickness. Finally, the form factor of randomly oriented disks becomes
This last form factor expression of a core-shell disk has been used to calculate the theoretical normalized spectra.
References and Notes
(1) Heitner-Wirguin, C. J. Membr. Sci. 1996, 120, 1. (2) Kerres, J. A. J. Membr. Sci. 2001, 185, 3. (3) Yang, Y.; Holdcroft, S. Fuel Cell 2005, 5, 171. (4) Kreuer, K. D. J. Membr. Sci. 2001, 185, 29.
(5) Matsen, M. W.; Bates, F. S. Macromolecules 1996, 29, 1091. (6) Davidock, D. A.; Hillmyer, M. A.; Lodge, T. P. Macromolecules 2003,
36, 4682.
(7) Ehrenberg, S. G.; Serpico, J. M.; Wnek, G. E.; Rider, J. N. US 5468574, 1995.
(8) Kim, J.; Kim, B.; Jung, B. J. Membr. Sci. 2002, 207, 129. (9) Kim, J.; Kim, B.; Jung, B.; Kang, Y. S.; Ha, H. Y.; Oh, I. H.; Ihn, K.
J. Macromol. Rapid Commun. 2002, 23, 753.
(10) Lee, W. J.; Jung, H. R.; Lee, M. S.; Kim, J. H.; Yang, K. S. Solid
State Ionics 2003, 164, 65.
(11) Lu, X. Y.; Steckle, W. P.; Hsiao, B.; Weiss, R. A. Macromolecules
1995, 28, 2831.
(12) Mauritz, K. A.; Storey, R. F.; Reuschle, D. A.; Tan, N. B. Polymer
2002, 43, 5949.
(13) Mauritz, K. A.; Storey, R. F.; Mountz, D. A.; Reuschle, D. A. Polymer
2002, 43, 4315.
(14) Lu, X.; Steckle, W. P.; Weiss, R. A. Macromolecules 1993, 26, 5876. (15) Weiss, R. A.; Sen, A.; Willis, C. L.; Pottick, L. A. Polymer 1991, 32,
1867.
(16) Weiss, R. A.; Sen, A.; Pottick, L. A.; Willis, C. L. Polymer 1991, 32, 2785.
Figure 16. Conductivity measurements as a function of the IEC for both series at room temperature and 100% relative humidity. The open squares and circles represent membranes studied by SANS.
Fdisk(q,t,r) ) 2 sin
(
q2tcos θ)
q2tcos θ J1(qr sin θ) qrsin θ Pdisk cs(q)∝[
Fdisk(q,t + 2s,r) + t t + 2s Fcore- FshellFshell- Fext Fdisk(q,t,r)
]
2
Pmono(q) )
∫
0 πPdisk cs(q) sin θ dθ
(17) Elabd, Y. A.; Napadensky, E.; Sloan, J. M.; Crawford, D. M.; Walker, C. W. J. Membr. Sci. 2003, 217, 227.
(18) Elabd, Y. A.; Walker, C. W.; Beyer, F. L. J. Membr. Sci. 2004, 231, 181.
(19) Mokrini, A.; Acosta, J. L. Polymer 2001, 42, 9.
(20) Mokrini, A.; Rio, C. D.; Acosta, J. L. Solid State Ionics 2004, 166, 375.
(21) Zhang, G.; Liu, L.; Wang, H.; Jiang, M. Eur. Polym. J. 2000, 36, 61. (22) Mani, S.; Weiss, R. A.; Williams, C. E.; Hahn, S. F. Macromolecules
1999, 32, 3663.
(23) Shi, Z. Q. Thesis of Simon Fraser University, Burnaby, Canada, 2004. (24) Shi, Z.; Holdcroft, S. Macromolecules 2004, 37, 2084.
(25) Shi, Z.; Holdcroft, S. Macromolecules 2005, 38, 4193.
(26) Rollet, A. L.; Gebel, G.; Simonin, J. P.; Turq, P. J. Polym. Sci., Part
B: Polym. Phys. 2001, 39, 548.
(27) Rollet, A. L.; Diat, O.; Gebel, G. J. Phys. Chem. B 2002, 106, 3033. (28) Baruchel, J.; Hodeau, J. L.; Lehmann, M. S.; Regnard, J. R.; Schlenker, C. Neutron and Synchrotron Radiation for Condensed Matter Studies; Springler-Verlag: Berlin, 1993.
(29) Hayter, J. B.; Penfold, J. J. Phys. Chem. 1984, 88, 4589.
(30) Gebel, G. In CEA-Grenoble; Universite Joseph Fourier: Grenoble, 1989.
(31) Rubatat, L.; Gebel, G.; Diat, O. Macromolecules 2004, 37, 7772. (32) This value has been calculated using the online NIST SLD calculator
(http://www.ncnr.nist.gov/resources/sldcalc.html), considering 84% PVDF and 16% HFP in the polymer chain. The density of the fluoropolymer domains has been estimated at the PVDF value of 1.8 g/cm3.
(33) Lindner, P.; Zemb, T. Neutrons, X-rays and Light: Scattering Methods
Applied to Soft Condensed Matter; Elsevier: Amsterdam, 2002.
(34) MacKnight, W. J.; Taggart, W. P.; Stein, R. S. J. Polym. Sci., Polym.
Symp. 1974, 45, 113.
(35) Fujimura, M.; Hashimoto, T.; Kawai, H. Macromolecules 1982, 15, 136.
(36) Yarusso, D.; Cooper, S. Macromolecules 1983, 16, 1871.
(37) Wu, D. Q.; Chu, B.; Lundberg, R. D.; MacKnight, W. J.
Macromol-ecules 1993, 26, 1000.
(38) Starkweather, H. W. Macromolecules 1982, 15, 320.