Publisher’s version / Version de l'éditeur:
Vous avez des questions? Nous pouvons vous aider. Pour communiquer directement avec un auteur, consultez la première page de la revue dans laquelle son article a été publié afin de trouver ses coordonnées. Si vous n’arrivez pas à les repérer, communiquez avec nous à [email protected].
Questions? Contact the NRC Publications Archive team at
[email protected]. If you wish to email the authors directly, please see the first page of the publication for their contact information.
https://publications-cnrc.canada.ca/fra/droits
L’accès à ce site Web et l’utilisation de son contenu sont assujettis aux conditions présentées dans le site LISEZ CES CONDITIONS ATTENTIVEMENT AVANT D’UTILISER CE SITE WEB.
Proceedings 19th International Congress on Acoustics, pp. 1-6, 2007-09-02
READ THESE TERMS AND CONDITIONS CAREFULLY BEFORE USING THIS WEBSITE. https://nrc-publications.canada.ca/eng/copyright
NRC Publications Archive Record / Notice des Archives des publications du CNRC :
https://nrc-publications.canada.ca/eng/view/object/?id=8b7e824a-1908-4d81-8b33-28c3b116e6e4 https://publications-cnrc.canada.ca/fra/voir/objet/?id=8b7e824a-1908-4d81-8b33-28c3b116e6e4
NRC Publications Archive
Archives des publications du CNRC
This publication could be one of several versions: author’s original, accepted manuscript or the publisher’s version. / La version de cette publication peut être l’une des suivantes : la version prépublication de l’auteur, la version acceptée du manuscrit ou la version de l’éditeur.
Access and use of this website and the material on it are subject to the Terms and Conditions set forth at
Rating sound insulation in terms of speech intelligibility
Park, H. K.; Bradley, J. S.; Gover, B. N.
http://irc.nrc-cnrc.gc.ca
R a t i n g s o u n d i n s u l a t i o n i n t e r m s o f s p e e c h
i n t e l l i g i b i l i t y
N R C C - 4 9 5 0 2
P a r k , H . K . ; B r a d l e y , J . S . ; G o v e r , B . N .
A version of this document is published in / Une version de ce document se trouve dans: Proceedings 19th International Congress on Acoustics, Madrid, Sept. 2-7, 2007, pp. 1-6
The material in this document is covered by the provisions of the Copyright Act, by Canadian laws, policies, regulations and international agreements. Such provisions serve to identify the information source and, in specific instances, to prohibit reproduction of materials without written permission. For more information visit http://laws.justice.gc.ca/en/showtdm/cs/C-42
Les renseignements dans ce document sont protégés par la Loi sur le droit d'auteur, par les lois, les politiques et les règlements du Canada et des accords internationaux. Ces dispositions permettent d'identifier la source de l'information et, dans certains cas, d'interdire la copie de documents sans permission écrite. Pour obtenir de plus amples renseignements : http://lois.justice.gc.ca/fr/showtdm/cs/C-42
19
thINTERNATIONAL CONGRESS ON ACOUSTICS
MADRID, 2-7 SEPTEMBER 2007
RATING SOUND INSULATION IN TERMS OF SPEECH INTELLIGIBILITY
PACS: 43.55.Hy
Park, Hyeon Ku, Bradley, John S. and Gover, Bradford N.
National Research Council, Montreal Rd. Ottawa Canada, K1A 0R6
ABSTRACT
This paper describes new listening tests to evaluate various airborne sound insulation ratings in terms of the intelligibility of transmitted speech. In these experiments listeners heard test sentences played, at a fixed level, through 20 different simulated walls in the presence of a constant low-level ambient noise. The results show that the ISO Weighted Sound Reduction Index (Rw) and ASTM Sound Transmission Class (STC) ratings were not good predictors of the
intelligibility of the transmitted speech sounds. However, measures intended to be indicators of the intelligibility of speech, such as the Articulation Index (AI) and the Speech Intelligibility Index (SII) were more strongly related with the mean intelligibility scores. Other measures based on arithmetic averaging of transmission loss values and/or limiting frequencies to those important for speech, led to better predictors of sound insulation ratings. Two more successful approaches were an arithmetic average of transmission loss values over speech frequencies and a new speech spectrum weighting for the ISO Rw procedure.
INTRODUCTION
Airborne sound insulation ratings can be evaluated in terms of their correlation with various subjective ratings of sound insulation. This paper considers sound insulation ratings in terms of the intelligibility of the transmitted speech because speech is a common type of disturbing sound and because speech intelligibility tests can provide accurate subjective ratings.
Airborne sound insulation is rated in terms of the ISO Weighted Sound Reduction Index (Rw) or
the ASTM Sound Transmission Class (STC). Previously, Vian et al. [1] related subjective ratings of sound insulation to frequency limited (125 Hz – 4k Hz) A-weighted level differences. Tachibana et al. [2] found judgements of the loudness of transmitted sounds to be predicted by a simple arithmetic average transmission loss over frequency. Recent research has shown the intelligibility of speech from meeting rooms to be well related to frequency-weighted signal-to-noise ratios [3], suggesting possible new wall transmission loss ratings.
EXPERIMENTAL PROCEDURES
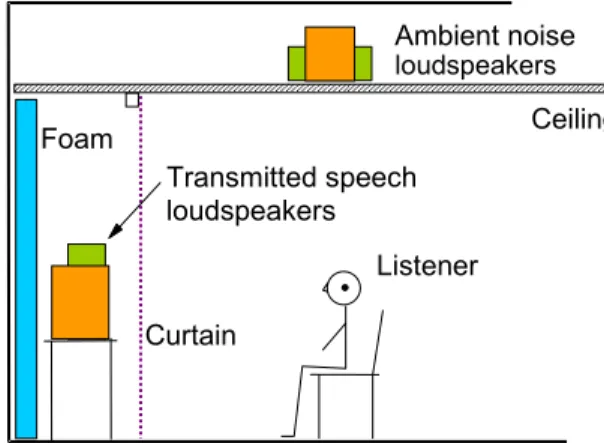
The listening tests were carried out in a sound isolated and acoustically dead test space. Subjects heard speech sounds, modified to include the transmission characteristics of 20 different walls, and presented from loudspeakers in front of them (See Figure 1). At the same
time, noise with a –5 dB/octave spectrum shape and an overall level of 35 dBA was played from loudspeakers above the subject.
Ambient noise loudspeakers Ceiling Curtain Transmitted speech loudspeakers Foam Listener
Figure 1. Schematic of cross-section through Room Acoustics Test Space showing the location of the listener and the loudspeakers used to generate the test sounds.
The characteristics of the 20 simulated walls were chosen to represent a range of STC values evenly distributed from STC 34 to 58 (Rw 33 to 56). They include a variety of construction types
and transmission characteristics as illustrated in Figure 2.
The speech tests used the Harvard sentences [4]. These are phonetically balanced English sentences with content that is of low predictability, which is important to minimize the effects of guessing. The sentences were all recorded by the same clear-speaking male talker. The speech source level and the ambient noise levels were held constant throughout the tests. Only the sound transmission characteristics of the simulated walls were varied.
63 125 250 500 1000 2000 4000 0 10 20 30 40 50 60 70 80 TL, dB Frequency, Hz Wood studs Steel studs Block
Figure 2. Sound Transmission loss versus 1/3-octave band frequency for the 20 walls simulated in the listening tests, where those containing wood studs, steel studs and concrete blocks are separately identified.
Subjects heard 5 different sentences for each of the 20 different simulated walls. The speech intelligibility scores of the 75 combinations of 5 sentences and 15 subjects per wall were averaged and plotted versus various sound insulation ratings.
Boltzmann equations were fitted to the data for each sound insulation measure and the related R2 values compared. The Boltzmann equation is given by the following,
2 / ) ( 2 1 0
1
A
e
A
A
y
dx x x+
+
−
=
−where, A1= y-value for x= -∞ (0% or 100%)
A2= y-value for x= +∞ (0% or 100%)
x0= x-value of mean y-value, that is the x-
value when y=50% in our case
dx = relates to the slope of the mid-part of the regression line.
STANDARD SOUND INSULATION MEASURES
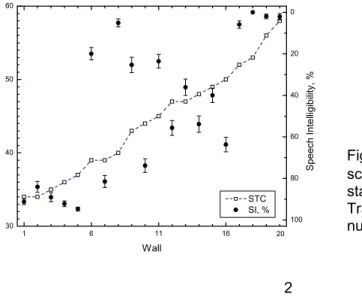
Figure 3 compares the variation of STC values and mean speech intelligibility scores and their standard errors versus wall number with the walls ordered in terms of increasing STC value. Although the even distribution of STC values is evident, the mean intelligibility scores do not closely follow the same trend.
1 6 11 16 30 40 50 60 STC SI, % Wall ST C 20 0 20 40 60 80 100 S p e e c h Inte lligib ilit y , %
Figure 3. Mean speech intelligibility scores with error bars indicating ± 1 standard deviation and Sound Transmission Class (STC) versus wall number.
19th INTERNATIONAL CONGRESS ON ACOUSTICS – ICA2007MADRID
Figure 4 Plots mean intelligibility score versus Rw ratings for the 20 simulated walls. The
intelligibility scores are not well related to the Rw values The plot versus STC values produced
similar results. 30 35 40 45 50 55 60 0 20 40 60 80 100 S p e e ch I n te lli g ib iit y, % Rw
Figure 4. Speech intelligibility scores versus Rw ratings of the simulated walls.
(R2= 0.542).
Further analyses were carried out to explore the details of the STC procedure. First, the ‘8 dB rule’ for the maximum allowed deviation included in the STC procedure was investigated. New STC values were calculated in which the 8 dB rule was varied from a 0 dB to a 16 dB rule. Figure 5 shows the correlation coefficients of these new measures with the mean intelligibility scores. These results suggest that increasing the maximum allowed deficiency to 14 dB or more would increase the correlations with intelligibility scores, as would eliminating the 8 dB rule.
The merits of the maximum allowed combined deficiency of 32 dB, included in both the ASTM and the ISO standards, was similarly tested. The correlation coefficients with mean intelligibility scores in Figure 6 show that the maximum combined deficiency should be 30 dB or more. These results support the use of a 32 dB maximum allowed combined deviation.
-1 -0.9 -0.8 -0.7 -0.6 -0.5 Maximum deficiency Correlation coefficient
Figure 5. Correlation coefficients between mean speech intelligibility scores and a modified STC value for which the maximum acceptable deficiency was varied from 1 to 16 dB, including a no maximum deficiency case in first bar at the left.
-0.68 -0.75 -0.79 -0.81 -0.82 -0.81 -0.82 -0.83 -0.83 -1 -0.9 -0.8 -0.7 -0.6 -0.5 0 10 20 30 32 34 40 50 60 Total deficiency Correlation coefficient
Figure 6. Correlation coefficients between speech intelligibility scores and modified STC values for which the total acceptable deficiency was varied from 0 to 60 dB. (Calculations did not include an 8-dB rule).
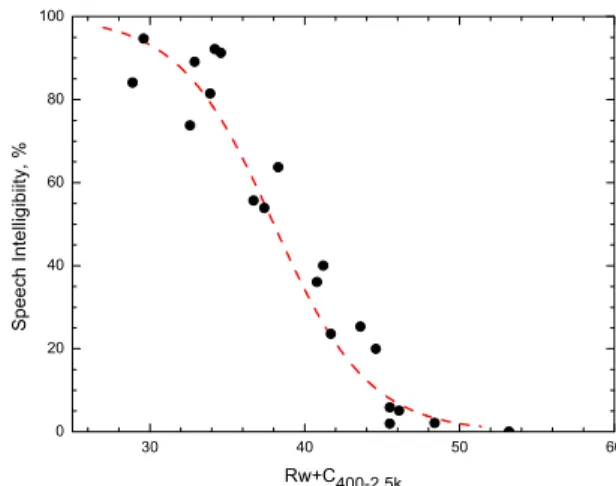
The ISO Standard for airborne sound insulation measurement includes the option of various spectrum correction terms. One is useful for rating sound insulation against outdoor road traffic noise. Another is intended to produce results similar to an A-weighted reduction to a pink noise source. Neither of these spectrum correction terms was helpful in providing better relationships with the speech intelligibility scores. However a new spectrum weighting term was developed that did very successfully improve the relationship with intelligibility scores. The spectrum weighting (C400-2.5k) simply included equally all frequencies from 400 to 2.5k Hz and rejected all
19th INTERNATIONAL CONGRESS ON ACOUSTICS – ICA2007MADRID
other frequencies. Figure 7 shows this new measure to be very strongly related to speech intelligibility scores. 30 40 50 60 0 20 40 60 80 100 Spee ch Inte llig ibi it y , % Rw+C400-2.5k
Figure 7. Speech intelligibility scores versus Rw ratings with an added C400-2.5k –type
spectrum weighting correction for the simulated walls. (R2= 0.957)
SPEECH INTELLIGIBILITY TYPE MEASURES
A number of measures were evaluated that are derived from or related to measures of speech intelligibility. The Articulation Class (AC) is a single number attenuation rating derived from the Articulation Index (AI) and includes the same frequency weightings. Figure 8 shows intelligibility scores to be quite well related to the AC ratings of the walls. The Articulation Index values were similarly well related because in these experiments speech source levels and ambient noise levels were held constant.
40 50 60 70 0 20 40 60 80 100 S p e e c h I n te llig ib iity, % AC
Figure 8. Speech intelligibility scores versus the AC ratings of the simulated walls. (R2= 0.856)
Although many have suggested using A-weighted speech-noise level differences at the listener’s position (SNR(A)) as a simple sound insulation rating, the results in Figure 9 suggest that this is not a good indicator of the expected intelligibility of the transmitted speech.
-15 -10 -5 0 5 10 15 0 20 40 60 80 100 Spe e ch Intell igi b iity , % SNR(A), dBA
Figure 9. Mean speech intelligibility scores versus SNR(A) ratings of the test conditions. (R2=0.259)
19th INTERNATIONAL CONGRESS ON ACOUSTICS – ICA2007MADRID
4
Recent work [3] on the speech security of meeting rooms showed that frequency-weighted signal-to-noise ratios of the transmitted speech and ambient noise levels were good predictors of speech security. In the previous work a weighted signal-to-noise ratio (SNRsii22) with the same
frequency weightings as the Speech Intelligibility Index (SII) was found to best predict the intelligibility of the transmitted speech. Figure 10 shows that these SNRsii22 values were equally
well related to the intelligibility scores in the present study.
-25 -20 -15 -10 -5 0 0 20 40 60 80 100 S p e e ch In te llig ib iity, % SNR sii22, dB
Gover & Bradley
Figure 10. Speech intelligibility scores versus SNRsii22 ratings of the test
conditions. Solid line labelled ‘Gover & Bradley’ is from previous experiment [3]. (R2=0.913)
The AI, SII, AC, SNRsii22 and several other related measures are all based on arithmetic
averages of decibel values over a range of frequencies. Other variations of this concept were also considered including uniform-weighted averages of transmission loss values over various frequency ranges. The most successful was an arithmetic average of transmission loss values from 200 to 2.5k Hz referred to as AA(200-2.5k). In Figure 11 mean intelligibility scores are plotted versus AA(200-2.5k) values. Of all the measures evaluated, this measure produced the strongest relationship with intelligibility scores.
40 45 50 55 60 65 0 20 40 60 80 100 S p e e c h I n te llig ib iity, % AA(200-2.5k), dB
Figure 11. Speech intelligibility scores versus AA(200-2.5k) ratings of the simulated walls. (R2= 0.959).
DISCUSSION
Table 1 summarizes the results presented in this paper and others from the complete study [5]. The standard sound insulation ratings STC and Rw were not strongly related to intelligibility
scores. However, removing the 8 dB rule from the STC rating and limiting the included frequency range improved the R2 values.
Measures in which decibel values over a range of frequencies are arithmetically averaged, were all generally quite successful. These included: AA(160-5k), AA(200-2.5k), AI, SII, SNRai,
SNRsii22, SNRuni32, and AC values. However, when measures included energy averaging of
values at various frequencies, results tended to be less successful (e.g. dBavg(160-5k)). The arithmetic average transmission loss measure AA(200-2.5k) and the Rw measure with the
new spectrum weighting term C400-2.5k provide very good relationships with mean speech
intelligibility scores and are considerable improvements over existing standard measures. The new spectrum weighting is also appealing because it adds to an existing standardized approach. However, these new ratings must now be tested in terms of responses to other types of sounds with different acoustical characteristics than speech.
19th INTERNATIONAL CONGRESS ON ACOUSTICS – ICA2007MADRID
19th INTERNATIONAL CONGRESS ON ACOUSTICS – ICA2007MADRID 6 Symbol F1, Hz F2, Hz R 2 Boltzmann Description STC 125 4k 0.510 Standard STC
STCno8 125 4k 0.661 STC without an 8 dB rule
STCno8 200 4k 0.846 Modified STC without an 8 dB rule
STCno8 200 2.5k 0.922 Modified STC without an 8 dB rule
Rw 100 3.15k 0.542 Standard Rw
Rw 200 3.15k 0.842 Modified Rw
Rw 200 2.5k 0.922 Modified Rw
Rw+C 100 3.15k 0.359 R
w with C-type spectrum correction
Rw+Ctr 100 3.15k 0.205 R
w with Ctr-type spectrum correction
Rw+Cspp 100 3.15k 0.864 R
w with Cspp-type spectrum correction
Rw+C400-2.5k 100 3.15k 0.951 R
w with Csps-type spectrum correction
Rw+COpt 100 3.15k 0.9657 Rw using simplified speech shape rating contour
RwOpt 100 3.15k 0.951 Rw using simplified speech shape rating contour
AA(160-5k) 160 5k 0.853 Arithmetic average transmission loss AAopt(200-2.5k) 200 2.5k 0.959 Arithmetic average transmission loss
AI 200 5k 0.864 Articulation Index
SII 160 8k 0.899 Speech Intelligibility Index
SNRai 200 5k 0.896 AI-weighted signal-to-noise ratio
SNRsii22 160 8k 0.913 SII-weighted signal-to-noise ratio
SNRuni32 160 5k 0.853 Uniform weighted signal-to-noise ratio
SNR(A) 50 8k 0.259 A-weighted speech – noise level difference
AC 200 5k 0.856 Articulation Class
dBavg(160-5k) 160 5k 0.446 Energy average of transmission loss values STA 100 5k 0.361 A-weighted transmission loss
Loudness 25 12.5k 0.305 Zwicker loudness, Sones
Table 1. Summary of R2 values for Boltzmann equation fits to plots of speech intelligibility scores versus various sound insulation ratings as well as lower (F1) and upper (F2) included
frequency.
Acknowledgements
This work was supported by the Korea Research Foundation Grant funded by the Korean Government (MOEHRD) (KRF-2006-352-D00200) to Dr. Hyeon Ku Park.
References
[1] J-P Vian, W.F. Danner and J. W. Bauer, “Assessment of significant acoustical parameters for rating sound insulation of party walls”, J. Acoust. Soc. Am., 73 (4) 1236-1243 (1983).
[2] H. Tachibana, Y. Hamado, and F. Sato, “Loudness evaluation of sounds transmitted through walls – Basic experiments with artificial sounds”, J. Sound Vibr. 127 (3) 499-506 (1988).
[3] B. N. Gover and J.S. Bradley, “Measures for assessing architectural speech security (privacy) of closed offices and meeting rooms,” J. Acoust. Soc. Am. 116 (6) 3480-3490 (2004).
[4] “IEEE recommended practice for speech quality measurements,” IEEE Trans. Audio and Electroacoustics, 17, 227–246 (1969).
[5] H.K. Park, J.S. Bradley and B.N Gover, “Evaluation of Airborne Sound Insulation in Terms of Speech Intelligibility”, IRC Research Report, IRC RR-228, February 2007.