Publisher’s version / Version de l'éditeur:
The Aeronautical Journal, 116, 1179, pp. 451-465, 2012-05
READ THESE TERMS AND CONDITIONS CAREFULLY BEFORE USING THIS WEBSITE.
https://nrc-publications.canada.ca/eng/copyright
Vous avez des questions? Nous pouvons vous aider. Pour communiquer directement avec un auteur, consultez la
première page de la revue dans laquelle son article a été publié afin de trouver ses coordonnées. Si vous n’arrivez pas à les repérer, communiquez avec nous à [email protected].
Questions? Contact the NRC Publications Archive team at
[email protected]. If you wish to email the authors directly, please see the first page of the publication for their contact information.
NRC Publications Archive
Archives des publications du CNRC
This publication could be one of several versions: author’s original, accepted manuscript or the publisher’s version. / La version de cette publication peut être l’une des suivantes : la version prépublication de l’auteur, la version acceptée du manuscrit ou la version de l’éditeur.
Access and use of this website and the material on it are subject to the Terms and Conditions set forth at
A hybrid fuzzy logic proportional-integral-derivative and conventional
on-off controller for morphing wing actuation using shape memory
alloy: part 2, controller implementation and validation
Grigorie, Teodor Lucian; Botez, Ruxandra Mihaela; Popov, Andrei Vladimir;
Mamou, Mahmoud; Mébarki, Youssef
https://publications-cnrc.canada.ca/fra/droits
L’accès à ce site Web et l’utilisation de son contenu sont assujettis aux conditions présentées dans le site LISEZ CES CONDITIONS ATTENTIVEMENT AVANT D’UTILISER CE SITE WEB.
NRC Publications Record / Notice d'Archives des publications de CNRC:
https://nrc-publications.canada.ca/eng/view/object/?id=2061a465-d574-4711-8097-66b12cd76159 https://publications-cnrc.canada.ca/fra/voir/objet/?id=2061a465-d574-4711-8097-66b12cd76159A Hybrid Fuzzy Logic Proportional-Integral-Derivative and Conventional On-Off
Controller for Morphing Wing Actuation using Shape Memory Alloy
Part 2: Controller implementation and validation
Teodor Lucian Grigorie, Ruxandra Mihaela Botez, Andrei Vladimir PopovÉcole de Technologie Supérieure, Montréal, Québec H3C 1K3, Canada
Mahmoud Mamou and Youssef Mébarki
National Research Council, Ottawa, Ontario K1A 0R6, Canada Nomenclature
dY1, dY2 = displacements of the two control points of the flexible skin
e = actuation loop error FFT = Fast Fourier Transforms
Faero = aerodynamic force
i(t) = command variable (electrical current in our case)
KD = derivative gain
KI = integral gain
KO = change in output gain
KP = proportional gain
LVDT = Linear Variable Differential Transducer
M = Mach number
PID = Proportional-Integral-Derivative
RMS = Root Mean Square
Re = Reynolds number
SMA = Shape Memory Alloy
t = time
e = actuation loop change in error α = angle of attack
Keywords
Abstract
The paper presents the numerical and experimental validation of a hybrid actuation control concept -- fuzzy logic
Proportional-Integral-Derivative (PID) plus conventional On-Off -- for a new morphing wing mechanism, using smart materials made of
Shape Memory Alloy (SMA) as actuators. After a presentation of the hybrid controller architecture that was adopted in the part
1, this paper focuses on its implementation, simulation and validation.
The PID On-Off controller was numerically and experimentally implemented using the Matlab/Simulink software. Following
preliminary numerical simulations which were conducted to tune the controller, an experimental validation was performed. To
implement the controller on the physical model, two Programmable Switching Power Supplies (AMREL SPS100-33) and a
Quanser Q8 data acquisition card were used. The data acquisition inputs were two signals from Linear Variable Differential
Transformer potentiometers, indicating the positions of the actuators, and six signals from thermocouples installed on the SMA
wires. The acquisition board’s output channels were used to control power supplies in order to obtain the desired skin
deflections. The experimental validation utilized an experimental bench test in laboratory conditions in the absence of
aerodynamic forces, and a wind tunnel test for different actuation commands. Simultaneously, the optimized airfoils were
experimentally validated with the theoretically-determined airfoils obtained earlier. Both the transition point real time position
detection and visualization were realized in wind tunnel tests.
1. Introduction
Nowadays, aeronautical transport is evolving at a very fast pace, especially when compared to the beginning of the aviation
era. Aeronautical traffic has tripled over the last fifteen years, and by 2025, it is projected to double today’s traffic volume.
This traffic is expected to see an estimated +3.0% increase in the number of passengers per year, to approximately 1 billion by
2016; and by 2025 the passenger increase will be accompanied by a load factor increase of 81.7% as compared to today’s
values [1]. This evolution will require new technological developments in the design and building of modern aircraft equipped
with active control systems.
Over the same time period, fuel cost increases will lead to a slowdown in the aerospace industry, which in turn will stimulate
research to find technological solutions; almost certainly in designing new fuel economy consumption methods. A new green
trend has indeed started to spread out from the automobile into the aircraft industry, in which research is being carried out to
reduce fuel consumption by reducing drag, which is directly related to the airflow type around the aerodynamic aircraft body
laminar and turbulent flows towards the trailing edge.
Numerous studies show that the transition between laminar and turbulent flows is influenced by the shape of the wing airfoil
[2]-[14]. Aerodynamic studies from the beginning of aviation history show that for flight conditions characterized by given
Mach number (M) and Reynolds number (Re), the airflow around a wing airfoil is laminar at the leading edge, but becomes
turbulent at a certain point. Turbulent flow is not desirable because it causes drag to increase, which, over time, leads to higher
fuel consumption, and consequently, increased operating costs.
This research has been realized as part of a major project initiated and financially supported by industries and academia: the
Consortium for Research and Innovation in Aerospace in Quebec (CRIAQ), the National Sciences and Engineering Research
Council of Canada (NSERC), Bombardier Aerospace, Thales Avionics and the National Research Council Canada
(NRC-IAR). The project’s goal is to realize a theoretical and experimental aerodynamic wind tunnel study of a rectangular wing
equipped with a flexible skin, smart actuators and optical sensors, which can change its shape, using an active controller, to
move the position of the transition towards the wing trailing edge.
A rectangular wing model (0.54 m x 0.9 m) with a reference airfoil WTEA-TE1 was manufactured. The lower part of the
mechanical model is an aluminium block designed to allow space for the wiring, while the upper part has an aluminium
structure equipped with a flexible skin made of composite materials (layers of carbon and Kevlar fibers in a resin matrix) and
an actuation system (Shape Memory Actuators (Ni-Ti)). A number of 35 flow conditions were established as combinations of
five Mach numbers (0.2, 0.225, 0.25, 0.275, 0.3) and seven flow incidence angles (-1˚, -0.5˚, 0˚, 0.5˚, 1˚, 1.5˚, 2˚) to test the morphed structure. Starting from the reference airfoil, 35 optimized airfoils were designed for the airflow case combinations of
Mach number and angle of attack.
Part I of this paper established the architecture for a hybrid fuzzy logic Proportional-Integral-Derivative (PID) plus
conventional On-Off controller for the actuation lines of this morphing wing system (Fig. 1). The hybrid controller behaves as
a switch between the SMA cooling and heating phases, in situations where the output current was 0 A, or it is controlled by the
fuzzy logic controller. The shapes chosen for the input membership functions were s-function, π-function, and z-function, and product fuzzy inference and the Sugeno center average defuzzifier were applied.
The following paragraphs present the controller implementation and its numerical and experimental validation.
2. Hybrid controller implementation and numerical simulation
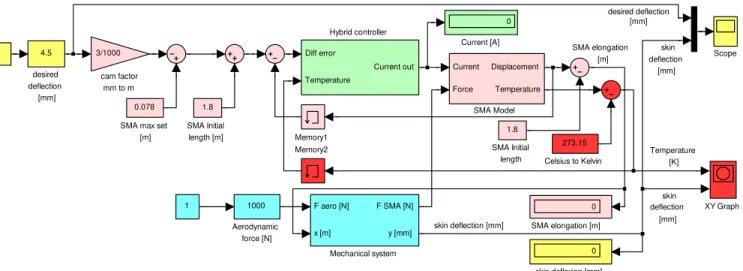
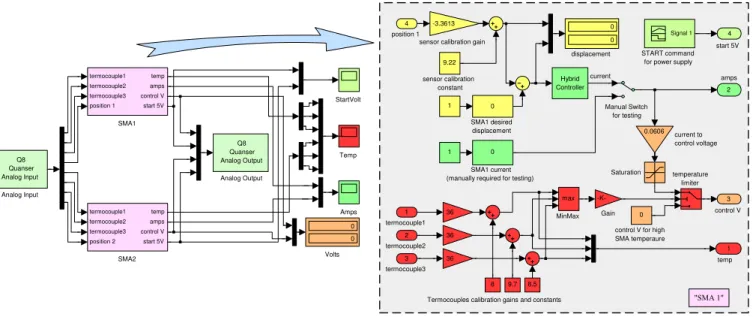
Introducing the controller in a block scheme, the Simulink model shown in Fig. 2 was obtained for the SMA actuators’ control.
Fig. 1 Hybrid controller architecture.
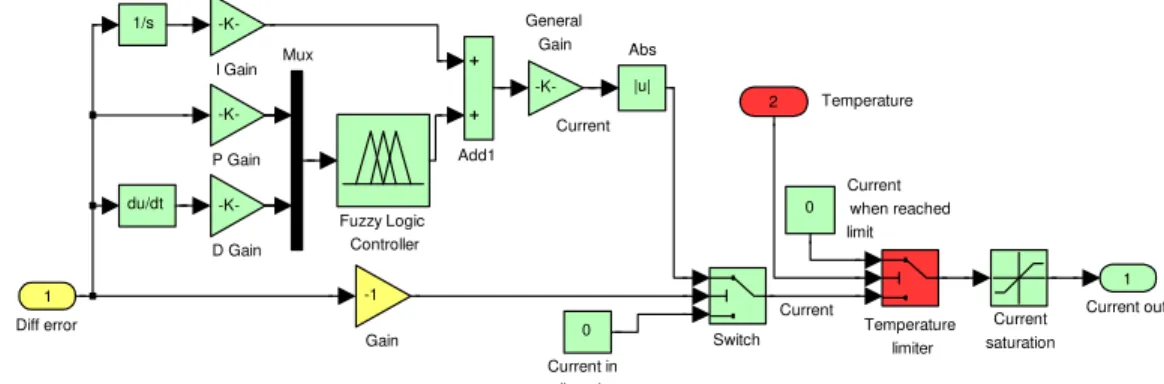
The “Hybrid controller” block contains both the implementation of the controller presented in Fig. 1 and of observations
related to the SMA actuators’ physical limitations in terms of temperature and supplying currents. The detailed Simulink
scheme of this block is shown in Fig. 3. The block has as inputs the control error (the difference between the desired and the
obtained displacements) and the SMA wire temperatures, and its output is the controlled electrical current applied on the SMA
actuators. There are two switches in the scheme; the first switch chooses one of the two options shown in Fig. 1 (error is
positive or not) and the second one switches the electrical current value to 0A when the SMA temperature value is over the
imposed limit. In addition, a current saturation block is used to prevent the current from going over the physical limit
supported by the SMA wires.
Fig. 2 The simulation model for the controlled SMA actuator.
By estimating the aerodynamic forces for all 35 studied flight conditions and optimized airfoils, it was possible to achieve a
balance between the aerodynamic forces and the preloaded forces of the gas spring. The preloaded forces on the gas springs in
the two actuation lines must be valid for all the cases studied. Loading the simulated model with an aerodynamic force Temperature [K] skin deflection [mm] skin deflection [mm] desired deflection [mm] SMA elongation [m] skin deflection [mm] 0 skin deflexion [mm] 1 1 4.5 desired deflection [mm] 3/1000 cam factor mm to m XY Graph Scope 0.078 SMA max set
[m] 0 SMA elongation [m] Current Force Displacement Temperature SMA Model 1.8 SMA Initial length [m] 1.8 SMA Initial length Memory2 Memory1 F aero [N] x [m] F SMA [N] y [mm] Mechanical system Diff error Temperature Current out Hybrid controller 0 Current [A] 273.15 Celsius to Kelvin 1000 Aerodynamic force [N] KP Proportional gain e KD e Derivative gain 1/s KI Integral gain KO Change in output gain e - Membership Functions
e - Membership Functions
Fuzzification Inference Defuzzification s N Z N NB Z NS P Z NS Z PS e /e + + + -i Command e > 0 Desired Deflection superior to Actual Deflection ? Error i=0 for heating phase NO YES i=0 for cooling phase SMA actuator Real deflection Desired deflection e Hybrid controller
Faero=1150 N, and considering a value of 1250 N for the pretension force of the gas springs in “Mechanical system” Simulink
block (see Fig. 2), for a successive steps signal applied to the input of the controlled actuator results in the characteristics
shown in Fig. 4.
Fig. 3 “Hybrid controller” block in Simulink.
Fig. 4 Response for a successive steps input when Faero=1150 N.
The numerical simulation results shown in Fig. 4 confirm that the designed hybrid controller works very well; the variant of
on-off controller combined with a fuzzy PID controller gives very good results in both phases (heating and cooling) of the
SMA actuators. A few seconds of easier latency in the time of the cooling phase with respect to the heating phase can be seen.
In addition, it is clear that the temperature oscillations amplitude is higher with the increase in the level of the actuation
temperature and that this amplitude depends on the loading SMA force.
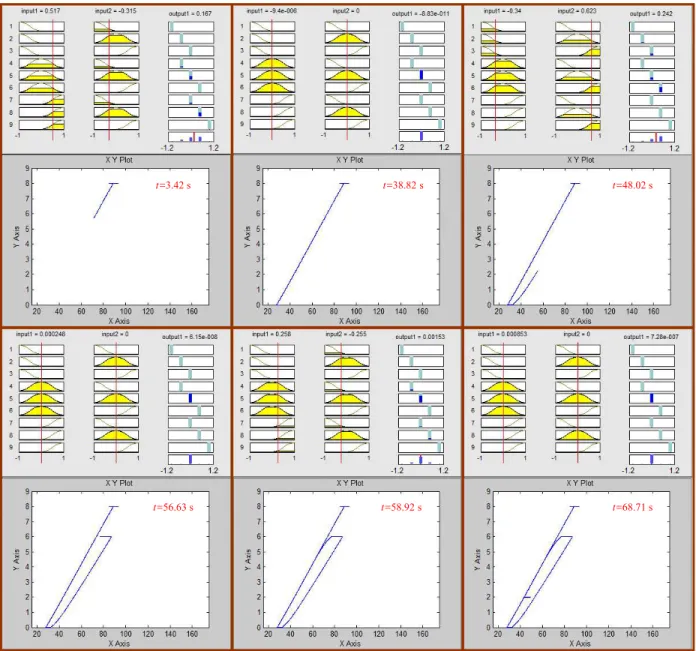
To see how the controller works, some screenshots were taken at different times of the numerical simulation presented in Fig.
4. The screenshots (Fig. 5) highlight the fuzzy model input-output mapping of the six analyzed points (P1÷P6) vis-à-vis of the
SMA temperature-elongation envelope. The chosen time values, shown in Fig. 4, are: 3.42 s (P1), 38.82 s (P2), 48.02 s (P3),
56.63 s (P4), 58.92 s (P5), and 68.71 s (P6). Figure 5 shows that the correspondence between the membership functions of the
inputs and the membership functions of the output through the inference engine of the designed fuzzy model was correctly
established. The same observation can be found by correlating Fig. 5 with the position of the analyzed points in Fig. 4 and with
SM A T emperature [ oC] SMA initialisation 20 40 60 80 100 0 10 20 30 40 50 60 70 80 90 100 Time [s] 900 1000 1100 1200 0 10 20 30 40 50 60 70 80 90 100 Time [s] Force [N] Vertical Displa ceme n
t (desired & obtained)
[mm] -2 -1 0 1 2 3 4 5 6 7 8 9 obtained desired analyzed points SMA initialisation 0 10 20 30 40 50 60 70 80 90 100 Time [s] Temperature analyzed points SMA initialisation Force analyzed points P1 P2 P3 P4 P5 P6 P1 P1 P2 P2 P3 P3 P4 P4 P5 P5 P6 P6 Current 1 Current out Temperature limiter Switch -K-P Gain 1/s -K-I Gain -K-General Gain -1 Gain Fuzzy Logic Controller du/dt -K-D Gain 0 Current in cooling phase Current saturation 0 Current when reached limit Add1 |u| Abs 2 Temperature 1
Diff error Current
the error e and change in error e sign and trend. A very interesting observation in correlating the same figures is that the SMA temperature-elongation envelope evolution (Fig. 5) is a function of the SMA loading forces (Fig. 4). When the
elongation of the SMA is maintained constant by our controller, a constant value for the SMA loading force is obtained (the
horizontal segments in the force diagram in Fig. 4), while the temperature oscillates within a few degrees about the equilibrium
point (the horizontal segments in the SMA temperature-elongation envelope in Fig. 5).
Fig. 5 Fuzzy model input-output mapping of the analyzed points and the SMA temperature-elongation envelope.
3. Bench test and wind tunnel experimental validation
Based on the theoretical and numerical simulations of the morphing wing system, we estimated the limits for the electrical
current used to drive the actuators, correlated with the SMA temperature and SMA loading force. With this information, the
t=3.42 s t=38.82 s t=48.02 s
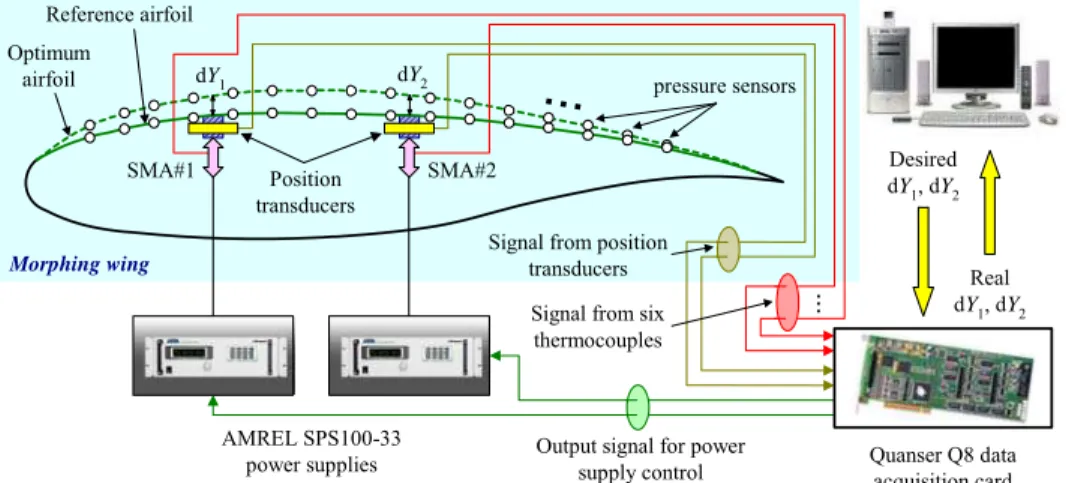
project team decided to use two Programmable Switching Power Supplies AMREL SPS100-33, controlled by Matlab/Simulink
through a Quanser Q8 data acquisition card (Fig. 6) to implement the controller model ([15]÷[17]). The chosen power supplies
have RS-232 and GPIB IEEE-488 as standard features. Among their technical characteristics are: Power 3.3kW, Voltage (dc)
0-100 V, and Current (dc) 0-33 A.
Fig. 6 Bench test physical model operating scheme.
The Quanser data acquisition card has 8 single-ended analog inputs with 14-bit resolution, which can be sampled
simultaneously at 100 kHz, with A/D conversion times of 2.4 µs/channel. The card is equipped with 8 analog outputs, software
programmable voltage ranges, which allow the control of the SMA actuators. A picture of the morphing wing system during
the bench test runs is given in Fig. 7, where the actuators movement is visualized on the computer (the flexible skin was
removed).
Fig. 7 Morphing wing system in the bench test runs.
The Q8 data acquisition card was connected to a PC and programmed via Matlab/Simulink R2006b and WinCon 5.2 (Fig. 8).
Two signals, from Linear Variable Differential Transformer (LVDT) potentiometers, indicating the vertical displacements dY1
and dY2 of the SMA actuators, and six signals from thermocouples installed on each of the SMA wires’ components, were
applied on the analog inputs in a single ended configuration. Two of the card output channels were used to control each power
supply through analog/external control by means of a DB-15 I/O connector. As shown on the right hand side of Fig. 8,
dY1 dY2 SMA#1 SMA#2
...
pressure sensors Optimum airfoil Reference airfoilOutput signal for power supply control AMREL SPS100-33 power supplies Position transducers Quanser Q8 data acquisition card Signal from position
transducers Real
dY1, dY2
...
Signal from six thermocouples Morphing wing
Desired dY1, dY2
modeling the “SMA1” block, the current supplied to the actuator was limited to 10A and the control signal was set to
0-0.6061V (maximum voltage for the power supply is 2V for a 33A electrical current supply). The gas springs that maintain the
SMA wires in tension have a preloaded value of 225 lbs (~1000 N), as in the bench test the aerodynamic force is absent. The
upper limit of the SMA wires’ temperature in the “Temperature limiter” block (see Fig. 3) was established to 130˚C.
The Matlab/Simulink implemented controller was used in the same way for both actuation lines of the morphing wing system.
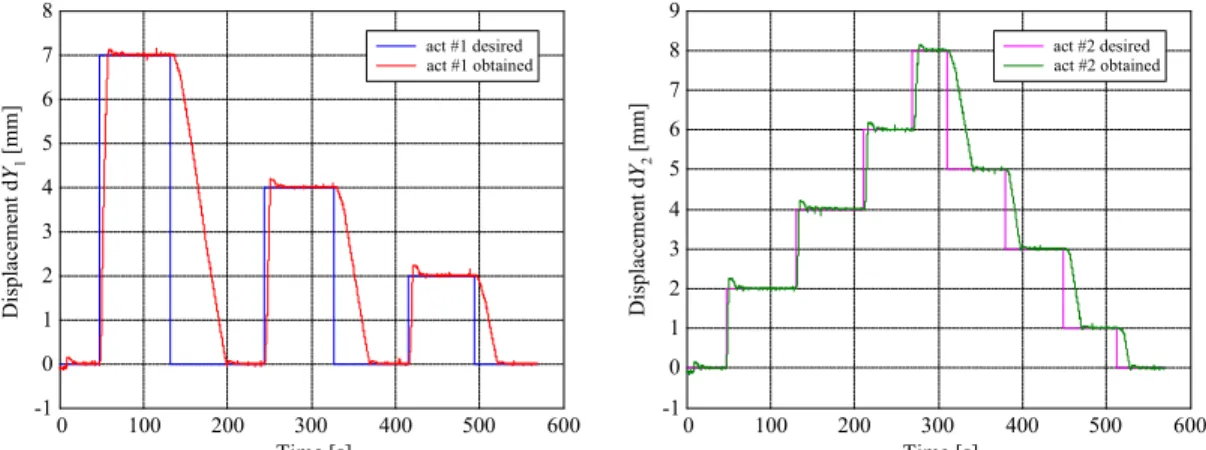
The bench test validation of the controller started with the independent control in time for each of the two actuation lines. The
desired displacements (dY1 and dY2), in the form of successive steps signals, were applied at the input of the actuation lines.
The obtained results presented in Fig. 9 show that the controllers, in the two actuation lines, function even at zero values of the
desired signal owing to the pre-tensioned gas springs. Also, small oscillations of the obtained displacements are observed
around their desired values. The amplitude of the oscillations in this phase is due to the LVDT potentiometers’ mechanical
links (which were not fixed as the model was not equipped with the flexible skin in this test) and to the SMA wires’ thermal
inertia; the smallest amplitude is less than 0.06 mm. The heating phase is more rapid than the cooling phase; heating time is of
the order of a few seconds, while the cooling time is around one minute.
In the next phase of the controller bench tests validation, all pairs of the desired displacements characterizing the 35 optimized
airfoil cases were imposed as input signals on the two actuation lines, while the skin was provisionally mounted on the model.
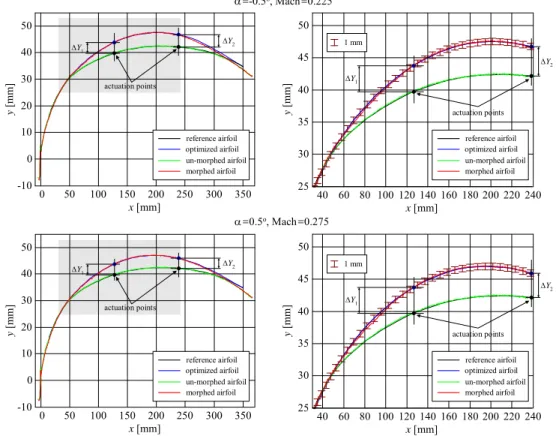
The results are presented in Fig. 10 for flight conditions α=-0.5°, Mach=0.225 (dY1=4.06 mm and dY2=4.58 mm) and α=0.5°,
Mach=0.275 (dY1=4.03 mm and dY2=3.76 mm).
Fig. 8 Matlab/Simulink actuators control during bench tests.
Figure 11 makes the quality of the experimental reproducibility of the theoretical reference and optimized airfoils visible by
showing the un-morphed and morphed airfoils obtained in the two previous controlled cases; it shows the reference airfoil
0 Volts Temp StartVolt termocouple1 termocouple2 termocouple3 position 2 temp amps control V start 5V SMA2 termocouple1 termocouple2 termocouple3 position 1 temp amps control V start 5V SMA1 Q8 Quanser Analog Input Amps Analog Input 0 Q8 Quanser Analog Output Analog Output
Termocouples calibration gains and constants
4 start 5V 3 control V 2 amps 1 temp temperature limiter -3.3613
sensor calibration gain
9.22 sensor calibration constant 0 displacement 0.0606 current to control voltage 0 control V for high SMA temperaure 36 36 36 Saturation Signal 1 START command for power supply
0 SMA1 desired displacement
0 SMA1 current (manually required for testing)
max MinMax Manual Switch for testing -K-Gain 1 8.5 9.7 1 8 4 position 1 3 termocouple3 2 termocouple2 1 termocouple1 0 current Hybrid Controller "SMA 1"
(black), the optimized airfoil (blue), the un-morphed measured airfoil (green) and the morphed airfoil (red). The characteristics
on the left hand side of the figure show the entire airfoil, while the characteristics on the right hand side present a zoom of the
airfoil between 30 mm and 240 mm. The experimental airfoil coordinates were measured using a laser beam that scanned the
center line of the wing model. The global deviation obtained for the optimized airfoil (brown) is under 0.4 mm, while in the
actuation points it is under 0.05 mm.
Fig. 9 Bench tests for desired displacements in the form of successive steps signals.
Fig. 10 Bench tests for α=-0.5°and Mach=0.225, and α=0.5° and Mach=0.275 flight conditions.
From the numerical values obtained for all 35 optimized airfoil cases, it was observed that the position control error due to the
heating-cooling cycles when the actuator maintains a desired position was less than 0.05 mm.
The bench test results confirmed that the experimental version of the designed hybrid controller works well in bench test
conditions, where no aerodynamic forces are loaded and the preloaded gas spring’s force is 1000N.
The next step in our morphing wing project was to validate the obtained hybrid controller in a wind tunnel test.
Simultaneously, were validated the 35 optimized airfoils theoretically obtained. In this way the transition point real time
position detection and visualization were performed.
A typical test for one of the 35 flight conditions consisted of a wind tunnel tare run, followed by a run for the reference (un-
Disp lacement d Y2 [mm] -1 0 1 2 3 4 5 6 7 8 9 0 100 200 300 400 500 600 Time [s] act #2 desired act #2 obtained 0 100 200 300 400 500 600 -1 0 1 2 3 4 5 6 7 8 Time [s] Disp lacement d Y1 [mm ] act #1 desired act #1 obtained Dis p lacements d Y1 an d d Y2 [mm ] Time [s] -1 0 1 2 3 4 5 0 50 100 150 200 250 300 350 act #1 desired act #1 obtained act #2 desired act #2 obtained =-0.5o, Mach=0.225 act #1 desired act #1 obtained act #2 desired act #2 obtained Dis p lacements d Y1 an d d Y2 [mm ] 0 50 100 150 200 250 300 Time [s] -0.5 0 0.5 1 1.5 2 2.5 3 3.5 4 4.5 =0.5o, Mach=0.275
morphed) airfoil, and finally a run for morphed airfoil, reproducing the corresponding optimized airfoil.
The controller morphed the reference airfoil by acting on the two SMA actuation lines until the optimized airfoil was achieved.
For both test runs (un-morphed and morphed airfoils), the transition real time location and its visualization demonstrated the
validity of all of the optimized airfoils that had been obtained theoretically. This mechanism corresponds to the open loop
architecture of the morphing wing system, when no feedback for the pressure sensors is used.
Fig. 11 Theoretical versus experimental airfoils for the cases controlled in Fig. 10.
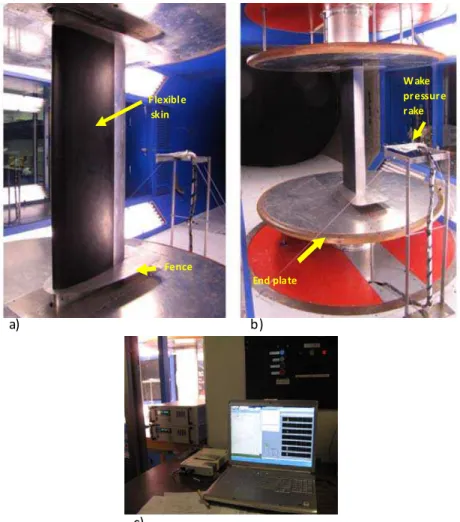
The experimental model was tested in the test section of the 2m×3m (2 m high by 3 m wide) NRC atmospheric closed-circuit
wind tunnel. The model setup is shown in Fig. 12-(a). The wing model was mounted vertically in the wind tunnel test section,
between two circular end plates. To promote 2D-flow over the wing span, fences were incorporated at both ends of the wing,
inboard of the circular end plates. A wake rake was mounted at the wing mid-span, and at a distance of 0.53 m behind the
model trailing edge, to measure total pressure losses, as shown in Fig. 12-(b). The wake rake consisted of 38 Pitot probes and
four static pressure probes, regularly spaced at 6.35 mm. In most of the wind tunnel runs, 10 to 12 Pitot probes were found to
be located within the wing wake, and this number was judged sufficient for accurate wake drag computation.
For transition detection, 12 Kulite pressure sensors provided real-time signals, with the sensors aligned on the flexible skin
along the wing chord. In this way, the IAR-NRC analog data acquisition system was connected to the pressure sensors and the
acquired data were processed and visualized in real time using Matlab/Simulink software. To detect the magnitude of the noise
in the surface air flow, Fast Fourier Transform (FFT) decomposition was used. A high-pass filtering was performed and,
=-0.5o, Mach=0.225 =0.5o, Mach=0.275 x [mm] y [mm] -10 0 10 20 30 40 50 Y1 Y2 0 50 100 150 200 250 300 350 actuation points reference airfoil optimized airfoil un-morphed airfoil morphed airfoil y [mm] 1 mm Y2 Y1 25 30 35 40 45 50 x [mm] 40 60 80 100 120 140 160 180 200 220 240 actuation points reference airfoil optimized airfoil un-morphed airfoil morphed airfoil y [ mm] 1 mm Y2 Y1 25 30 35 40 45 50 x [mm] 40 60 80 100 120 140 160 180 200 220 240 actuation points reference airfoil optimized airfoil un-morphed airfoil morphed airfoil x [mm] y [mm] -10 0 10 20 30 40 50 Y1 Y2 0 50 100 150 200 250 300 350 actuation points reference airfoil optimized airfoil un-morphed airfoil morphed airfoil
following the calculation of the Root Mean Square (RMS) of the signal, the RMS was plotted to obtain the surface flow noise
diagram (see Fig. 12-c).
Fig. 12 Wing model installed in the NRC 2m×3m wind tunnel: a) upper surface side view, b) view of the model trailing edge
looking upstream, c) Control hardware and computer program
In support of the discrete pressure instrumentation, infrared thermography (IR) visualization was used to detect the transition
location on the morphing wing upper surface. The transition detection method using IR is based on the differences in laminar
and turbulent convective heat transfer coefficients. In the resulting images, the sharp temperature gradient separating high
temperature regions and low temperature regions is an indication of the transition location. The infrared camera used was an
Agema SC3000 camera, equipped with a cooled 240×320 pixels QWIP detector, operating in the long infrared wavelength
region. The camera provided a resolution of 0.02°C and a maximum frame rate of 60 Hz. It was equipped with the default lens
(FOV = 20°×15°). Optical access was provided through an opening on the side wall of the test section opposite to the upper
surface. More details about the methodology and processing are available in [18]-[19].
The sampling rate of each channel of the data acquisition system was 15 kS/s, which allowed a boundary layer pressure
fluctuation FFT spectral decomposition of up to 7.5 kHz for all channels. Following an analysis of the wind tunnel test results,
F lexibl e skin W ake pr essure r ake End plate Fence a) b) c)
it was concluded that for the controlled morphed airfoils the transition appeared at frequencies between 3 ÷ 5 kHz and the
magnitudes of the pressure variations in the laminar flow boundary layer were on the order of 5e-4 Pa (7.25e-8 psi). The
transition between laminar and turbulent flows was shown by an increase in the pressure variations, and further indicated by a
strong variation of the pressure signal RMS.
For the wind tunnel tests, the preloaded forces of the gas springs were reconsidered as 1500 N because of the presence of the
aerodynamic forces on the flexible skin of the wing. The control results for test run α=1° and Mach=0.225 (dY1=4.92 mm,
dY2=7.24 mm) are shown in Fig. 13. The results obtained by the transition monitoring for this test run are shown in Fig. 14.
Fig. 13 Wind Tunnel Test for α=1° and Mach=0.225.
Fig. 14 Transition point real-time position detection and visualization.
The FFT of the pressure signals obtained from the 12 pressure sensors are indicated in the upper plot area of Fig. 14, while the
lower plot area of Fig. 14 shows the N factor (perturbation global amplification factor) for both airfoils (reference and
-1 0 1 2 3 4 5 6 7 8 D isplacemen ts d Y1 an d d Y2 [m m] Time [s] 0 50 100 150 200 250 act #1 desired act #1 obtained act #2 desired act #2 obtained -1 0 1 2 3 4 5 6 7 8 D isp la cements d Y1 and d Y2 [m m] Temperature [oC] 20 25 30 35 40 45 50 55 60 65 70 =1o, Mach=0.225 act #1 act #2
un-morphed airfoil morphed airfoil
optimized), respectively the normalized RMS for 12 pressure sensors.
From the experimental results, a high-frequency noise appears to be influencing the LVDT sensors and the thermocouple’s
instrumentation amplifiers. The noise sources are the wind tunnel vibrations and the instrumentation electrical fields. Even
with this noise, the amplitudes of the actuation errors (the difference between the experimental and the desired deflections) are
less than 0.05 mm, which does not affect the transition location -- which is stable on a sensor with a high RMS spike. The left
column of Fig. 14 presents the results for the reference airfoil, and the column on the right shows the results for the optimized
airfoil. The spike of the RMS suggests that there is turbulence on sensor no. 10, near the wing trailing edge. The same result
can be observed by a comparative study of the FFT curves for un-morphed and morphed airfoils.
As can be seen in Fig. 13, the designed controller works very well in the wind tunnel, being positively influenced by the
aerodynamic forces presence. A positive impact of the aerodynamic forces presence was also observed in the reduced values of
the SMA wires’ work temperatures with respect to those for the numerically simulated and bench tested cases. The decrease of
these temperatures is beneficial, considering the negative impact of a strong thermal field on the other system components,
especially on the flexible skin and on the pressure sensors.
Fig. 15: Infrared measurements of the transition location on the flexible portion of the wing upper surface for M = 0.275, = 0.5°, various control methods: a) no control, b) open-loop, c) close-loop. Transition location (x/cTR) highlighted with
dotted line and given in images (in %). Flow is from left to right.
The infrared measurements were used to support the transition prediction obtained from the Kulite pressure transducers and to
visualize the extent of the laminar flow on the wing upper surface for the various control configurations. Figure 15 shows
typical infrared results obtained at M = 0.275 and = 0.5° for various control methods. The white spots on the wing are the electronically heated Kulite pressure transducers. The two lines of SMA actuators, hotter or colder than the model surface, are
a) Reference (no optimization)
x/c
TR=27%
La
m
in
a
r
Turbulent
x/c
TR=58%
Laminar
T
u
rbule
n
t
b) Open‐loop control (C225)x/c
TR=59%
Laminar
T
u
rbule
n
t
c) Close‐loop control (Fuzzy logic)also visible at quarter chord and near mid-chord. The locations of the transition in the images have been highlighted using a
white dashed line: it corresponds to the location of a sudden surface temperature gradient, the laminar region being generally
2°C hotter than the turbulent region. The reference airfoil configuration (Figure 15-a) showed a transition location at x/c =
27%. The open loop control (Figure 15-b) allowed a transition location at x/c = 58%. In the case of the closed loop control
using fuzzy logic, (Figure 15-c), the transition location was x/c = 59%, which is sensibly equivalent to the open loop control,
considering the error on the infrared transition detection (1% x/c at 2).
4. Conclusions
The approaches for the validation of a hybrid fuzzy logic proportional-integral-derivative plus conventional on-off controller
used in the actuation of a morphing wing were presented.
The Matlab/Simulink numerical simulation results confirm that the obtained hybrid controller works very well. A few seconds
of easier time latency in the cooling phase vis-à-vis the heating phase was noted. Also, the amplitude of temperature
oscillations was observed to increase with an increase in the actuation temperature level, and depending on the load SMA
force.
The bench test validation of the controller started by considering the independent control in time for each of the two actuation
lines. In this way, the two desired displacements (dY1 and dY2) in the form of successive step signals were applied at the inputs
of the actuation lines. The results obtained during this validation phase showed that the controllers in the two actuation lines
functioned even at zero values of the desired signal because of the gas springs’ pre-tension. Small oscillations of the obtained
displacements were observed around their desired values. The amplitude of the oscillations in this phase have as principal
explanations the LVDT potentiometers’ mechanical links (which were not completely fixed because the model was not
equipped with the flexible skin during this test) and the thermal inertia of the SMA wires.
In the next phase of the controller bench test validation, all pairs of the desired displacements characterizing the 35 optimized
airfoil cases were imposed, such as input signals on the two actuation lines, while the skin was mounted on the model. For
each of the experimentally obtained airfoils, the coordinates were measured using a laser beam that scanned the center line of
the wing model. The global deviation obtained for the optimized airfoil was found to be under 0.4 mm. From the numerical
values obtained for all 35 optimized airfoil cases, we observed that the position control error due to the heating-cooling cycles
when the actuator maintains a desired position was less than 0.05 mm.
In the next validation step, a wind tunnel test was performed. Simultaneously, using the hybrid controller, the 35 theoretically
real-time position. The experimental results indicated a high-frequency noise that was influencing the LVDT sensors and the
thermocouple’s instrumentation amplifiers. Wind tunnel vibrations and the instrumentation’s electrical fields were identified as
the sources. Even with these noises, the amplitudes of the actuation error (the difference between the realized deflections and
desired deflections) were less than 0.05 mm, and do not affect the transition, which is stable on a sensor with a high RMS
spike. Also, a positive influence of the aerodynamic forces’ presence on the designed controller was observed in the reduced
values of the SMA wires’ work temperatures compared to those for the numerically simulated and bench tested cases. The
decrease of these temperatures is beneficial considering the negative impact of a strong thermal field on the other system
components, especially on the flexible skin and the pressure sensors.
The infrared measurements were used to validate the pressure sensor - based transition detection method. Comparisons of the
open loop and closed loop controls using the infrared results have shown that both approaches were very effective in delaying
the transition location, thus reducing the skin friction drag, as confirmed by the wake rake drag measurements.
As a general conclusion, the designed hybrid controller fully satisfied the requirements imposed to achieve the purpose of our
morphing wing project.
Future work on this project will focus on developing a closed loop control, based on the pressure information received from
the sensors and on the transition point position estimation. Closed loop control will certainly include, as an internal loop, the
actuation lines’ controller presented here.
Acknowledgements
The authors would like to thank the Consortium for Research and Innovation in Aerospace in Quebec (CRIAQ), Thales
Canada and Bombardier Aerospace for their financial and technical support. The authors also wish to express their
appreciation to Mr. George Henri Simon for initiating the CRIAQ 7.1 project and to Mr. Philippe Molaret from Thales Canada
for their collaboration in this work.
References
[1] Nan Shellabarger, 2008, National Forecast Overview 2008-2025, Director Aviation Policy and Plans, Federal Aviation
Administration.
[2] Barrett, R., 2007, Improvements to commercial and general aviation via adaptive aerostructures, Paper
[3] Bye, D. R., McClure, P.D., 2007, Design of a morphing vehicle, Paper AIAA-2007-1728, pp. 321-336.
[4] Jacob, J. D., 1999, Aerodynamic flow control using shape adaptive surfaces asme, Paper No. DETC99/VIB-8323, ASME
17th Biennial Conference on Mechanical Vibration and Noise, Symposium on Structronics, Mechatronics, and Smart
Materials, Las Vegas, Nevada, September.
[5] Martins, A.L., Catalano, F.M., 1998, Viscous drag optimization for a transport aircraft mission adaptive wing,
ICAS-98-31499 Melbourne, Australia.
[6] Munday, D., Jacob, J. D., and Huang, G., 2002, Active flow control of separation on a wing with oscillatory camber, 40th
AIAA Aerospace Sciences Meeting, Reno, NV. Paper AIAA-2002-0413.
[7] Namgoong, H., Crossley, W., A., Lyrintzis, A., S., 2006, Morphing airfoil design for minimum aerodynamic drag and
actuation energy including aerodynamic work, AIAA Paper 2006-2041, pp. 5407–5421.
[8] Neal, D. A., Farmer, J., Inman, D., 2006, Development of a morphing aircraft model for wind tunnel experimentation,
Paper AIAA-2006-2141, pp. 6443-6456.
[9] Pinkerton, J. L., Moses, R. W., 1997, A feasibility study to control airfoil shape using THUNDER, Langley Research
Center, Hampton, Virginia, NASA Technical Memorandum 4767.
[10] Rodriguez, A. R., 2007, Morphing aircraft technology survey, Paper AIAA-2007-1258.
[11] Sanders, B., Eastep, F., E., Foster, E., 2003, Aerodynamic and aeroelastic characteristics of wings with conformal control
surfaces for morphing aircraft, Journal of Aircraft, Vol. 40(1), pp. 94-99.
[12] Skillen, M. D., Crossley, W. A., 2005, Developing response surface based wing weight equations for conceptual
morphing aircraft sizing, Paper AIAA-2005-1960, pp. 2007-2019.
[13] Sobieczky, H., Geissler, W., 1999, Active flow control based on transonic design concepts , DLR German Aerospace
Research Establishment, AIAA Paper 99-3127.
[14] Vos, R., De Breuker, R., Barrett, R., Tiso, P., 2007, Morphing wing flight control via postbuckled precompressed
piezoelectric actuators, Journal of Aircraft, Vol. 44(4), pp 1060-1067.
[15] Kirianaki, N.V., Yurish, S.Y., Shpak, N.O., Deynega, V.P., 2002, Data Acquisition and Signal Processing for Smart
Sensors. John Wiley & Sons.
[16] Park, J., Mackay, S., 2003, Practical data acquisition for instrumentation and control systems, Elsevier, UK.
[17] Austerlitz, H., 2003, Data acquisition techniques using PCs, Elsevier, USA.
[18] Y. Mébarki, M. Mamou and M. Genest, Infrared Measurements of Transition Location on the CRIAQ project Morphing
[19] M. Mamou, Y. Mébarki, M. Khalid, M. Genest, D. Coutu, A.V. Popov, C. Sainmont, T. Georges, L. Grigorie, R.M.
Botez, V. Brailovski, P. Terriault, I. Paraschivoiu, E. Laurendeau, Aerodynamic Performance Optimization of a Wind
Tunnel Morphing Wing Model Subject to Various Cruise Flow Conditions, 27th
International Congress of the Aeronautical
Sciences, Nice, France, 19-24th September 2010.
View publication stats View publication stats