Publisher’s version / Version de l'éditeur:
Advances in Cement Research, 21, 2, pp. 59-66, 2009-04-01
READ THESE TERMS AND CONDITIONS CAREFULLY BEFORE USING THIS WEBSITE.
https://nrc-publications.canada.ca/eng/copyright
Vous avez des questions? Nous pouvons vous aider. Pour communiquer directement avec un auteur, consultez la
première page de la revue dans laquelle son article a été publié afin de trouver ses coordonnées. Si vous n’arrivez pas à les repérer, communiquez avec nous à PublicationsArchive-ArchivesPublications@nrc-cnrc.gc.ca.
Questions? Contact the NRC Publications Archive team at
PublicationsArchive-ArchivesPublications@nrc-cnrc.gc.ca. If you wish to email the authors directly, please see the first page of the publication for their contact information.
NRC Publications Archive
Archives des publications du CNRC
This publication could be one of several versions: author’s original, accepted manuscript or the publisher’s version. / La version de cette publication peut être l’une des suivantes : la version prépublication de l’auteur, la version acceptée du manuscrit ou la version de l’éditeur.
For the publisher’s version, please access the DOI link below./ Pour consulter la version de l’éditeur, utilisez le lien DOI ci-dessous.
https://doi.org/10.1680/adcr.2008.00008
Access and use of this website and the material on it are subject to the Terms and Conditions set forth at
Applicability of the Hedvall effect to study the reactivity of calcium silicate hydrates
Alizadeh, R.; Beaudoin, J. J.; Ramachandran, V. S.; Raki, L.
https://publications-cnrc.canada.ca/fra/droits
L’accès à ce site Web et l’utilisation de son contenu sont assujettis aux conditions présentées dans le site LISEZ CES CONDITIONS ATTENTIVEMENT AVANT D’UTILISER CE SITE WEB.
NRC Publications Record / Notice d'Archives des publications de CNRC:
https://nrc-publications.canada.ca/eng/view/object/?id=b81f7145-73da-43f2-bd9e-41402db8414f https://publications-cnrc.canada.ca/fra/voir/objet/?id=b81f7145-73da-43f2-bd9e-41402db8414f
http://irc.nrc-cnrc.gc.ca A p p l i c a b i l i t y o f t h e H e d v a l l e f f e c t t o s t u d y t h e r e a c t i v i t y o f c a l c i u m s i l i c a t e h y d r a t e s
N R C C - 5 0 2 8 4
A l i z a d e h , R . ; B e a u d o i n , J . J . ; R a m a c h a n d r a n , V . S . ; R a k i , L .2 0 0 8 - 1 0 - 2 3
A version of this document is published in / Une version de ce document se trouve dans: Advances in Cement Research, v. 21, no. 2, April 2009, pp. 59-66, DOI:10.1680/adcr.2008.00008
The material in this document is covered by the provisions of the Copyright Act, by Canadian laws, policies, regulations and international agreements. Such provisions serve to identify the information source and, in specific instances, to prohibit reproduction of materials without written permission. For more information visit http://laws.justice.gc.ca/en/showtdm/cs/C-42
Les renseignements dans ce document sont protégés par la Loi sur le droit d'auteur, par les lois, les politiques et les règlements du Canada et des accords internationaux. Ces dispositions permettent d'identifier la source de l'information et, dans certains cas, d'interdire la copie de documents sans permission écrite. Pour obtenir de plus amples renseignements : http://lois.justice.gc.ca/fr/showtdm/cs/C-42
Date written: January 2008
Applicability of the Hedvall Effect
to Study the Reactivity of Calcium Silicate Hydrates
Rouhollah Alizadeh, James J. Beaudoin, Vangipuram S. Ramachandran and Laila Raki
Institute for Research in Construction, National Research Council, Ottawa ON, Canada K1A 0R6 Tel. 613-993-5117; fax: 613-954-5984; E-mail: rouhollah.alizadeh@nrc.ca
Number of Words: 4683 Number of Tables: 1 Number of Figures: 12
Abstract
The Hedvall effect was used to investigate the reactivity of calcium silicate hydrates (C-S-H) with variable C/S ratios. The solid state reaction between silver nitrate and various C-S-H preparations occurring during the crystalline transition of silver nitrate was
evaluated. Thermal methods as well as microscopic and XRD analyses were employed to study the nature of the reaction products and estimate the chemical reactivity of the C-S-H systems. The overall reactivity includes cationic and anionic species i.e. both calcium and silica enter into the reaction. Silver silicate was identified as one of the reaction products.
Introduction
Two materials that are totally unreactive with each other at room temperature in the solid state may react at higher temperatures when one of them undergoes a crystalline
transition. The rate and extent of these surface activated chemical reactions in the solid state that basically depend on the structural imperfections are normally increased during and as a consequence of crystalline transformation in materials [1, 2]. The
thermodynamic changes during this reaction can be detected with a thermal analysis instrument and can be used for investigating the chemical reactivity of a solid material. This type of reaction, commonly known as the Hedvall effect, has been applied for studies of the interaction between various chemical compounds, including alkaline oxides and silver salts [3]. Ramachandran and Sereda applied this technique for the first time in
cement science to study the reactivity of some cement compounds such as C3S∗, βC2S,
hydrated C3S and Ca(OH)2 [4]. They concluded that C3S was 4 times more reactive than
βC2S.
The structure of amorphous calcium silicate hydrate (C-S-H), the main reaction product of the hydration of Portland cement, is not fully resolved [5]. Synthesized, crystalline C-S-H has been studied for its role in cement chemistry [6-8]. Chemical stability of the cementitious materials in various environments is one of the important issues related to the sustainable development and durability. Evaluation of the chemical reactivity of different C-S-H preparations is essential for the development of more chemically stable cement-based materials. In their study, Ramachandran and Sereda concluded that all the Ca in C-S-H, including that in the interlayer, is equally reactive [4].
A variation in the C/S ratio of the C-S-H results in different physical and chemical characteristics of the material, although the nanostructure has similarities [9, 10]. There are also at least two distinct types of C-S-H present in the hydration products of Portland cement [11-14]. In this study, the relative reactivities of C-S-H (with different C/S ratios),
Ca(OH)2 and hydrated C3S were evaluated applying Hedvall effect. There is a reaction
between the mixture of each of these materials and AgNO3 when they are heated through
the transition temperature of silver nitrate (~190 °C) and they quickly form a reciprocal
pair∇. An exothermic peak on cooling in a TGA-DSC experiment, due to the
recrystallization of the unreacted silver nitrate was observed. The peak area is calibrated
∗
so that the amount of unreacted AgNO3 can be determined for each reaction. The relative
reactivities of the compounds can be evaluated by a comparison of the percentage of reacted silver nitrate with respect to the estimated C-S-H formula weight.
Experimental Procedure
Materials
C-S-H samples, with five different C/S ratios, were prepared using stoichiometric
amounts of CaO and amorphous SiO2. The CaO was produced by heating precipitated
CaCO3 at 900°C for 24 h. The CaO was purged with nitrogen gas and stored in a
desiccator. The amorphous silica (Cabosil) was dried by heating at 110°C overnight. The C-S-H samples at C/S ratios of 0.6, 0.8, 1.0, 1.2 and 1.5 were formed as follows. The reactants were placed in high-density polyethylene (HDPE) bottles. Distilled
decarbonated water was then added (water/solid ratio = 10) and the bottles were
continuously rotated (16 rpm) for a period of 180 days at room temperature. The gel-like material was then filtered to remove excess water and dried under vacuum for 4 days and then stored in nitrogen purged glass vials.
Hydrated C3S (30 years) at a w/s of 0.50 was also investigated. Reagent grade silver
nitrate (Fisher Scientific) and calcium hydroxide from Anachemia were used.
The C-S-H, Ca(OH)2 and hydrated C3S were ground with a mortar and pestle and dried
through mesh No. 100. A mixture of 90% AgNO3 and 10% of each of the samples by
mass was placed in amber glass vials and shaken for 1 minute using a Spex mixer in order to get a homogenous mixture of dry reactants.
TGA-DSC
A 7 mg sample from the blended material was heated to 250 °C in a simultaneous (TGA-DSC) SDT Q600 T.A. instrument at 10 °C/min under the 100 mL/min flow of nitrogen gas. The sample was held at this temperature for 10 minutes. It was then cooled at 10 °C/min to 100 °C. This test was also conducted on pure silver nitrate and C-S-H. Mass change and heat flow measurements were determined. The test was repeated for the C-S-H samples in order to minimize any errors due to possible inhomogeneity of the mixtures. Results were interpreted based on the average of the two readings.
For calibration purposes, DSC was conducted on a series of samples containing mixtures
of various percentages of SiO2 (ground silica sand) and AgNO3. Since there is no
chemical reaction between silica and silver nitrate, the area under the exothermic peak is
attributed to AgNO3. A calibration curve was obtained by plotting this area versus
different proportions of the silver nitrate. The DSC was also conducted on an empty crucible with a 10mg platinum wire in order to correct the baseline deviation.
X-Ray Diffraction
The residue after heat treatment in the TGA was collected from the crucible for XRD analysis. The x-ray diffraction measurements were performed using a Scintag XDS 2000
diffractometer and CuKα radiation. Spectra were obtained in the range 4 < 2θ < 85
using a step size of 0.03 at 5 sec. intervals.
SEM-EDS
SEM images were collected using an Hitachi S-4800 Field Emission Scanning Electron Microscope. Surface structure images were taken using a beam current of 10 mA at
3.2x10⁻¹⁶ J (2 KV). Images were acquired using an integrated frame capture with 32
frames to reduce random noise, at a working distance of 8 mm and each area of interest was captured using a series of field magnifications from 5K to 80K. Back scattered images were obtained for approximate elemental composition. Energy dispersive
spectrometry (EDS) was used to determine the elemental content of areas of interest. The
EDS spectra were acquired using a beam current of 10 mA at 3.2x10⁻¹⁵ J (20 KV).
Spectral images and data were obtained using a working distance of 15 mm. Semi-quantitative results were based on ZAP software database reference values and are an indication of relative elemental content rather than absolute values as no reference standards were used.
Material Characterization
The thermogravimetric curves (mass loss versus temperature) were qualitatively and quantitatively similar to that reported for the C-S-H gel [15]. In the C-S-H preparations
with C/S ratios higher than 1.5, some free Ca(OH)2 remained. The C/S ratio of these
samples is therefore usually lower than the initial proportions. TGA shows that almost no free lime exists in other C-S-H preparations.
Results and Discussion
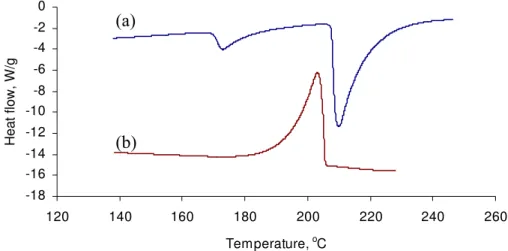
The applicability of the Hedvall effect described in this study relates to the interaction of cement hydrates (C-S-H) and silver nitrate by heating the mixture from ambient to 250 °C. Pure silver nitrate has two endothermic peaks in the heating cycle at 174 and 210 °C (Figure 1-a). The first one is due to the α to β crystalline transition and the second peak is caused by the transition from solid to liquid phase [16]. On cooling, however, there is only one exothermic peak (at 202 °C) indicative of the re-crystallization of silver nitrate (Figure 1-b) [4]; there is no mass change.
It appears that both endothermal events on heating merge into one single exothermal event on cooling. This is based on the observation that if reheated, the residue from the first heat cycle produces exactly the same two endothermal peaks. However, the heat equilibrium conditions are not fully satisfied as evidenced by the sum of the areas under
the endothermal peaks that is greater than the area under the exothermal peak. It is suggested that other phenomena may be involved that fulfill the requirements for equilibrium since all peaks are reproducible.
The calibration curve of the exothermic peak that occurs on cooling based on the heat flow in the mixture of silver nitrate and silica is shown in Figure 2. There is a linear correlation between the area under the exothermal peak and the amount of initial silver nitrate in the mixture. This calibration curve can be used as a reference to estimate the area under the exothermic peak if the total amount of silver nitrate remains unreacted
(A0). When a reaction occurs between the test material and some of the silver nitrate, the
area of the exothermic peak (Ax) representing the amount of unreacted silver nitrate will
be less than A0. Therefore an estimate of the reacted amount of AgNO3 (R AgNO3) can be
expressed as
R AgNO3 = 1 – Ax/A0
The chemical reactivity of calcium hydroxide and C-S-H can accordingly be evaluated as described in the following sections.
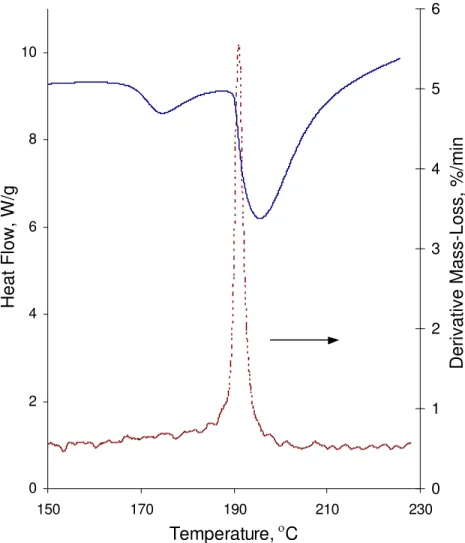
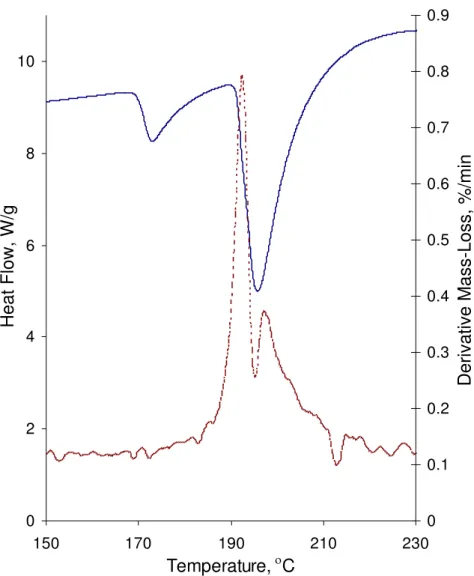
The heat flow and mass change derivative obtained by TGA-DSC analysis of the mixture of reagent grade calcium hydroxide and silver nitrate are shown in Figure 3. On heating, there is a sharp peak in the mass-loss derivative curve at the temperature of almost 190 °C. It is situated at a temperature between that of the two endothermic peaks (heat flow
curve) close to the initiation temperature of the second peak. It is known that the solid-state reactions happen in association with the crystallographic transformation solid-state and at the temperatures that approximately coincide with appreciable self-diffusion of the reactants [1, 17]. This mass loss accompanies the decomposition of the reactants and the
release of some gas from the system as a result of the reaction. Possible gases can be H2O
from the decomposition of the calcium hydroxide or H2 from unstable silver hydroxide
that can be formed during the chemical reactions. However, the reaction product itself does not appear to have an obvious effect on the heat flow curve. This might be
interpreted to mean that as a result of the Hedvall effect the final products consist of only a mixture of decomposed materials. It should be noted, however, that none of these materials taken separately decompose at this temperature.
On cooling, there is an exothermic peak (not shown) corresponding to the
recrystallization of unreacted silver nitrate. Using the calibration curve, it is possible to
estimate the reacted proportion of silver nitrate (RAgNO3), which is 37.8%. Therefore,
assuming that two moles of AgNO3 react with 1 mole of Ca(OH)2, it is estimated that
74.2% of the calcium hydroxide has reacted. Theoretically, all of the Ca(OH)2 should
react with AgNO3. The 25.8% of the calcium hydroxide that did not react, might possibly
be due to the relatively high rate of heating since the reaction between Ca(OH)2 and
AgNO3 might not be instantaneous [18].
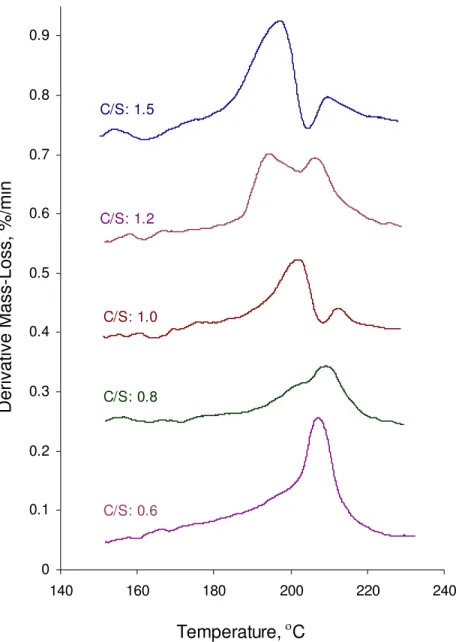
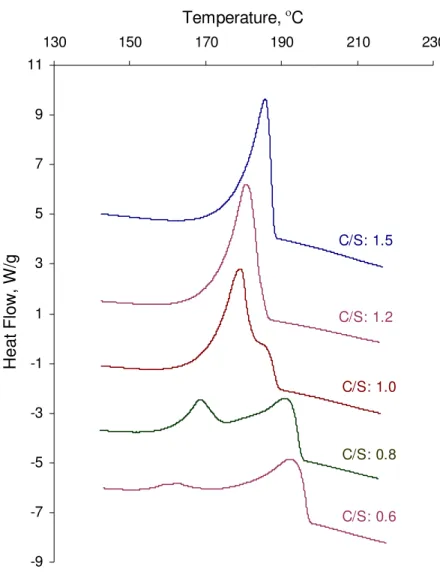
Results for the heat flow curve and the mass loss derivative as a result of the Hedvall effect in the study of C-S-H on heating are shown in Figures 4 and 5. The two
endothermic peaks on heating (Figure 4) are similar to that occurring in pure silver nitrate. However, there is small shift at the start of the second peak for C/S ratios of 1.2 and 1.5. Mass loss derivative curves (Figure 5) reveal a mass loss near the temperature of the second endothermic peak. It is noticed that there are two peaks on the mass loss derivative curve for C/S of 1.0, 1.2 and 1.5, occurring at the temperatures of about 196 °C and 208 °C, respectively. The temperature of the first peak is very close to that in the
reaction between reagent grade Ca(OH)2 and silver nitrate (Figure 3). It is also known
that in C-S-H with a high C/S ratio, there is some free lime and Ca2+ in the interlayer
region [5]. It is suggested that the first peak is associated with minor amounts of
Ca(OH)2. The second peak, which is also present in low C/S ratio C-S-H, is probably an
indication of the association of interlayer lime within the structure of the C-S-H.
In the TGA-DSC experiments the same heating cycle on pure C-S-H (not shown) did not result in any endothermic or exothermic peak within the range of temperatures utilized in the Hedvall effect study and the mass loss was trivial compared to that caused by reaction with silver nitrate. As mentioned in the materials section, the C-S-H was initially dried at 100 °C before the Hedvall effect experiments. This treatment removes almost all the evaporable water.
The heat flow and mass-loss derivative curves of mixtures of hydrated C3S and silver
nitrate (Figure 6) are very similar to those for the C-S-H – silver nitrate mixture prepared at C/S ratio of 1.5. The existence of two peaks on the mass-loss derivative curve can be considered as additional evidence for the similarity between the chemical properties of
synthetic C-S-H with C/S ≅ 1.5 and naturally forming C-S-H produced in the hydration
of Portland cement [19]. Also the mass-loss derivative peaks for the hydrated C3S are
sharper than those for the C-S-H formed through the reaction of CaO and SiO2. This is
probably due to the existence of more crystalline free lime in the hydration of C3S in
addition to the calcium hydroxide within the structure of C-S-H since Ca bonds at similar structural locations are likely to be active at the same temperature. In C-S-H with variable C/S ratio it is suggested that the various degrees of local polymerization may result in a wider range of temperature under which a solid-state reaction occurs.
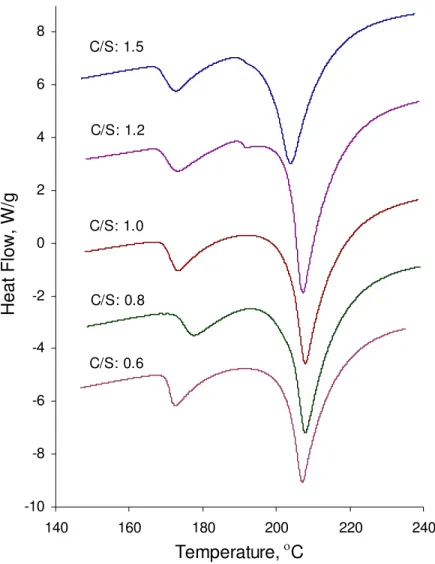
The heat flow cooling curves for C-S-H samples are presented in the figure 7. There is an obvious difference between the exothermic peaks of C-S-H at C/S ratios of 1.0 and below. C-S-H samples with a high C/S ratio (i.e. 1.2 and 1.5) have just a single peak on cooling that is an indication of the recrystallization of unreacted silver nitrate. This peak occurs at a temperature of about 183 °C and is similar to the location of the
corresponding peak following the reaction of Ca(OH)2 with AgNO3. C-S-H at lower C/S,
however, exhibits two exothermic peaks at temperatures of about 191 and 165 °C. C-S-H at C/S=1.0, demonstrates intermediate behavior. A second peak exists as a shoulder on the main peak. Different characteristics have been observed in C-S-H systems depending on the C/S ratio with a transition occurring at the C/S ratio of 1.0-1.2 [14].
The formation of these two peaks suggests the possibility that two different crystalline materials are solidifying on cooling. It may also be a result of recrystallization of silver nitrate at different temperatures caused by the existence of nearby molecules in the bulk
mixture of the materials with different heat capacities. In order to evaluate this, an XRD analysis was conducted on the residue after the reaction of C-S-H (C/S:0.6) with silver nitrate. The XRD spectrum matches well with that of pure silver nitrate (Figures 8-a and 8-b). It is an indication of only one phase caused by the masking effect of a large amount
of unreacted AgNO3 present in the residue.
In order to examine this possibility, a mixture of 10% silver nitrate and 90% C-S-H (C/S:
0.6) was prepared for the Hedvall effect test. All the AgNO3 is consumed in the reaction
with an excessive amount of C-S-H and the residue would contain some unreacted C-S-H and the reaction products. XRD analysis was conducted on this residue (Figure 8-c). This spectrum is different from that of pure C-S-H (C/S: 0.6, Figure 8-d) and has additional relatively high intensity peaks at about 31-36 degrees 2θ.
The JCPDS database was searched for possible fits. Based on the initial assignments for the reaction product, the main peaks of silver silicate (ID NO. 37-0344) with the chemical
formula of Ag2SiO3 appeared to conform well to these unknown peaks marked in Figure
8-c. The research work upon which this spectrum was based, employs a solid state reaction between calcium silicate or sodium silicate and silver nitrate in a heating cycle up to the temperature of 300 °C [20]. It is thus possible that silver silicate forms in the
solid state reaction between C-S-H and AgNO3.
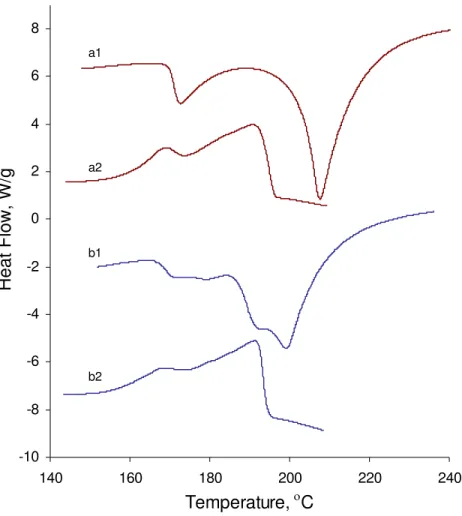
Further evidence was obtained by conducting a TGA-DSC experiment on the residue after the solid state reaction between C-S-H and silver nitrate. Heat flow curves for a
second cycle of heating and cooling are presented in Figure 9. The heating cycle results in shoulders on both endothermic peaks. This suggests that if a new product has formed it has a phase transformation and melting point similar to silver nitrate. On cooling, two peaks are also observed again.
The residue of the reaction between silver nitrate and the excessive amount of C-S-H (C/S: 0.6) was heated up to 1000 °C (curve not shown). There is only one significant mass loss at temperatures between 390 and 540 °C with a peak in the derivative mass loss curve at 467 °C. A gradual mass loss up to 950 °C exists that can be attributed to the decomposition of C-S-H. The main mass loss (about 3.7%) at 467 °C seems to be related to the silver silicate as its different crystalline forms have been reported to have a
decomposition temperature of 400 or 461 °C [20, 21].
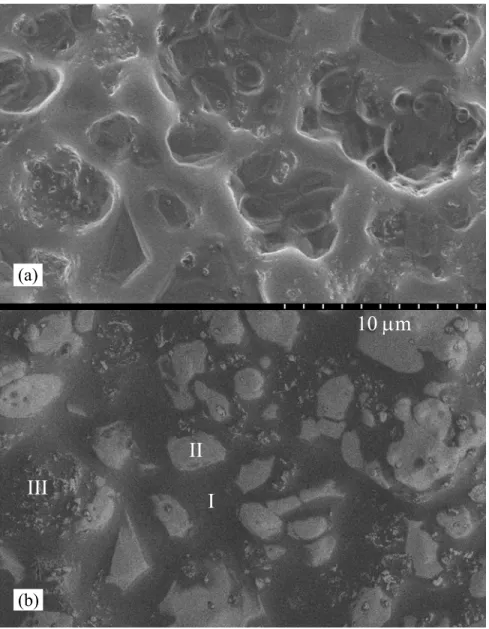
Electron microscopic analysis of the residues remaining after TGA for various C/S ratio C-S-H preparations reveals three different phases. Micrographs in the figures 10 and 11 show the normal and back-scattered imaging of the surface morphology of the residue for a C/S ratio of 0.6 and 1.5. In both cases, there is a dense background (I) in which there are large solid particles (II) as well as smaller granular elements (III). Due to the large difference of the atomic number of Ag and other elements in this reaction, the
backscattered images were proven useful. Whiter areas in the micrographs 10-b and 11-b are indicative of Ag-rich environments. EDS analysis confirmed that these particles contain only Ag. EDS results also show that in the background there is mixture of Ag, Ca and Si that is likely the main reaction product. In the small granular elements that
generally have angular shape, Ag and Si exist but no Ca. A high resolution SEM image of one of these particles is shown in figure 12. This compound might be a crystalline form of the silver silicate evidenced by XRD and TGA results. The morphology of this particle
has similarities with those micrographs for the product in the Ag2O-SiO2 system [22].
The presence of two exothermic peaks in the cooling cycle of the heat flow curves for C-S-H – silver nitrate mixtures indicate that silver nitrate recrystallizes at two different temperatures. Therefore, the area under both exothermic peaks should be taken into account in the reactivity calculations. It should also be noted that the overall reactivity of the C-S-H represents the reaction of both cationic and anionic species in the structure of C-S-H.
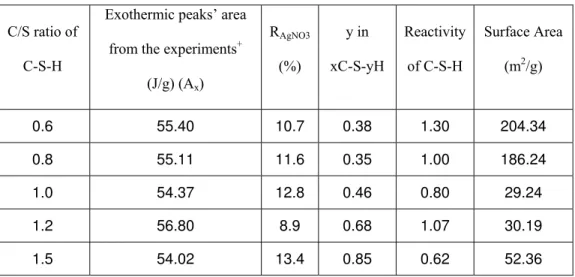
The area under exothermic peaks in the Hedvall effect test for various C/S ratio C-S-H materials is given in table 1. There is not a significant difference in the area between various C/S ratios. The exothermic peak area from the calibration is also about 92.5 J/g for all tests since the mix proportions were similar. Accordingly, the reacted silver nitrate (RAgNO3) can be calculated. In order to evaluate the reactivity of C-S-H, we need an
estimate of its stoichiometry first. C-S-H is not a highly crystalline material and it is very
difficult to precisely determine the proportion of CaO, SiO2 and H2O in its structure [23].
In this study we simply used the TGA instrument to heat the sample (at a rate of 10 °C/min under the flow of nitrogen gas) up to 100 °C. The sample was kept at the
temperature for 3 hours. The temperature increase was then continued to 1000 °C and the mass loss in this part of the heating cycle was considered to be due the removal of
chemical water in the structure of C-S-H. Using a pre-determined CaO/SiO2 ratio, the
stoichiometry can then be calculated. This approach was considered satisfactory for the Hedvall effect test. The stoichiometric formula was expressed as xCaO.SiO2.yH2O, where ‘x’ is the C/S ratio. The values of ‘y’ are given in Table 1. The formula weight of C-S-H was expressed as 56.1x+60.1+18y. Formula weights were used since molar weights of C-S-H are indeterminate due to the ill-formed nanostructure. Thus the number of formula weights of C-S-H in the mixture can be calculated for different C/S ratios. The reactivity of C-S-H is therefore expressed by the number of formula weights of C-S-H
reacted per mole of AgNO3.
The chemical reactivity of C-S-H determined by the Hedvall effect test, decreases as C/S
ratio increases (Table 1) with the exception of C/S=1.2. At low C/S ratio more SiO2 sites
are available for producing silver silicate. More reactive Ca++ might also be present in the
structure of C-S-H. Therefore, more silver nitrate is consumed in the solid state reaction with C-S-H of low C/S ratio. It is assumed that all C-S-H is reacted in the Hedvall effect
test [4] and the amount of reacted AgNO3 is an indication of the overall reactivity of
C-S-H.
Surface area of C-S-H increases significantly at low C/S ratios (0.6 and 0.8) as shown in the Table 1. The chemical reactivity of a material is generally dependent on its surface area. In this study, although the chemical reactivity of C-S-H determined by the Hedvall effect is the highest corresponding to the highest surface area, the reactivity does not necessarily correlate with the surface area. This may indicate that other factors such as
nanostructural defects, the reactivity of the interlayer lime and the structural bonds of the various elements (Ca and Si) can influence the reactivity of C-S-H.
Conclusions
1) The Hedvall test is a very quick and elegant method of evaluating the reactivity of various compounds of relevance to cement chemistry. This method can be used to determine the overall reactivity of C-S-H systems.
2) Silver silicate is formed as a result of the solid state reaction between silver nitrate and calcium silicate hydrate.
3) C-S-H preparations having lower C/S ratios are generally more reactive. 4) Various factors such as the presence of interlayer calcium hydroxide, the
structural locations of Ca and Si as well as the surface area influence the overall chemical reactivity of C-S-H
References
[1] Rees A. L. G., Chemistry of the defect solid state, John Wiley & Sons Inc. pp 136, 1954
[2] Schmalzried H., Solid state reactions, Verlag Chemie GmbH, pp 214, 1971
[3] Hedvall J. A., Solid state chemistry-Whence, where and whither, Elsevier publishing company, pp 100, 1966
[4] Ramachandran V.S. and Sereda P., Applications of Hedvall effect in cement chemistry, Nature physical science, 233 [42] 134-135, 1971
[5] Taylor H. F. W., Cement Chemistry – 2nd edition, Thomas Telford Publishing, pp 459, 1997
[6]Greenberg S. A., "Calcium Silicate Hydrate (I)," J. Phys. Chem., 58 [4] 362–367,
1954
[7] Faucon P., Delaye J. M., Virlet J., Jacquinot J. F., and Adenot F., "Study on the Structural Properties of C–S–H (I) by Molecular Dynamics Simulation," Cem. Concr. Res., 27 [10] 1581–90, 1997
[8] Alizadeh R., Beaudoin J. J., Raki L., “C-S-H (I) – A Nanostructural Model for the Removal of Water from Hydrated Cement Paste?,” J Am Ceram Soc 90 [2] 670–672, 2007
[9] Beaudoin J. J., Feldman R. F., Baron J., Conjeaud M., “Dependence of degree of
silica polymerization and intrinsic mechanical properties of C-S-H on C/S ratio,” 8th
International congress on the chemistry of cement, Rio de Janeiro, Brazil, Theme 2, Vol. III, 337-342, 1986
[10] Grutzeck M., Benesi A., Fanning B., Silicon-29 Magic Angle Spinning Nuclear Magnetic Resonance Study of Calcium Silicate Hydrates, J Am Ceram Soc., 72 [4] 665-668, 1989
[11] Chen J.J., Thomas J.J., Taylor H.W.F., Jennings H.M., Solubility and structure of calcium silicate hydrate, Cem Concr Res 34 [9] 1499-1519, 2004
[12] Constantinides G., Ulm F-J., The effect of two types of C–S–H on the elasticity of cement-based materials: results from nanoindentation and micromechanical
modeling, Cem Concr Res; 34 [1] 67–80, 2004
[13] Richardson I.G., The nature of the hydration products in hardened cement pastes, Cem Concr Comp 22 [2] 97–113, 2000
[14] Cong X., Kirkpatrick R. J., 29Si MAS NMR study of the structure of calcium silicate
hydrate, Advn Cem Bas Mat, 3 [3-4] 144-156, 1996
[15] Taylor H.F.W., Proposed structure of calcium silicate hydrate gel, J Am Cer Soc, 69 [6] 464-467, 1986
[16] Gordon S. and Campbell C., Differential thermal analysis of inorganic compounds – Nitrates and perchlorates of alkali and alkaline earth group and their subgroups, Analytical chemistry, 27 [7] 1102-1109, 1955
[17] Cohn G., Reactions in the solid state, Chem. rev., 42, 527-579, 1948
[18] Sato T., Application of the nanotechnology for the sustainable development of cement-based materials, PhD dissertation, Civil Engineering Department, University of Ottawa, pp 171, 2006
[19] Taylor H.F.W., Nanostructure of C-S-H: current status, Advn Cem Bas Mat, 1 [1] 38-46, 1993
[20] Thilo V.E., Wodtcke F. “Über die ,,neutralen” Silbersilicate: Ag4SiO4, (Ag2SiO3)n,
(Ag2Si2O5)n und AgAl2[AlSi3O10](OH)2; ihre Herstellung und Eigenschaften. Mit
einer Bemerkung über die Silbercyanwasserstoffsäure H[Ag(CN)2]” Z. Anorg. Allg.
Chem. 295, 247-261, 1958
[21] Linke C., Jansen M. “Subvalent Ternary Silver Oxides: Synthesis, Structural
Characterization, and Physical Properties of Pentasilver Orthosilicate, Ag5Si04”
Inorg. Chem. 33, 2614-2616, 1994
[22] Satyanarayana N., Xie X. and Rambabu B., Sol–gel synthesis and characterization of
the Ag2O–SiO2 system, Materials Science and Engineering B, 72 [1] 7-12, 2000
[23] Nonat A. “The structure and stoichiometry of C-S-H” Cement and Concrete Research 34 [9] 1521–1528, 2004
Table 1. Chemical reactivity calculations for C-S-H (various C/S ratios)
C/S ratio of C-S-H
Exothermic peaks’ area from the experiments+
(J/g) (Ax) RAgNO3 (%) y in xC-S-yH Reactivity of C-S-H Surface Area (m2/g) 0.6 55.40 10.7 0.38 1.30 204.34 0.8 55.11 11.6 0.35 1.00 186.24 1.0 54.37 12.8 0.46 0.80 29.24 1.2 56.80 8.9 0.68 1.07 30.19 1.5 54.02 13.4 0.85 0.62 52.36 +
Figures -18 -16 -14 -12 -10 -8 -6 -4 -2 0 120 140 160 180 200 220 240 260 Temperature, oC Heat flow, W /g (a) (b)
Figure 1. Heat flow curve of pure silver nitrate (a) on heating (b) on cooling
y = 0.7369x - 5.931 R2 = 0.989 0 20 40 60 80 10 20 30 40 50 60 70 80 90 100
Initial amount of AgNO3, %
Area under exothermal peak, J/g
Figure 2. The calibration curve for the area of the exothermic peak in heat flow versus the initial amount of silver nitrate if remains completely unreacted
0 2 4 6 8 10 150 170 190 210 230 Temperature, οC Heat Flow, W/g 0 1 2 3 4 5 6
Derivative Mass-Loss, %/min
.
Figure 3. Derivative mass and heat flow curves for the Calcium Hydroxide-Silver Nitrate mixtures on heating
-10 -8 -6 -4 -2 0 2 4 6 8 140 160 180 200 220 240 Temperature, οC Heat Flow, W/g C/S: 1.5 C/S: 0.6 C/S: 0.8 C/S: 1.0 C/S: 1.2
Figure 4. Heat flow curve on heating for C-S-H – Silver Nitrate mixture (Endothermic Down). The C/S ratio of the C-S-H varies from 0.6 to 1.5.
0 0.1 0.2 0.3 0.4 0.5 0.6 0.7 0.8 0.9 140 160 180 200 220 240 Temperature, οC
Derivative Mass-Loss, %/min
. C/S: 1.5 C/S: 0.6 C/S: 0.8 C/S: 1.2 C/S: 1.0
Figure 5. Derivative mass loss curves for mixtures of C-S-H preparations at various C/S ratios and silver nitrate on the heating cycle
0 2 4 6 8 10 150 170 190 210 230 Temperature, οC Heat Flow, W/g 0 0.1 0.2 0.3 0.4 0.5 0.6 0.7 0.8 0.9
Derivative Mass-Loss, %/min
.
Figure 6. Derivative mass-loss and heat flow curves for fully hydrated C3S subjected to a
-9 -7 -5 -3 -1 1 3 5 7 9 11 130 150 170 190 210 230 Temperature, οC Heat Flow, W/g C/S: 1.5 C/S: 1.2 C/S: 1.0 C/S: 0.8 C/S: 0.6
Figure 7. Heat flow curve on cooling for C-S-H – Silver Nitrate mixtures. The C/S ratio varies from 0.6 to 1.5 (Exothermal Up)
15 20 25 30 35 40 45 50 55 60 65
2θ, degree
Intensity, arbitrary units
a
d c b
Figure 8. XRD analysis of (a) the residue after the Hedvall effect test between C-S-H (C/S:0.6) and silver nitrate, (b) pure silver nitrate, (c) residue after the solid state reaction between an excessive amount of C-S-H (C/S:0.6) and silver nitrate, (d) phase pure C-S-H (C/S: 0.6)
∇
Indicates additional peaks of relatively high intensity in the spectrum for (c) compared to spectrum fro pure C-S-H (d)
-10 -8 -6 -4 -2 0 2 4 6 8 140 160 180 200 220 240 Temperature, οC Heat Flow, W/g a1 a2 b1 b2
Figure 9. Heat flow curve of CSH (C/S:0.6); first cycle: (a1) on heating (a2) on cooling; second cycle: (b1) on heating (b2) on cooling
(a)
10 μm
II
III
I
(b)Figure 10. Normal (a) and back-scattered (b) micrographs of the residue after the Hedvall effect test for the mixture of C-S-H (C/S: 0.6) and excessive silver nitrate
(a)
10 μm
II
I
III
(b)Figure 11. Normal (a) and back-scattered (b) micrographs of the residue after the Hedvall effect test for the mixture of C-S-H (C/S: 1.5) and excessive silver nitrate
5 μm
Figure 12. Back-scattered micrograph of the typical morphology of the reaction products containing only Ag and Si after Hedvall effect test for the mixture of C-S-H (C/S: 0.6) and excessive silver nitrate