HAL Id: hal-00317319
https://hal.archives-ouvertes.fr/hal-00317319
Submitted on 8 Apr 2004
HAL is a multi-disciplinary open access
archive for the deposit and dissemination of
sci-entific research documents, whether they are
pub-lished or not. The documents may come from
teaching and research institutions in France or
abroad, or from public or private research centers.
L’archive ouverte pluridisciplinaire HAL, est
destinée au dépôt et à la diffusion de documents
scientifiques de niveau recherche, publiés ou non,
émanant des établissements d’enseignement et de
recherche français ou étrangers, des laboratoires
publics ou privés.
Fundamental Adriatic seiche recorded by current meters
N. Leder, M. Orlic
To cite this version:
N. Leder, M. Orlic. Fundamental Adriatic seiche recorded by current meters. Annales Geophysicae,
European Geosciences Union, 2004, 22 (5), pp.1449-1464. �hal-00317319�
SRef-ID: 1432-0576/ag/2004-22-1449 © European Geosciences Union 2004
Annales
Geophysicae
Fundamental Adriatic seiche recorded by current meters
N. Leder1and M. Orli´c2
1Hydrographic Institute of the Republic of Croatia, Zrinsko Frankopanska 161, 21000 Split, Croatia
2Andrija Mohoroviˇci´c Geophysical Institute, Faculty of Science, University of Zagreb, Horvatovac bb, 10000 Zagreb, Croatia
Received: 30 June 2003 – Revised: 16 December 2003 – Accepted: 23 January 2004 – Published: 8 April 2004
Abstract. Currents recorded at two stations positioned at the Adriatic shelf break between 17 February and 6 March 1989 were considered. They provided the first evidence of current variability related to the Adriatic-wide seiches. Current spec-tra were dominated by a peak at 21.1 h – a well-known pe-riod of the fundamental Adriatic mode. Amplitudes of oscil-lations were considerable, occasionally greater than 30 cm/s. Both along- and cross-basin currents were recorded, thus sig-nalling the importance of rotational effects. Comparison of the current data with the sea-level measurements performed simultaneously along the east Adriatic coast showed that the 21-h currents flowing in the Adriatic preceded sea levels by a quarter of a cycle, as would be expected from a simple model of bay seiches. Sea-level amplitudes reached 40 cm in the North Adriatic, thus marking the event as one of the strongest on record. Seiching was triggered by a suddenly changing sirocco wind, as is usually the case in the Adriatic. The most important features of the seiche event were repro-duced with a two-dimensional hydrodynamic model of the Adriatic Sea, forced by the sea-level residuals measured at Otranto and the air pressure and wind data recorded at Las-tovo. The model showed that the seiche-related currents were relatively strong in the area where the current measurements were performed and further north – between Zadar and An-cona.
Key words. Oceanography: general (continental shelf pro-cesses) – Oceanography: physical (sea-level variations, cur-rents)
1 Introduction
That some of the energy the atmosphere imparts to the Adriatic goes into its normal modes has been known since Kesslitz (1910, 1912 and 1913) subjected sea-level records from Pula and Dubrovnik to harmonic analysis. After de-Correspondence to: N. Leder
tiding the time series, he noticed oscillations having periods of about 23, 12 and 5 h. An explanation followed the find-ing quickly: Defant (1911) used some simple analytical so-lutions to show that the oscillations could be interpreted in terms of the seiches, and Sterneck (1919) confirmed this in-terpretation utilising a one-dimensional numerical model he had developed for the Adriatic Sea. Incidentally, the latter study represented one of the first successful applications of numerical modelling in geophysical fluid dynamics.
In the century which followed the discovery of the Adri-atic seiches, their investigation underwent a considerable change and some novel results were obtained. On the em-pirical side, filtering (Vercelli, 1941) and spectral-analysis techniques (Manca et al., 1974) have been applied to the sea-level data, revealing that the fundamental mode period is closer to 21 h than 23 h. Numerical modelling was extended to two dimensions (Accerboni and Manca, 1973; Stravisi, 1973), which enabled rotational effects to be taken fully into account, and the problem of the open boundary conditions was carefully examined (Schwab and Rao, 1983). Further-more, generation and decay of the Adriatic seiches received some attention. Kasumovi´c (1963) described the way seiches are usually excited: when a cyclone approaches the Adriatic, the sea level rises in its northern part due to the combined action of the low air pressure and sirocco wind; after the cy-clone and its frontal system have left the area, the air pressure increases and the wind suddenly slackens or even changes direction to bora, which triggers the seiches. Ceroveˇcki et al. (1997) considered the decay of the lowest-mode Adriatic seiche: they obtained 3.2±0.5 days for the free decay time, and showed that the longevity of the seiches might be related to the weak influence of bottom friction and the limited en-ergy loss through the Otranto Strait.
As pointed out by one of us in a recent study of the Adriatic dynamics (Orli´c, 2001), all empirical information on the Adriatic-wide normal modes has been provided by tide gauges. This one-sidedness has somewhat obscured the fact that the seiches may contribute to the Adriatic current variability as well. Whereas the models showed that with
1450 N. Leder and M. Orli´c: Fundamental Adriatic seiche
Fig. 1. Bathymetric map of the Adriatic Sea. The open circles indicate the locations of moorings, black circles the tide-gauge stations and triangles the meteorological stations.
maximum sea-surface amplitudes of 50 cm, which are not unusual for the fundamental Adriatic seiche, current oscil-lations having an amplitude greater than 10 cm/s may be ex-pected sporadically, the data that would support the predic-tions were lacking. It has been recognised that the omis-sion was due to the Adriatic current records being of short duration, which minimized the probability of capturing a pronounced seiche event, and made separation of the seiche peaks from the nearby tidal peaks in the current spectra dif-ficult.
Recently, we have reconsidered a current data set taken at the Adriatic shelf break in the late 1980s. It turned out that the measurements were done during one of the strongest seiche events on record and that they were considerably in-fluenced by the seiching. The present paper reports on the data and their interpretation. Materials and methods are de-scribed in the second section, the current data, their com-parisons with the simultaneous sea-level and meteorological data and with modelling results are considered in the third section, whereas conclusions addressing the importance of
the finding for the study of the Adriatic currents are presented in the final, fourth section.
2 Materials and methods
The oscillating currents described in this paper were ob-served in the Lastovo Channel. From 17 February to 6 March 1989 at the station L-1 (nominal depth of 63 m) and from 18 February to 5 March 1989 at the station L-2 (nominal depth of 105 m, south of the Lastovo Island) Aanderaa RCM-7 in-struments were used to measure the current speed (accuracy
±1 cm/s), direction (accuracy ±5◦) and temperature (accu-racy ±0.05◦C) (Fig. 1). The current meters were positioned
at the depths of 3, 30 and 60 m at the station L-1 and 3 and 100 m at the station L-2. Sampling interval was 5 min. From the raw data hourly averages of all the measured parameters were calculated.
Simultaneously with the currents sea levels were moni-tored with conventional tide gauges at three stations along the east Adriatic coast (Rovinj, Ubli and Dubrovnik, Fig. 1) and one station on the west side (Otranto, Fig. 1). The Rov-inj station is considered to be representative for the North Adriatic, where first-mode Adriatic seiche achieves maxi-mum sea-level range (double amplitude), sometimes higher than 1.2 m at Trieste (e.g. Raicich et al., 1999). The station at Ubli, on the Lastovo Island, is located very close to the area of current measurements, the Dubrovnik station is repre-sentative for the South Adriatic, where sea-level oscillations caused by first-mode Adriatic seiche do not exceed several centimetres (Vilibi´c, 2000), whereas the Otranto station doc-uments conditions at the Adriatic open boundary. Contin-uous records from these stations were digitized, which re-sulted in hourly sea-level time series having an accuracy of
±1 cm.
Hourly values of the wind speed and direction, as well as air pressure, were collected at the Pula and Lastovo stations (Fig. 1) which belong to the standard meteorological net-work. The measurements were made at the height of 186 m (30 m) at the Lastovo (Pula) stations.
From the original wind and current data along- (NW–SE) and cross-basin components (SW–NE) were calculated. This allows for a straightforward analysis of the response of the Adriatic Sea to dominant winds that blow above it: bora (NE wind) and sirocco (SE wind). Moreover, characteris-tics of the Adriatic basin topography, which are of prevail-ing importance for the Adriatic seiche analysis, are optimally taken into account by considering longitudinal (NW–SE) and transversal (SW–NE) directions.
The tidal signal was removed from the current data by us-ing a technique suggested by Dennis and Long (1978) to ob-tain tidal and residual time series. Sea-level data were de-tided following the procedure of Schureman (1941). Using seven harmonic constituents prevailing in the Adriatic Sea (M2, S2, N2,K2, K1, O1 and P1; Hydrographic Institute,
1973) a tidal curve was generated. Residual levels were then computed and reduced to the mean sea level taken from the
reports on sea-level measurements (for the east Adriatic coast published by Hydrographic Institute, 1956–2000). Measured sea levels and tidal sea levels are referred to the chart datum. The period and strength of the seiching were examined by applying the Blackman-Tukey method of spectral analysis, with 8◦of freedom to the current and sea-level time series. Coherence and phase shift between the time series were cal-culated utilising cross-spectral analysis elaborated by Jenk-ins and Watts (1968), see also Leder (1992).
In addition, to assist in the interpretation of the seiche episode presented in this paper, a two-dimensional (depth-averaged) hydrodynamic numerical model (Black et al., 1993; Black, 1995) was applied to the Adriatic Sea.
3 Results and discussion
3.1 Data
The vigorous seiche episode of February/March 1989 was generated by a well-known sequence of synoptic-scale at-mospheric systems (e.g. Kasumovi´c, 1963; Ceroveˇcki et al., 1997; Raicich et al., 1999). A very deep cyclone comprising three separate low centres (about 965 hPa) and two frontal systems covered the whole Europe and Mediterranean Sea on 24 February (Fig. 2). The large cyclone moved south-eastward. A significant decrease in the atmospheric pres-sure started simultaneously over the whole Adriatic Sea on 24 February (Figs. 2 and 3b). On the other hand, a sirocco wind commenced first in the Middle and South Adriatic as a result of stronger atmospheric gradient ahead of a frontal system (Figs. 2 and 3a). Both the air pressure and wind con-tributed to the sea-level rise (storm surge) shown in Fig. 4e, and the subsequent seiches could be related to the sudden changes in the wind.
The seiche episode observed between 24 February and 6 March 1989 did not represent a simple case of the se-iche generation and decay, because over that interval several sirocco impulses occurred (Fig. 3a), sometimes alternating with winds of other directions, especially after the passage of the cold front on 26 February (Figs. 2 and 3b).
Fundamental seiche-period oscillations started first on 24 February in the North Adriatic, as can be seen from residual sea levels observed at Rovinj (60 cm range of the first oscilla-tion, Fig. 4f). A few hours later the seiche became evident in the Middle Adriatic, contributing 15 cm to the residual sea-level range (Fig. 4f) and more than 25 cm/s to the current amplitude in the intermediate layer of the Lastovo Channel (station L-1, depth 20 m, Fig. 3d).
Energetic sea-level and current oscillations of the whole water column were observed from 24 February to the end of current records (6 March, Fig. 4), confirming that the Adri-atic seiche is a transient, but persistent barotropic feature. Vertical distribution of sea temperature (Fig. 3c) also indi-cated barotropic conditions, with weak temperature inversion in the surface layer.
1452 N. Leder and M. Orli´c: Fundamental Adriatic seiche
Fig. 2. Successive synoptic charts for 24 (top), 25 (middle) and 26 (bottom) February 1989, 12:00 GMT (according to Deutscher Wetter-dienst).
WIND
0
20
40
60
80
100
0
20
40
60
80
100
LASTOVO0
10
20
S P E E D ( m /s )0
10
20
0
90
180
270
360
D IR E C T IO N ( d e g .)0
90
180
270
360
12
13
14
T E M P E R A T U R E ( 0C )12
13
14
18 19 20 21 22 23 24 25 26 27 28 01 02 03 04 05 06
FEBRUARY/MARCH 1989
0
20
40
60
80
100
C U R R E N T S P E E D ( cm /s )0
20
40
60
80
100
940 960 980 1000 1020 1040 A IR P R E S S U R E ( h P a ) 940 960 980 1000 1020 1040 PULA L-1 3 m 20 m 60 m L-1 3 m 20 m 60 m L-2 3 m 100 m LASTOVO PULAa
bc
d
e
Fig. 3. Time series of hourly (a) wind speed and direction at Pula and Lastovo, (b) air pressure at Pula and Lastovo, (c) sea temperature at station L-1, (d) current speed at station L-1 and (e) current speed at station L-2.
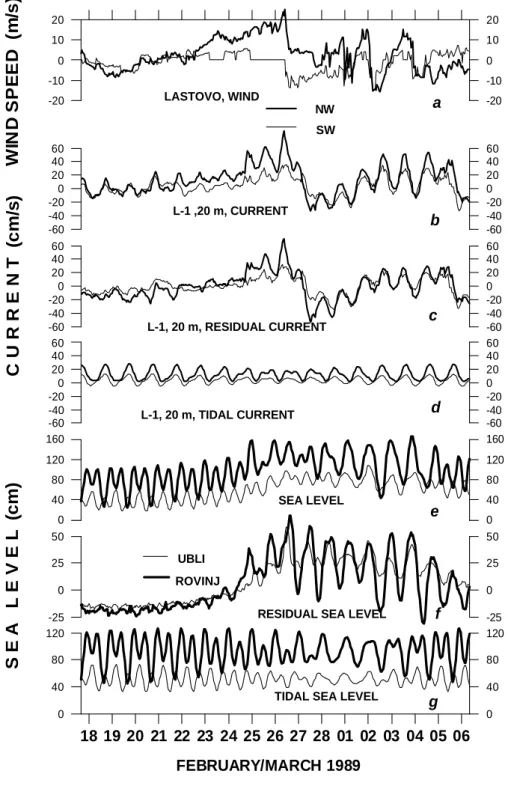
It is obvious that the most intense seiche occurred on 26 February (Fig. 4), when a stormy sirocco reaching a 25 m/s hourly mean speed generated oscillations having 75 cm (43 cm) sea-level range at Rovinj (Ubli) and 31 cm/s current amplitude in the wider area of the Lastovo Island (Figs. 3 and 4). However, it can be noticed that on 26
Febru-ary maximum residual sea level reached nearly the same value of about 60 cm at Rovinj and Ubli. This situation is not typical. It could possibly be related to a similar influence of decreasing air pressure on the sea-level rise in the whole Adriatic, and to the sirocco wind being stronger and thus sup-porting a larger sea-level slope over the Middle than over the
1454 N. Leder and M. Orli´c: Fundamental Adriatic seiche L-1 ,20 m, CURRENT L-1, 20 m, RESIDUAL CURRENT L-1, 20 m, TIDAL CURRENT SEA LEVEL NW SW -20 -10 0 10 20
W
IN
D
S
P
E
E
D
(m
/s
)
-60 -40 -20 0 20 40 60 -60 -40 -20 0 20 40 60
C
U
R
R
E
N
T
(c
m
/s
)
-60 -40 -20 0 20 40 60RESIDUAL SEA LEVEL LASTOVO, WIND
TIDAL SEA LEVEL 0 40 80 120 0 40 80 120 160 -25 0 25 50
S
E
A
L
E
V
E
L
(c
m
)
UBLI ROVINJ -60 -40 -20 0 20 40 60 -60 -40 -20 0 20 40 60 -60 -40 -20 0 20 40 60 0 40 80 120 160 -25 0 25 50 -20 -10 0 10 20 18 19 20 21 22 23 24 25 26 27 28 01 02 03 04 05 06 FEBRUARY/MARCH 1989 0 40 80 120 a b c d e f gFig. 4. Time series of hourly NW and SW components of wind at Lastovo (a) and of measured currents (b), residual currents (c) and tidal currents at L-1 (nominal depth of 20 m) (d), measured sea level (e), residual sea level (f) and tidal sea level at Rovinj and Ubli (g).
North Adriatic (Figs. 3a and b). Vilibi´c (2000) arrived at a similar conclusion while investigating seiche occurrence in February–March 1989 on the basis of sea-level data originat-ing from four tide gauges distributed along the east Adriatic coast.
An interesting feature of oscillating currents is that the oscillations in the channel area (L-1) preceded those in the open sea (L-2) by one cycle, as is visible in Figs. 3d and e.
This feature may be related to the spatial and temporal vari-ations of sirocco wind along the whole Adriatic basin, pro-ducing specific seiche propagation from the North to Middle Adriatic. Moreover, the simple model of the fundamental bay seiche (e.g. Defant, 1961) implies that seiche-generated current speeds are inversely proportional to the water depth. Thus, the fact that the first seiche-period oscillation recorded on 24 February at the station L-1 (average current amplitude
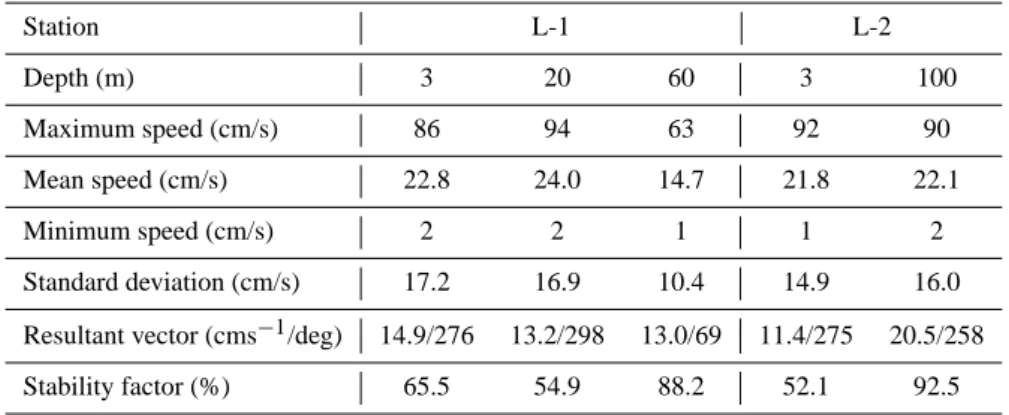
Table 1. Statistical description of currents measured at the stations L-1 (from 17 February to 6 March 1989) and L-2 (from 18 February to 5 March 1989). Station L-1 L-2 Depth (m) 3 20 60 3 100 Maximum speed (cm/s) 86 94 63 92 90 Mean speed (cm/s) 22.8 24.0 14.7 21.8 22.1 Minimum speed (cm/s) 2 2 1 1 2 Standard deviation (cm/s) 17.2 16.9 10.4 14.9 16.0 Resultant vector (cms−1/deg) 14.9/276 13.2/298 13.0/69 11.4/275 20.5/258 Stability factor (%) 65.5 54.9 88.2 52.1 92.5
ca. 10 cm/s) was not observed at the station L-2 may be at-tributed to two additional reasons: firstly, the station L-2 was located in deeper water and, secondly, seiche-related currents were further amplified in the Lastovo Channel. It is also ob-vious that the oscillations in the surface layer of station L-1 lagged behind the oscillations in the intermediate and bottom layers of the same station by two cycles (Fig. 3d). Most prob-ably, the first two cycles of current oscillations in the surface layer of the station L-1 were disturbed by a wind stress acting much more strongly there than in the open sea (L-2), due to a well-known channelling of sirocco in the Lastovo Channel. The influence of bottom topography on the current vari-ability is evident in another way. Namely, the varivari-ability was generally higher inside the channel area (station L-1) than in the open sea (station L-2, Figs. 3d and e). Obviously, the currents were amplified due to the Lastovo Channel being narrow and shallow. The two stations considered here were positioned at the Adriatic shelf break, off the South Adriatic Pit in which depths reach 1200 m. It may be assumed that the current variability at the stations was more pronounced than in the pit, due to a large difference in depths.
Let us point out that – to the best of our knowledge – the maximum current speeds recorded during this seiche episode (Table 1) equal the maximum current speeds ever measured in the Adriatic. Similar speeds (95 cm/s) were previously ob-served during a stormy bora wind event at the station posi-tioned off the town of Senj in the North Adriatic, but only in the sub-surface layer (Smirˇci´c et al., 1987).
It is of some interest that the largest sea-level and current amplitudes were observed on 26 February and 2–3 March, when the wind forcing (Fig. 3a) was pulsating with the peri-ods similar to the period of the first-mode Adriatic seiche (ca. 21 h; see Orli´c, 2001, and references cited therein). This find-ing agrees with the results reviewed by Gill (1982), who em-phasised that seiche-like oscillations in gulfs, estuaries and lakes might be stimulated by changes in the wind stress, air pressure, or by changes in gravitational action of the Moon and the Sun, and that the increase in amplitude is very large (i.e. resonance occurs) when the frequency of forcing is close to one of the natural frequencies of oscillation.
In the case of the Adriatic Sea, natural frequencies may be computed using a hierarchy of models of increasing com-plexity. The simplest to consider is nonrotating flat-bottom channel closed at one end. The period of the first-mode se-iche in such a basin could be calculated using Merian’s for-mula (e.g. Proudman, 1953):
T = √4L
gH, (1)
where L is the channel length, H is the mean depth, and
gis the acceleration due to gravity (9.81 ms−2). Applying this formula to the Adriatic Sea, and taking L=800 km and
H =240 m (Buljan and Zore-Armanda, 1976), one obtains
T =18.3 h for the basic period, the difference between this value and the observed value of 21 h arising due to various factors. One of them is rotation. The ratio between the mean width of the Adriatic (ca. 135 km) and the Rossby radius of deformation (median value 250 km) is close to 0.5 (Hender-shott and Speranza, 1971; Gill, 1982), which indicates that a better interpretation of the Adriatic dynamics may be given in terms of inertia-gravity waves, thus allowing for the prop-agation of phase, the cross-basin currents and an increase in period with respect to the nonrotating case. The other con-trolling factor is topography. In combination with rotation it may support topographic waves propagating across the Adri-atic, and the 21-h seiche could probably be related to hybrid gravity-topography waves (invoked in a recent study of diur-nal tides in the Adriatic by Malaˇci´c et al., 2000). However, the period of such waves, trapped in a narrow basin, remains to be determined.
When analysing along- (NW) and cross-basin (SW) resid-ual current components throughout the seiche episode con-sidered here (Fig. 4c), it becomes obvious that during the generating process (first three cycles) the along-basin com-ponent was predominant, while later, during the decay pro-cess, both components were of the same order of magnitude. This again signals that rotational effects are important. The influence of the Coriolis force on the Adriatic seiches was recognized in the formulation of storm-surge models (e.g.
1456 N. Leder and M. Orli´c: Fundamental Adriatic seiche Accerboni and Manca, 1973; Michelato et al., 1985) aimed
at predicting floodings of Venice. 3.2 Spectral and cross-spectral analysis
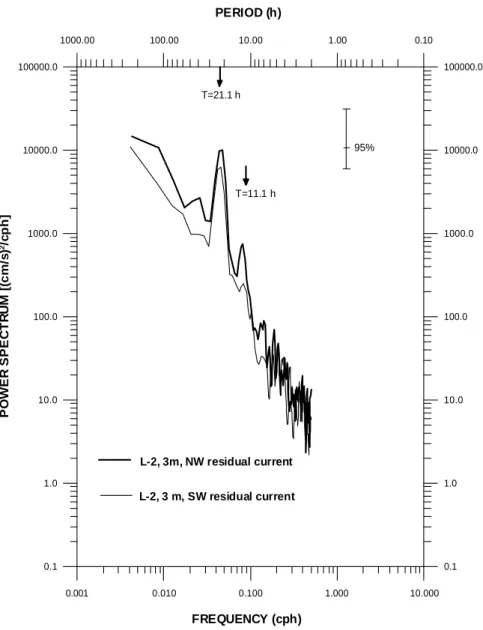
Power spectra of residual sea levels for Rovinj and Ubli are shown in Fig. 5. There are two pronounced peaks, at 21.1 h and 11.1 h. The 21.1 h peak is an order of magnitude higher at Rovinj than at Ubli. Obviously, this energy maximum may be interpreted in terms of the fundamental (first-mode) Adriatic seiche. The energy of the second conspicuous peak (11.1 h) is similar at Rovinj and Ubli, suggesting that it is related to the second-mode Adriatic seiche. Observed peri-ods and energies of residual sea levels, linked to the first and second Adriatic mode, are very similar to the recent findings of various authors (e.g. Vilibi´c et al., 1996; Ceroveˇcki et al., 1997; Vilibi´c et al., 1998; Raicich et al., 1999; Vilibi´c, 2000). Peaks in the residual current spectra, shown in Fig. 6, are observed at the same periods as in the residual sea-level spec-tra, and are higher by an order of magnitude for the first-mode than for the second-first-mode seiche. Along-basin current oscillations are stronger than the cross-basin ones for both the first-mode and second-mode seiches (Fig. 6).
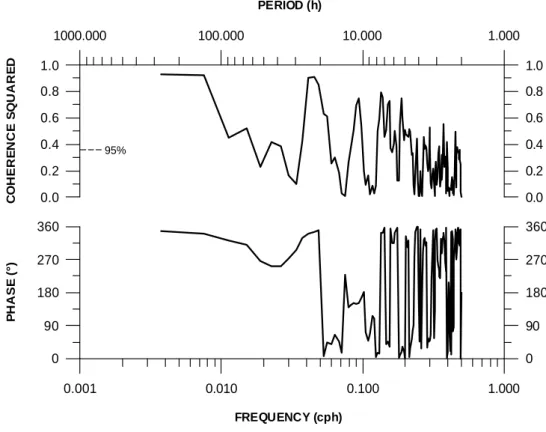
Cross-spectral analysis was done for (a) residual sea lev-els (input) and residual sea levlev-els (output), as well as for (b) residual sea levels (input) and residual current compo-nents (output). Coherence squared and phase difference spectra computed for residual sea levels measured at Rov-inj and Dubrovnik are shown in Fig. 7. Maximum coherence squared values were found at periods of 21 h, 11 h and 7.5 h, with corresponding phase differences of 0◦, 165◦and 345◦, respectively. There is an indication of the existence of the third Adriatic mode, although the peaks in the residual sea level and current spectra at the period of 7.5 h are not statis-tically significant (Figs. 5 and 6).
At 21 h coherence squared between residual sea levels at Ubli and NW component of residual currents at station L-2 is very high (ca. 0.8), with a phase difference of 90◦(currents precede sea levels, Fig. 8). This means that in the Middle Adriatic sea levels lag behind currents by a quarter of a cy-cle, in agreement with the simple model of the fundamental bay seiche (e.g. Defant, 1961). Other cross spectra, com-puted for the residual sea levels at Ubli and the residual cur-rent components at stations L-1 and L-2, are very similar to that shown in Fig. 8. The only difference is a greater phase shift (ca. 110◦) for the cross-basin (SW) current component (Fig. 9). Similar features of cross spectra (not shown) were obtained for the Rovinj sea levels and the currents measured at stations L-1 and L-2.
3.3 Numerical model
A two-dimensional, nonlinear, hydrodynamic model was used for the simulations of the Adriatic sea levels and cur-rents. The three-dimensional model 3DD of Black (1995), adopted in its two-dimensional mode, was chosen for the simulation. The model solves the momentum and
conser-vation equations by an explicit, leap-frog, finite difference scheme (for details, see Black, 1995). The equations are:
∂u ∂t +u ∂u ∂x +v ∂u ∂y −f v = −g∂ξ ∂x − gu(u2+v2)1/2 C2(d + ξ ) − 1 ρ ∂P ∂x +ρaγ |W | Wx ρ(d + ξ ) +AH ∂2u ∂x2 + ∂2u ∂y2 ! (2) ∂v ∂t +u ∂v ∂x+v ∂v ∂y +f u = −g∂ξ ∂y − gv(u2+v2)1/2 C2(d + ξ ) − 1 ρ ∂P ∂y+ ρaγ |W | Wy ρ(d + ξ ) +AH ∂2v ∂x2+ ∂2v ∂y2 ! (3) and ∂ξ ∂t + ∂ ∂x(d + ξ )u + ∂ ∂y(d + ξ )v =0, (4)
where t is time, u and v are vertically averaged velocities in the x and y directions, g is the gravity acceleration, ξ is the sea level above a horizontal datum, d is the depth below the datum, f is the Coriolis parameter, ρ is the water den-sity, ρais the air density, P is the atmospheric pressure, W
is the wind velocity at 10 m a.s.l., Wx and Wyare the x and y components of the wind velocity, γ is the wind drag co-efficient, and AH the horizontal eddy viscosity coefficient.
The wind drag coefficient utilized in the model was given by Wu (1982)
γ = (0.8 + 0.065|W |) × 10−3 (5)
and Chezy’s C is given by
C =18 log10(0.37h/z0), (6)
where h is the total water depth and z0 is the roughness
length.
The bathymetry data for the model were extracted from a standard bathymetric chart (B 100, Hydrographic Institute of the Republic of Croatia, 1992) having a scale of 1:1 000 000. While digitising the chart, a compromise had to be found be-tween the number of points (depths) and complexity of the contours, with straighter lines corresponding to fewer points. Increased bathymetric resolution was achieved by interpolat-ing between existinterpolat-ing isobaths, assuminterpolat-ing a linear gradation. Golden software “SURFER Version 7.0” was used, in con-junction with the support program “TOBATH”, to process the raw bathymetry data and convert them to a form read-able by the model code. In the model, a grid of square cells of size 5×5 km was used. The grid size was chosen to re-solve important bathymetric features, as was previously done by Cushman-Roisin and Naimie (2002) in their study of the Adriatic tides.
95% T=21.1 h 0.001 0.010 0.100 1.000 10.000 FREQUENCY (cph) 0.1 1.0 10.0 100.0 1000.0 10000.0 100000.0 P O W E R S P E C T R U M [ c m 2/c p h ] ROVINJ UBLI T= 11.1 h 0.10 1.00 10.00 100.00 1000.00 PERIOD (h) 0.1 1.0 10.0 100.0 1000.0 10000.0 100000.0
Fig. 5. Power spectra of residual sea levels at Rovinj and Ubli.
Two important physical parameters that need to be set in the model are the roughness length z0and the horizontal eddy
viscosity coefficient AH. The bed roughness determines the
current strength and the attenuation of currents. The model offers two options: (i) in the case where limited information is available, a constant roughness length may be adopted over the whole grid; or (ii) in other cases, a detailed specification on a cell-by-cell basis is possible. The horizontal eddy vis-cosity parameter should be set with care, as excessive values will smooth out small-scale flow features including eddies. Therefore, the model was calibrated prior to its use for the simulation of residual sea levels and currents at sites L-1 and L-2.
The data used for the model calibration run were hourly sea levels registered during January 1989 at Otranto (close to the model open boundary, Fig. 1) and hourly values of
the wind speed and direction and of the air pressure as mea-sured during January 1989 at meteorological station Lastovo. Two parameters, roughness length and horizontal eddy vis-cosity coefficient, were adjusted in order to bring the simu-lated sea levels close to the data taken at three east Adriatic stations (Rovinj, Ubli and Dubrovnik) operating during Jan-uary 1989. As an example, Fig. 10 shows that the model sim-ulations are highly accurate in the Middle Adriatic basin, at Ubli: coefficient of determination R2equals 0.95 there. The roughness length coefficient and the horizontal eddy viscos-ity coefficient which gave this result were z0=0.005 m and AH=15 m2/s. A similar agreement with the data was
ob-tained at stations Rovinj and Dubrovnik, with coefficients of determination R2of 0.95 and 0.97, respectively (results not shown).
1458 N. Leder and M. Orli´c: Fundamental Adriatic seiche 95% T=21.1 h 0.001 0.010 0.100 1.000 10.000 FREQUENCY (cph) 0.1 1.0 10.0 100.0 1000.0 10000.0 100000.0 P O W E R S P E C T R U M [ (c m /s ) 2/c p h ] 0.1 1.0 10.0 100.0 1000.0 10000.0 100000.0 L-2, 3m, NW residual current L-2, 3 m, SW residual current 0.10 1.00 10.00 100.00 1000.00 PERIOD (h) T=11.1 h
Fig. 6. Power spectra of along- (NW) and cross-basin (SW) residual currents in the surface layer of station L-2.
After the model had been calibrated using sea levels ob-served in January 1989, it was employed for reproduction of residual sea levels and currents registered between 17 Febru-ary and 6 March 1989. As the model marches forward in time, it has to start from some initial conditions. Normally, the velocities and sea-level heights are set to zero. The boundary conditions “drive” the model, and should be de-fined carefully:
•Southern open boundary at the Otranto Strait: Tidal sig-nal was eliminated from the raw Otranto tide-gauge data to create residual sea levels (Fig. 11), using a technique de-scribed in the second section of the paper. Because a uniform change in the sea-surface elevation was assumed across the entire boundary and there was no need for moving the bound-ary away from the region of interest, for stability reasons the southern boundary was set to be geostrophic. In the model the Coriolis parameter was calculated using a central latitude of 43◦.
•Sea surface: Air pressure as well as wind speed and di-rection recorded at the Lastovo meteorological station at 1-h interval were imposed on t1-he w1-hole model domain. T1-his choice of meteorological forcing was made because the Las-tovo meteorological station can be considered as representa-tive for the wider area of the Middle Adriatic, covering the area of current measurements that were performed near Las-tovo Island. The data from the Pula meteorological station, which is not located at the coast and – to the best of our knowledge – does not represent correctly the wind field in the North Adriatic, recording lower sirocco wind speeds as a rule, were not used in model simulations. A disadvantage of this choice is that the model gave rather strong currents in the North Adriatic as a consequence of a stronger wind in the Middle than in the North Adriatic (Fig. 3a).
N. Leder and M. Orli´c: Fundamental Adriatic seiche 1459 95% 0.001 0.010 0.100 1.000 FREQUENCY (cph) 0.0 0.2 0.4 0.6 0.8 1.0 C O H E R E N C E S Q U A R E D 0 90 180 270 360 P H A S E ( °) 1.000 10.000 100.000 1000.000 PERIOD (h) 0.0 0.2 0.4 0.6 0.8 1.0 0 90 180 270 360
Fig. 7. Coherence squared and phase difference spectra of residual sea levels in Rovinj (input) and Dubrovnik (output).
95% 0.001 0.010 0.100 1.000 FREQUENCY (cph) 0.0 0.2 0.4 0.6 0.8 1.0 C O H E R E N C E S Q U A R E D 0 90 180 270 360 P H A S E ( °) 1.000 10.000 100.000 1000.000 PERIOD (h) 0.0 0.2 0.4 0.6 0.8 1.0 0 90 180 270 360
Fig. 8. Coherence squared and phase difference spectra of residual sea levels at Ubli (input) and NW component of residual currents (nominal depth of 3 m) at station L-2 (output).
1460 N. Leder and M. Orli´c: Fundamental Adriatic seiche 95% 0.001 0.010 0.100 1.000 FREQUENCY (cph) 0.0 0.2 0.4 0.6 0.8 1.0 C O H E R E N C E S Q U A R E D 0 90 180 270 360 P H A S E ( °) 1.000 10.000 100.000 1000.000 PERIOD (h) 0.0 0.2 0.4 0.6 0.8 1.0 0 90 180 270 360
Fig. 9. Coherence squared and phase difference spectra of residual sea levels at Ubli (input) and SW component of residual currents (nominal depth of 20 m) at station L-1 (output).
0102 03 04 05 0607 08 09 10 1112 13 14 15 1617 18 19 20 2122 23 24 25 2627 28 29 30 31 JANUARY 1989 0 20 40 60 80 S E A L E V E L ( c m ) 0 20 40 60 80 MEASURED MODELLED
Fig. 10. Comparison between measured and modelled sea levels at Ubli in January 1989.
Comparison of the residual currents measured at station L-1 (20 m below the sea surface) with depth-averaged residual currents simulated by the two-dimensional model shows that there is good agreement in phases and amplitudes: high accu-racy of the model is confirmed by the coefficients of determi-nation R2of 0.97 and 0.96 between measured and modelled NW and SW current components, respectively (Figs. 12a, b). A similar agreement with the data was obtained at station
L-2 (not shown). It is interesting to note that the modelled currents, both the NW and SW components, reached their maxima following the wind gust of 26 February 1989. The model, however, was less skilful during the period of seiche decay from 26 February to 6 March 1989, underestimating or overestimating the peak currents in both directions (NW and SW) at station L-1. Somewhat larger discrepancies between model predicted and measured currents in the SW direction
N. Leder and M. Orli´c: Fundamental Adriatic seiche 1461 18 19 20 21 22 23 24 25 26 27 28 01 02 03 04 05 06 FEBRUARY/MARCH 1989 -40 -20 0 20 40 S E A L E V E L ( c m ) -40 -20 0 20 40 MEASURED RESIDUAL
Fig. 11. Time series of measured and residual sea levels at Otranto.
than in the NW direction can probably be associated with the variability of the wind-stress terms in the model equations (2 and 3). It might be that the formulation of the wind drag coefficient (5), which was developed from data collected in a different natural environment, is not adequate for the area modelled here. For example, some of the wind energy may be dissipated by wave breaking, and the wind drag coeffi-cient as a critical parameter in numerical simulations may be highly significant. Importance of the effects of air sta-bility and wind wave field for the wind stress estimation in the Adriatic Sea was also stressed by Beg Paklar et al. (2001). Furthermore, the two-dimensional model cannot simulate ro-tation between the layers. Thus, if the surface layers are heading more downwind than the layers below, the model will not be able to treat this variation. Perhaps the largest po-tential for error lies with the approximation associated with conditions imposed at the open boundary and the influence of the bottom topography variability in the Lastovo Chan-nel and around Lastovo Island, where the circulation is spa-tially complex in response to the land constrictions, Corriolis force and pressure gradients. However, the two-dimensional model successfully predicted residual sea-level oscillations at Ubli with R2of 0.97 (Fig. 12c).
Although our intention was to use the model primarily as a support tool to confirm the dynamics caused by the se-vere meteorological forcing of the entire Adriatic at the time the observations were taken, the model results could be used to determine the 21-h current ellipses, as shown in Fig. 13. The ellipses were calculated following Pugh (1987), by us-ing simulations for the time interval between 4 and 6 March 1989 when the wind forcing was weak (Fig. 4a).
Figure 13a shows model-calculated depth-averaged resid-ual currents in the form of ellipses plotted at every fifth point of the model grid. Majority of major axes of ellipses in the North and Middle Adriatic basin are approximately oriented NW–SE, with the currents rotating clockwise (anticyclonic rotation). This qualitatively agrees with empirical findings.
Comparison between observed (thick lines) and modelled (thin lines) current ellipses for stations L-1 and L-2 is shown in Fig. 13b. As the figure reveals, the agreement is quite good, both in magnitudes and in directions. The remain-ing discrepancies can be attributed to the coarse model grid, which does not allow for a proper reproduction of the chan-nelling effects. However, it is probable that in the presence of vertical velocity shear the depth-averaged model-calculated currents are not representative for a comparison with currents measured at only two or three levels. Assuming the numer-ical schemes to be relatively accurate, the model credibility relies heavily on the quality of the field data and imposed boundary conditions.
4 Conclusions
Current measurements performed at two stations in the vicin-ity of Lastovo Island between 17 February and 6 March 1989 provided first evidence of current variability related to the Adriatic-wide normal modes. Spectra computed from the data revealed a significant peak at the fundamental-mode period (ca. 21 h), with another peak being visible but not significant at the second-mode period (ca. 11 h). Compari-son of the current measurements with simultaneous sea-level data showed that the 21-h currents flowing in the Adriatic preceded sea levels by a quarter of a cycle, in accordance with the simple model of bay seiches. Cross-basin cur-rents were visible as well, which is an obvious sign of ro-tational effects. Current amplitudes occasionally surpassed 30 cm/s, while sea-level amplitudes reached almost 40 cm in the North Adriatic. Seiching was triggered by a suddenly changing sirocco wind, as is usually the case in the Adri-atic. Salient features of the seiche event were reproduced with a two-dimensional hydrodynamic model of the Adriatic Sea, forced by the sea-level residuals measured at Otranto and the air-pressure and wind data recorded at Lastovo. In
1462 N. Leder and M. Orli´c: Fundamental Adriatic seiche 18 19 20 21 22 23 24 25 26 27 28 01 02 03 04 05 06 FEBRUARY/MARCH 1989 -20 0 20 40 60 80 R E S ID U A L S E A L E V E L ( c m ) -80 -40 0 40 80 R E S ID U A L C U R R E N T S P E E D ( c m /s ) -80 -40 0 40 80 R E S ID U A L C U R R E N T S P E E D ( c m /s ) -20 0 20 40 60 80 -80 -40 0 40 80 -80 -40 0 40 80 NW MEASURED MODELLED MEASURED MODELLED MEASURED MODELLED SW a b c
Fig. 12. Comparison between measured and modelled hourly residual (a) NW and (b) SW components of currents at station L-1 (nominal depth of 20 m) and (c) sea levels at Ubli.
particular, the model showed that the seiche-related currents were relatively strong above the Adriatic shelf break and fur-ther north – between Zadar and Ancona, as a result of a com-peting influence of the distance from the boundaries and a variable bottom depth. The current-meter stations were thus ideally positioned to capture seiching, and nature was coop-erative enough to provide one of the strongest seiche events on record during less than three weeks of measurements.
How important are seiche-related currents in the Adriatic? The amplitudes recorded during the episode analysed here are considerable. As already pointed out, however, the event
was one of the strongest on record. In a typical situation it may be expected that the currents will be closer to 10 cm/s, a characteristic speed of tidal currents in the Adriatic. The seiche climatology, extracted from tide-gauge records, suggests that the currents are to be expected primarily in the colder part of the year, and the present model shows that there are two areas in the Adriatic prone to be influenced by them. Long time series presently collected in the Adriatic should provide ample opportunity for a more detailed study of such currents.
Fig. 13. Model-calculated depth-averaged residual currents presented in the form of 21-h ellipses and plotted at every fifth point of the model grid for (a) the Adriatic Sea and (b) the wider area of stations L-1 and L-2. Thick lines in the lower figure show the ellipses recorded at stations L-1 (20 m) and L-2 (3 m); the ellipses depicted in this figure were slightly shifted in order to achieve clarity of presentation.
1464 N. Leder and M. Orli´c: Fundamental Adriatic seiche Acknowledgements. This work was funded by the Ministry of
Science and Technology of the Republic of Croatia (grant No. 0119330). The Meteorological and Hydrological Service of the Re-public of Croatia supplied meteorological data for Pula and Las-tovo stations and L’Agenzia per la protezione dell’ambiente e per i servizi tecnici (APAT, Italy) provided sea-level data for Otranto station. We are grateful to N. Domijan for helping us to set up the numerical model, and to K. Black and ASRltd for permission to use the model. We are also indebted to I. Vilibi´c and H. Mihanovi´c for their assistance in data processing.
Topical Editor N. Pinardi thanks B. C. Roisin for his help in evaluating this paper.
References
Accerboni, E. and Manca, B.: Storm surges forecasting in the Adri-atic Sea by means of two-dimensional hydrodynamical numeri-cal model, Boll. Geofis. Teor. Appl., 15, 3–22, 1973.
Beg Paklar, G., Isakov, V., Koraˇcin, D., Kourafalou, V., and Orli´c, M.: A case study of bora-driven flow and density changes on the Adriatic Shelf (January 1987), Cont. Shelf Res., 21, 1751–1783, 2001.
Black, K. P.: The Numerical Hydrodynamic Model 3DD and Sup-port Software, Occasional ReSup-port No. 19, Department of Earth Sciences, University of Waikato, New Zealand, 53, 1995. Black, K. P., Hatton, D., and Rosenberg, M.: Locally and
externally-driven dynamics of a large semi-enclosed bay in Southern Australia, J. Coast. Res., 9 (2), 509–538, 1993. Buljan, M. and Zore-Armanda, M.: Oceanographical properties of
the Adriatic Sea, Oceanogr. Mar. Biol. Ann. Rev., 14, 11–98, 1976.
Ceroveˇcki, I., Orli´c, M., and Hendershott, M. C.: Adriatic seiche decay and energy loss to the Mediterranean, Deep-Sea Res. I, 44, 2007–2029, 1997.
Cushman-Roisin, B. and Naimie, C. E.: A 3D finite-element model of the Adriatic tides, J. Mar. Syst., 37, 279–297, 2002.
Defant, A.: ¨Uber die Periodendauer der Eigenschwingungen des Adriatischen Meeres, Annalen der Hydrographie und maritimen Meterologie, 39, 119–130, 1911.
Defant, A.: Physical Oceanography II, Pergamon Press, New York, 598, 1961.
Dennis, R. E. and Long, E. E.: A User’s Guide to a Computer Program for Harmonic Analysis of Data at Tidal Frequencies, NOAA Technical Report No. 41, US Department of Commerce, Washington, 31, 1978.
Gill, A. E.: Atmosphere-Ocean Dynamics, Academic Press, Lon-don, 662, 1982.
Hendershott, M. C. and Speranca, A.: Co-oscillating tides in long, narrow bays; the Taylor problem revisited, Deep-Sea Res., 18, 959–980, 1971.
Hydrographic Institute: Report on Sea-Level Measurements along the East Adriatic Coast (in Croatian) 1956–2000, Split, 1957– 2001.
Hydrographic Institute: Tide Tables for 1974 – Adriatic Sea, East-ern Coast (in Croatian), Split, 1973.
Jenkins, G. M. and Watts, D. G.: Spectral Analysis and its Applica-tions, Holden Day, New York, 532, 1968.
Kasumovi´c, M.: Long-period free oscillations in the Adriatic Sea (in Croatian), Rasprave Odjela za matematiˇcke, fiziˇcke i tehniˇcke nauke JAZU, 2, 121–166, 1963.
Kesslitz, W.: Das Gezeitenph¨anomen im Hafen von Pola, Mitteilun-gen aus dem Gebiete des Seewesens, 38, 445–477, 557–608, 1910.
Kesslitz, W.: Das Gezeitenph¨anomen im Hafen von Ragusa, Mit-teilungen aus dem Gebiete des Seewesens, 40, 705–715, 1912. Kesslitz, W.: Die Gezeiten im Adriatischen Meere, Mitteilungen
aus dem Gebiete des Seewesens, 41, 1413–1436, 1913. Leder, N.: Application of spectral analysis, system analysis and
ro-tary spectral analysis in oceanography and meteorology (in Croa-tian), Hidrografski godiˇsnjak 1990-1991, 19–36, 1992.
Malaˇci´c, V., Viezzoli, D., and Cushman-Roisin, B.: Tidal dynam-ics in the northern Adriatic Sea, J. Geophys. Res., 105, 26 265– 26 280, 2000.
Manca, B., Mosetti, F., and Zennaro, P.: Analisi spettrale delle sesse dell’Adriatico, Boll. Geofis. Teor. Appl., 16, 51–60, 1974. Michelato, A., Mosetti, F., and Purga, N.: Sea level oscillations
of the Adriatic Sea computed by mathematical models, Boll. Oceanol. Teor. Appl., 3, 57–77, 1985.
Orli´c, M.: Croatian coastal waters, Section 6.3, in: Physical Oceanography of the Adriatic Sea – Past, Present and Future, edited by Cushman-Roisin, B., Gaˇci´c, M., Poulain, P. M., and Artegiani, A., Kluwer Academic Publishers, Dordrecht, 189– 214, 2001.
Proudman, J.: Dynamical Oceanography, Methuen and Co., Lon-don, 409, 1953.
Pugh, D. T.: Tides, Surges and Mean Sea-Level – A Handbook for Engineers and Scientists, John Wiley and Sons, Chichester, 472, 1987.
Raicich, F., Orli´c, M., Vilibi´c, I., and Malaˇciˇc, V.: A case study of the Adriatic seiches (December 1997), Il Nuovo Cimento, C 22, 715–726, 1999.
Schureman, P.: Manual of Harmonic Analysis and Prediction of Tides, U.S. Department of Commerce, Washington, 317, 1941. Schwab, D. J. and Rao, D. B.: Barotropic oscillations of the
Mediterranean and Adriatic Seas, Tellus, 35 (A), 417–427, 1983. Smirˇci´c, A., Vuˇcak, Z., Grˇzeti´c, Z., Leder, N., Ferenˇcak, M., and Gaˇci´c, M.: Some preliminary results of an oceanographic exper-iment in the region of Velebit Channel, Senj Gate and Kvarneri´c – March 1986 (in Croatian), Geofizika, 4, 95–109, 1987. Sterneck, R.: Die Gezeitenerscheinungen in der Adria – II
Teil – Die theoretische Erkl¨aerung der Beobachtungstat-sachen, Akademie der Wissenschaften in Wien, Denkschriften Matematisch-Naturwissenschaftliche Klasse, 96, 277–324, 1919.
Stravisi, F.: Analysis of storm surge in the Adriatic Sea by means of two-dimensional linear model, Accademia Nazionale dei Lin-cei, Rendiconti della Classe de scienze fisiche, matematiche e naturali, 54/2, 243–260, 1973.
Vercelli, F.: Le maree e le sesse nel porto di Zara, La Ricerca Sci-entifica, 12 (1), 32–42, 1941.
Vilibi´c, I.: A climatological study of the uninodal free oscillation in the Adriatic Sea, Acta Adriat., 41 (2), 89–102, 2000.
Vilibi´c, I., Leder, N., and Smirˇci´c, A.: Spectral analysis of the sea level data in the wider region of the island of Palagruˇza (in Croa-tian), Proceedings “Palagruˇza – The Pearl of the Adriatic”, Split-Kaˇstela, 353–356, 1996.
Vilibi´c, I., Leder, N., and Smirˇci´c A.: Forced and free response of the Adriatic sea level, Il Nuovo Cimento, C 21, 439–451, 1998. Wu, J.: Wind-stress coefficients over sea surface from breeze to


![[PDF] Introduction to bootstrap 3 pdf [Eng] | Cours Bootstrap](data:image/gif;base64,R0lGODlhAQABAIAAAP///wAAACH5BAEAAAAALAAAAAABAAEAAAICRAEAOw==)