HAL Id: hal-00327967
https://hal.archives-ouvertes.fr/hal-00327967
Submitted on 10 Jul 2006HAL is a multi-disciplinary open access
archive for the deposit and dissemination of sci-entific research documents, whether they are pub-lished or not. The documents may come from teaching and research institutions in France or abroad, or from public or private research centers.
L’archive ouverte pluridisciplinaire HAL, est destinée au dépôt et à la diffusion de documents scientifiques de niveau recherche, publiés ou non, émanant des établissements d’enseignement et de recherche français ou étrangers, des laboratoires publics ou privés.
Modeling of biomass smoke injection into the lower
stratosphere by a large forest fire (Part II): Sensitivity
studies
G. Luderer, J. Trentmann, T. Winterrath, C. Textor, M. Herzog, H. F. Graf,
M. O. Andreae
To cite this version:
G. Luderer, J. Trentmann, T. Winterrath, C. Textor, M. Herzog, et al.. Modeling of biomass smoke injection into the lower stratosphere by a large forest fire (Part II): Sensitivity studies. Atmospheric Chemistry and Physics Discussions, European Geosciences Union, 2006, 6 (4), pp.6081-6124. �hal-00327967�
ACPD
6, 6081–6124, 2006Modeling biomass smoke injection into
the LS (part II)
G. Luderer et al. Title Page Abstract Introduction Conclusions References Tables Figures J I J I Back Close
Full Screen / Esc
Printer-friendly Version Interactive Discussion
Atmos. Chem. Phys. Discuss., 6, 6081–6124, 2006 www.atmos-chem-phys-discuss.net/6/6081/2006/ © Author(s) 2006. This work is licensed
under a Creative Commons License.
Atmospheric Chemistry and Physics Discussions
Modeling of biomass smoke injection into
the lower stratosphere by a large forest
fire (Part II): Sensitivity studies
G. Luderer1, J. Trentmann2, T. Winterrath1,*, C. Textor3, M. Herzog4, H. F. Graf5, and M. O. Andreae1
1
Max Planck Institute for Chemistry, Dept. Biogeochemistry, Mainz, Germany
2
Institute for Atmospheric Physics, Johannes Gutenberg University Mainz, Mainz, Germany
3
Service d’A ´eronomie, CNRS, Paris, France
4
NOAA GFDL, Princeton, New Jersey, USA
5
Department of Geography, Centre of Atmospheric Science, University of Cambridge, Cambridge, UK
*
now at: German Weather Service, Offenbach, Germany
Received: 22 March 2006 – Accepted: 20 April 2006 – Published: 10 July 2006 Correspondence to: G. Luderer ([email protected])
ACPD
6, 6081–6124, 2006Modeling biomass smoke injection into
the LS (part II)
G. Luderer et al. Title Page Abstract Introduction Conclusions References Tables Figures J I J I Back Close
Full Screen / Esc
Printer-friendly Version Interactive Discussion
EGU Abstract
The Chisholm forest fire that burned in Alberta, Canada, in May 2001 resulted in injec-tion of substantial amounts of smoke into the lower stratosphere. We used the cloud-resolving plume model ATHAM (Active Tracer High resolution Atmospheric Model) to investigate the importance of different contributing factors to the severe intensification
5
of the convection induced by the Chisholm fire and the subsequent injection of biomass smoke into the lower stratosphere. The simulations show strong sensitivity of the pyro-convection to background meteorology. This explains the observed coincidence of the convective blow-up of the fire plume and the passage of a synoptic cold front.
Furthermore, we performed model sensitivity studies to the rate of release of
sensi-10
ble heat and water vapor from the fire. The release of sensible heat by the fire plays a dominant role for the dynamic development of the pyro-cumulonimbus cloud (pyroCb) and the height to which smoke is transported. While the convection is very sensitive to the heat flux from the fire, the emissions of water vapor play a less significant role.
The aerosol burden in the plume has a strong impact on the microphysical structure
15
of the resulting convective cloud. The dynamic evolution of the pyroCb, however, is only weakly sensitive to the abundance of cloud condensation nuclei (CCN) from the fire. In contrast to previous findings by other studies of convective clouds, we found that fire CCN have a negative effect on the convection dynamics because they give rise to a delay in the freezing of cloud droplets. Even in a simulation without fire CCN, there
20
is no precipitation formation within the updraft region of the pyroCb. Enhancement of convection by aerosols as reported from studies of other cases of convection is therefore not found in our study.
1 Introduction
Large forest fires regularly release enough energy to lift the smoke-laden air beyond
25
ACPD
6, 6081–6124, 2006Modeling biomass smoke injection into
the LS (part II)
G. Luderer et al. Title Page Abstract Introduction Conclusions References Tables Figures J I J I Back Close
Full Screen / Esc
Printer-friendly Version Interactive Discussion
storm clouds induced by fires are often referred to as pyro-cumulonimbus (pyroCb) (Fromm et al.,2005;Damoah et al.,2006). Due to the fire emissions of sensible heat, latent heat in the form of water vapor, and aerosol particles that can act as cloud con-densation nuclei (CCN), pyroCbs have unique dynamic and microphysical structures. It is well established that severe convection is an important mechanism for
troposphere-5
to-stratosphere transport in the mid-latitudes (Wang, 2003; Mullendore et al., 2005). Similarly, pyroCbs can reach to the upper troposphere and lower stratosphere (UT/LS) (Fromm and Servranckx,2003;Fromm et al.,2005). Due to the coincidence of the fire heating and the extremely high abundance of aerosol particles and trace gases, such as CO and NOx, in forest fire smoke, pyro-convection is a very efficient mechanism for
10
the vertical transport of these tracers and potentially contributes substantially to their budgets in the UT/LS.
Several studies report observations of smoke gases and aerosol particles in the stratosphere. Fromm and Servranckx (2003) analyzed satellite observations of the Chisholm fire plume and showed that it resulted in injection of smoke into the lower
15
stratosphere. The number of such reports from different years suggests that severe pyro-convection with subsequent stratospheric injection is not a singular event but rather a fairly common phenomenon in boreal regions (Fromm et al.,2004,2000,2005;
Waibel et al.,1999;Jost et al.,2004). Hence, biomass burning emerges as an addi-tional, previously underestimated source of aerosol and trace gases to the UT/LS
re-20
gion. The residence time of smoke is greatly enhanced at such high altitudes due to the absence of efficient removal processes such as wet deposition.
Smoke aerosol particles scatter and absorb solar radiation and therefore exert a strong effect on the Earth’s radiation budget. The radiative forcing significantly depends on the altitude of the aerosol, particularly in the case of absorbing aerosol (Cook and
25
Highwood, 2004). The stratospheric aerosol burden has a substantial influence on climate. It is well established that major volcanic eruptions have resulted in significant surface cooling on timescales of up to two to three years in low latitudes and have also altered atmospheric dynamics leading to mid-latitude winter warming over the
ACPD
6, 6081–6124, 2006Modeling biomass smoke injection into
the LS (part II)
G. Luderer et al. Title Page Abstract Introduction Conclusions References Tables Figures J I J I Back Close
Full Screen / Esc
Printer-friendly Version Interactive Discussion
EGU
northern continents (Robock, 2000). Similar, yet weaker effects are to be expected from stratospheric layers of biomass burning smoke (Fromm et al.,2004). The injection of smoke also has the potential to significantly perturb lower stratospheric chemistry. The smoke alters the ozone chemistry through both gas phase processes induced by the injected smoke gases as well as heterogenous processes on the aerosol particles.
5
Fromm et al.(2005) report observations of enhanced ozone in a lower stratospheric
smoke plume.
Detailed investigations of pyro-convection on the spatial scale of individual events using cloud-resolving models (CRMs) are very important for the study of the vertical and cross-isentropic transport mechanisms responsible for stratospheric injection.Jost
10
et al. (2004) reported in-situ observations of smoke, originating from a boreal forest fire, deep in the stratosphere at potential temperatures of 380 to 390 K over Florida in July 2002. They also performed calculations with a Lagrangian transport model based on the European Center for Medium Range Weather Forecasting (ECMWF) reanalysis with a horizontal resolution of 0.5×0.5 degrees. The vertical transport in the model
15
calculation, however, was not strong enough to reproduce the observed altitude of the smoke layer. Similarly, whileDamoah et al.(2006) were able to reproduce the overall features of the smoke plume, their Lagrangian particle dispersion model simulations underestimated the observed plume height even when a convective transport parame-terization was activated.
20
Atmospheric convection is one of the most complex problems in geophysical fluid dynamics (Emanuel,1994). The evolution of deep convection depends on the ambient profiles of temperature, humidity and wind shear (e.g.Houze,1993). Deep convection over land is typically initiated by inhomogeneities at the surface, such as orography, areas of low albedo and heat sources at the ground, or by frontal lifting in synoptic
sys-25
tems. In the case of convection triggered by forest fires, the fire emissions of sensible heat, latent heat in the form of water vapor, and aerosol particles acting as CCN are additional parameters influencing cloud dynamics. We assessed the effects of the pa-rameters most relevant to pyro-convection individually in a series of model simulations.
ACPD
6, 6081–6124, 2006Modeling biomass smoke injection into
the LS (part II)
G. Luderer et al. Title Page Abstract Introduction Conclusions References Tables Figures J I J I Back Close
Full Screen / Esc
Printer-friendly Version Interactive Discussion
These variables interact in a complex and non-linear way. Due to the complexity of our simulations and computational limitations, it was not, however, possible to perform an exhaustive number of simulations to cover the entire multi-dimensional parameter space.
The sensitivity studies presented here enable us to provide a fundamental
under-5
standing of relevant physical processes and to identify the key mechanisms for the de-velopment of the extremely vigorous pyro-convection that occurred over the Chisholm fire (Fromm and Servranckx, 2003). In the existing literature, there is not much knowledge about the relative significance of fire heating, moisture release, aerosol-microphysics interactions, and meteorology for the enhancement of wildfire-induced
10
pyro-convection. For the scenario of large-scale urban fires created from a nuclear burst,Penner et al. (1986) concluded from numerical simulations that the amount of smoke deposited in the stratosphere critically depends on the intensity of the heat re-leased, the background stability of the atmosphere, the amount of water vapor in the background atmosphere, and the background wind speeds. In a similar study,Small
15
and Heikes (1988) found the sensitivity of the convection to ambient moisture to be particularly significant. This is consistent with evidence that the occurrence of pyroCbs tends to coincide with passing cold fronts, during which the convective instability and humidity of the background atmosphere is high (Fromm and Servranckx,2003;Fromm
et al.,2005). Potter(2005) postulated that moisture released by the fire itself can also
20
play an important role in the dynamics of convection induced by wildfires.
Recent observational studies found evidence that microphysical effects of aerosol pollution can significantly enhance the vertical development of convection. Andreae
et al. (2004) reported in-situ observation of pyro-convection and cumulus convection in smoky conditions in Amazonia which was significantly more vigorous than deep
25
convection in clean conditions. From analysis of satellite data,Koren et al.(2005) found strong correlations between aerosol abundance and cloud top pressure for convective clouds over the northern Atlantic, indicating a positive feedback of aerosol pollution and convection dynamics. A modeling study of deep-convective tropical clouds by
ACPD
6, 6081–6124, 2006Modeling biomass smoke injection into
the LS (part II)
G. Luderer et al. Title Page Abstract Introduction Conclusions References Tables Figures J I J I Back Close
Full Screen / Esc
Printer-friendly Version Interactive Discussion
EGU Wang(2005) showed that increasing CCN resulted in stronger convection caused by
increased condensation. Such aerosol-cloud interactions, however, critically depend on the specific temperature and humidity profiles (Graf,2004).
The Chisholm fire was located at 54.5◦N, 114.5◦W in Alberta, Canada and resulted in severe pyro-convection on 28/29 May 2001. It is a particularly well documented
5
case of biomass smoke injection into the stratosphere and therefore is well suited as a case study. In their paper,Fromm and Servranckx (2003) were able to establish a direct connection between the observations of the Chisholm pyroCb convection and a smoke layer that was observed in the UT/LS region in the subsequent days. This event gave rise to significantly enhanced lower stratospheric aerosol burden in the northern
10
summer of 2001 (Fromm and Servranckx,2003). Analysis of remote sensing data from space-borne platforms as well as RADAR data provide us with a detailed picture of the evolution of this pyroCb event (Rosenfeld et al., 2006)1.
Here and in the companion paper by Trentmann et al. (2006) we present, for the first time, three-dimensional model simulations of wildfire-induced cross-tropopause
15
transport of biomass burning smoke and its sensitivity to fire activity and background meteorology. WhereasTrentmann et al.(2006) present and discuss the results from the reference simulation, this paper focuses on the sensitivity studies conducted. It is organized as follows. In the next section, the ATHAM model and its setup for the simulation of the Chisholm fire are described. The variability of various parameters
20
is discussed and the sensitivity studies conducted are described in Sect.3. Results from the sensitivity studies are presented and discussed in Sect. 4. A summary and concluding remarks follow in the last section.
1
Rosenfeld, D., Fromm, M., Trentmann, J., et al.: The Chisholm firestorm: observed mi-crostructure, precipitation and lightning activity, in preparation, 2006.
ACPD
6, 6081–6124, 2006Modeling biomass smoke injection into
the LS (part II)
G. Luderer et al. Title Page Abstract Introduction Conclusions References Tables Figures J I J I Back Close
Full Screen / Esc
Printer-friendly Version Interactive Discussion
2 Model setup
All simulations presented here were performed with the Active Tracer High resolution Atmospheric Model (ATHAM) (Oberhuber et al.,1998;Graf et al.,1999;Herzog et al.,
1998). The dynamic core of ATHAM is based on a centered differences discretization of the governing equations. The tracer advection is formulated in mass-conserving
5
form. For realistic simulation of entrainment of environmental air into the plume, sub-grid scale turbulence is explicitly parameterized using an extended TKE approach with anisotropic representation of horizontal and vertical turbulence (Herzog et al.,2003). The microphysics is represented using a two-moment scheme with four hydrometeor classes (cloud droplets, rain drops, small ice crystals, graupel) (Textor et al.,2006a,b).
10
For all simulation runs presented here, the model was set up in the same way as described inTrentmann et al.(2006). The fire forcing is assumed to be constant during the time span simulated and represented as a rectangular front of 15 000 m length and 500 m width. The model domain is 85 km in the direction along the fire front and 65 km across, with the upper boundary at 26 000 m. The number of grid points used
15
is 110×85 in the x- and y-directions and 100 in the z-direction. We used a focusing grid with maximum resolution at the fire and its vicinity, where the gradients of tracer concentrations and temperature are largest. Towards the edges of the model domain, the grid spacing is larger. In the horizontal, the minimum grid spacing was set to 100 m perpendicular to the fire front and 500 m along the front. In the vertical, we used two
20
regions of enhanced spatial resolution: the grid spacing was 50 m at the ground and, for more accurate simulation of troposphere-to-stratosphere transport, 150 m at the tropopause. In the mid-troposphere, the maximum vertical spacing was 300 m.
The reference simulation (REF) is identical to the simulation presented inTrentmann
et al. (2006). The fire was assumed to consume 9 kg m−2 with a rate of spread of
25
1.5 m s−1. In this simulation run we assumed that 100% of the fire energy goes into the heating of the atmospheric layer over the fire, i.e., radiative losses were assumed to be zero. A fuel moisture value of 40% based on dry fuel mass was assumed. For
ACPD
6, 6081–6124, 2006Modeling biomass smoke injection into
the LS (part II)
G. Luderer et al. Title Page Abstract Introduction Conclusions References Tables Figures J I J I Back Close
Full Screen / Esc
Printer-friendly Version Interactive Discussion
EGU
the aerosol emissions, we used an emission factor for total particulate matter (TPM) of 17.6 gTPMkg−1fuel (Andreae and Merlet,2001) and assumed a volume mean diameter of 0.2 µm, which is consistent with Reid et al. (2005). Based on parcel model stud-ies (Martin Simmel, personal communication), we estimated that 5% of the aerosol particles from the fire become activated as cloud droplets. This results in an effective
5
CCN flux of 2.1×10⁵m−1s−1 per unit length of the fire front. Background meteorology was adopted from radiosonde observations that were performed at Edmonton (53.5◦N, 114.1◦W), about 150 km south of the fire location, at 00:00 UTC, shortly before the time of the blow-up and is likely to closely match the meteorological background condition for the Chisholm pyroCb.
10
3 Sensitivity studies conducted
3.1 Fire activity
The combustion of biomass results in enormous emissions of sensible heat, latent heat in the form of water vapor, aerosol particles, and trace gases from forest fires. The emission of sensible heat clearly plays an important role in triggering convection and
15
in adding to the buoyancy of smoky air parcels relative to the ambient air. For given assumptions on the amount of fuel burned, heat of combustion and rate of spread, the head fire intensity, i.e., the combustion energy per unit time and unit length of the fire front, can be readily calculated (Byram,1959). In the case of the Chisholm fire, these values are documented and discussed in ASRD (2001). Large uncertainties
20
are associated with these values, however. In addition, the fraction of the combustion energy that is lost radiatively without becoming available for the convection is highly uncertain (Trentmann et al.,2006).
In order to assess the role of the fire sensible heat for the Chisholm pyro-convection, the two experiments SH50 and SH25 were conducted for which the sensible heat flux
25
ACPD
6, 6081–6124, 2006Modeling biomass smoke injection into
the LS (part II)
G. Luderer et al. Title Page Abstract Introduction Conclusions References Tables Figures J I J I Back Close
Full Screen / Esc
Printer-friendly Version Interactive Discussion
The combustion of biomass results not only in emission of sensible heat, but also releases water vapor. Moisture is released through the chemical transformation of the carbohydrates (combustion moisture) as well as the evaporation of water that was already contained in the fuel tissue (fuel moisture). According to the stoichiometric equation for the combustion process (Byram, 1959), in addition to the fuel moisture,
5
about 0.5 kg of combustion moisture are released per kg of fuel. Due to the large amount of duff burned, we estimated that the effective fuel moisture content was 40%, which yields total water emissions of 0.9 kgH
2Okg
−1
fuel (Trentmann et al.,2006). For the investigation of its impact on the pyro-convection, the simulation noH2O was set up neglecting water vapor emissions from the fire.
10
Since aerosol particles act as cloud condensation nuclei (CCN), the cloud micro-physics is strongly affected by their abundance. It is well established that increased availability of condensation nuclei in polluted clouds results in a much larger number of cloud droplets being activated compared to clean clouds, giving rise to the indirect aerosol effects (Lohmann and Feichter,2005). Droplets compete for a given amount of
15
water vapor available, therefore the droplet size distribution in polluted clouds is shifted to much smaller sizes. As various microphysical processes are strongly sensitive to the droplet size, the change in size spectrum induced by pollution with aerosol significantly alters the cloud properties and precipitation efficiency.
For deep-convective cloud systems, aerosol-microphysics interactions can have a
20
strong impact on the convection dynamics. As proposed byRosenfeld(2000), pollution from aerosols can result in vertically delayed onset or even complete suppression of precipitation through warm rain formation. On the other hand, if the convection is sufficiently strong, mixed phase microphysics can lead to stronger precipitation higher
up (Andreae et al., 2004). The smoke emitted by the fire contains large numbers
25
of aerosol particles acting as CCN. The co-existence of strong deep convection and extreme aerosol concentration makes pyro-clouds well-suited objects for the study of aerosol-microphysics interactions and their impact on convection dynamics. At the same time, pyro-clouds are peculiar in their dynamic structure because of the extreme
ACPD
6, 6081–6124, 2006Modeling biomass smoke injection into
the LS (part II)
G. Luderer et al. Title Page Abstract Introduction Conclusions References Tables Figures J I J I Back Close
Full Screen / Esc
Printer-friendly Version Interactive Discussion
EGU
vigor induced by the heating from the fire. There is also a strong influence of the dynamics, particularly the updraft velocities, on cloud microphysics and precipitation formation. In smoky environments and pyro-convection in the Amazon region,Andreae
et al. (2004) observed strongly delayed onset of precipitation compared to clouds in clean conditions, which resulted in more vigorous convection once the glaciation level
5
was reached.
In the experiment loCCN, we tested the sensitivity of the Chisholm pyroCb to the enhanced availability of CCN from the fire by performing a sensitivity study in which we assumed that the aerosol particles emitted by the fires are inactive as CCN. In this scenario, the formation of clouds was based on the assumption of a CCN concentration
10
of 200 cm−3, a value representative of clean conditions in remote continental areas (Pruppacher and Klett,1997).
3.2 Background meteorology
The development of extremely strong pyroCbs in boreal regions is almost always ob-served to coincide with the passage of synoptic cold fronts (Fromm et al.,2000,2005;
15
Fromm and Servranckx,2003). Typically, large pyroCb events are favored when hot
and dry air masses associated with a high pressure system are replaced by colder, less stable air masses.
There are clear indications for a connection between a passing cold front and the intensification of the convection induced by the Chisholm fire. The development of the
20
Chisholm pyroCb was captured by remote sensing from several platforms (Rosenfeld et al., 2006)1. RADAR observations show a convective rain band propagating through the fire region from the southwest, a typical signature of a cold front. Whereas the fire convection was moderate and fanning before the passage of the front, it intensified into severe pyro-convection at 02:00 UTC, exactly upon the arrival of the rain band.
25
Similarly, observations from the Advanced Very-High Resolution Radiometer (AVHRR) show that the blow-up occurred during the passage of the cloud band associated with the cold front (Fromm and Servranckx,2003). As measured by the automated weather
ACPD
6, 6081–6124, 2006Modeling biomass smoke injection into
the LS (part II)
G. Luderer et al. Title Page Abstract Introduction Conclusions References Tables Figures J I J I Back Close
Full Screen / Esc
Printer-friendly Version Interactive Discussion
stations in the Chisholm region, temperature dropped by more than 10 K between 1700 and 2000 LT (23:00–02:00 UTC) on 28/29 May (ASRD, 2001), just before the pyro-convection was observed to peak by the RADAR observations. This temperature de-crease occurred before sunset and is much greater than the typical diurnal variation in the late afternoon.
5
Meteorological conditions affect deep pyro-convection in several ways. As shown for the reference simulation (Trentmann et al.,2006), the energy budget of the Chisholm pyroCb is dominated by the release of latent heat from condensing water vapor. Most of this water vapor, however, is entrained from the ambient atmosphere, whereas the contribution of the water vapor released by the fire accounts for only a small fraction
10
of less than 10% (Trentmann et al., 2006). This underlines the dominant role of at-mospheric conditions, especially the convective instability, humidity and wind shear for the evolution of pyro-convection. Wind speed and wind shear affect turbulent mix-ing and hence the amount of entrainment at various altitude levels. For the case of the Chisholm pyroCb, the amount of air entrained from intermediate tropospheric
al-15
titude levels is comparable to the entrainment within the boundary layer (Trentmann
et al., 2006). This has important implications for the sensitivity of the convection to the meteorological conditions, i.e., temperature, humidity and wind field in the middle troposphere.
Since the fire front is approximately linear, the orientation of the low level wind field
20
relative to the fire front plays an important role. The passing cold front resulted in a change of the wind field, with surface wind gusts from changing directions (ASRD,
2001). During the passage of the cold front, the surface wind was oriented almost parallel to the fire front. In this configuration, the air parcels were advected along the fire front, exposing them to the heating of the fire for a maximum period of time while
25
minimizing the entrainment of ambient air.
Since we did not explicitly represent the feedback of the atmospheric conditions on the fire behavior in ATHAM, the assessment of the contribution of the atmosphere-fire-feedback to the sensitivity to background meteorology is not considered in this study.
ACPD
6, 6081–6124, 2006Modeling biomass smoke injection into
the LS (part II)
G. Luderer et al. Title Page Abstract Introduction Conclusions References Tables Figures J I J I Back Close
Full Screen / Esc
Printer-friendly Version Interactive Discussion
EGU
For our simulations, the fire activity as well as fluxes of sensible heat, moisture and aerosol particles were prescribed based on the observed fire activity as documented inASRD(2001).
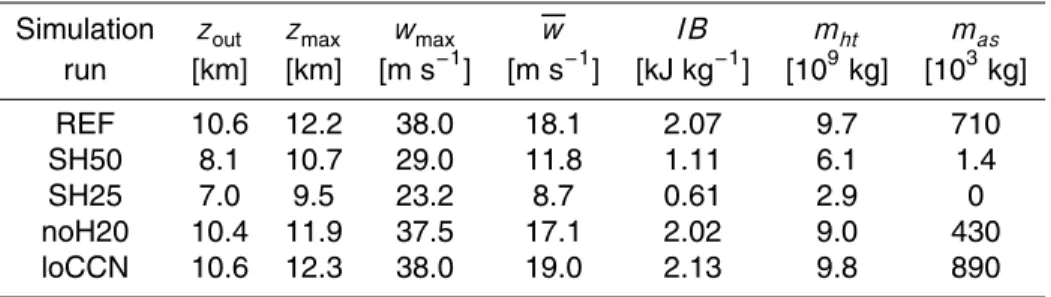
The meteorological situation at the time of the blowup is depicted in Fig.1. For the reference simulation, we used the sounding from RAOB station 71 119 (Edmonton,
5
150 km south of the fire) launched at 00:00 UTC.
In a set of sensitivity experiments, we assessed the influence of changing back-ground meteorology on the fire convection. Since there were not a sufficient num-ber of observations available, we relied on ECMWF reanalysis data for this purpose. We chose three meteorological profiles representative of pre-frontal (simulation PRE),
10
frontal (FRONT), and post-frontal (POST) conditions from different locations in the op-erational ECMWF reanalysis for 29 May 2001, 00:00 UTC (Fig. 1). For these three experiments, all parameters describing the fire forcing, namely the geometry of the forcing and the release of sensible heat, water vapor, as well as aerosol particles were set equal to those in REF.
15
The vertical profiles of temperature, dew point temperature, and wind vectors used are depicted in skew T -log(p) diagrams in Figs. 2a–c. For comparison, the radiosonde sounding from 53.5◦N, 114.1◦W at 00:00 UTC, which was used for the reference sim-ulation, is shown in Fig. 2d. Table 2 gives values for convective available potential energy (CAPE), water vapor column, and equivalent potential temperature for the four
20
profiles.
The pre-frontal profile (53◦N, 111◦W) is characterized by rather warm temperatures throughout the lower and middle troposphere with low relative humidities around 30– 40% at low levels and very dry air masses in the middle and upper troposphere above 600 hPa. In the boundary layer, the stratification is approximately neutral, and the
tem-25
perature gradient is close to the saturated adiabatic lapse rate in the free troposphere. The low level wind speed is about 17 m s−1from southeasterly directions.
For the frontal profile (54◦N, 116◦W), the boundary layer is still warm, whereas the free troposphere is already influenced by colder air masses. The air is rather moist
ACPD
6, 6081–6124, 2006Modeling biomass smoke injection into
the LS (part II)
G. Luderer et al. Title Page Abstract Introduction Conclusions References Tables Figures J I J I Back Close
Full Screen / Esc
Printer-friendly Version Interactive Discussion
throughout the lower and middle troposphere up to about 400 hPa. At this level, the wind continues to blow from southeasterly directions at slightly lower wind speeds than in the pre-frontal profile. At higher levels, in contrast, the upper level trough gives rise to strong southerly winds of around 30 m s−1.
The post-frontal profile (56◦W, 117◦N) is characterized by low level temperatures that
5
are significantly cooler than in the pre-frontal and frontal profiles. The relative humidity is high in the boundary layer, but decreases strongly in the free troposphere. The atmosphere is stably stratified in the lower troposphere and the temperature decreases with an approximately moist-adiabatic lapse rate in the free troposphere. Whereas low level winds are rather weak, there is a strongly pronounced upper level jet blowing from
10
southerly directions similar to the frontal profile.
Due to the high humidity and warm temperatures, the equivalent potential temper-ature in the boundary layer is greatest for frontal conditions (Table 2). Using parcel theory, its convective instability can be quantified in terms of the convective available potential energy (CAPE) (Emanuel, 1994). It is greatest for the frontal profile with
15
CAPE=1170 J kg−1. For both the pre- and post-frontal profiles, the convective instabil-ity is rather low, with CAPE values of 40 and 30 J kg−1, respectively.
The radiosonde profile features a deep boundary layer similar to PRE with warm temperatures and 30% relative humidity at the surface. Due to the low humidity levels close to the ground, its nominal CAPE value is much lower than the one obtained for
20
REF. Above 700 hPa, by contrast, the sounding is moist with humidities close to sat-uration. There is substantial entrainment of air into the pyroCb at intermediate levels, therefore the humidity there strongly influences the convection, which is not reflected in the calculation of CAPE. Upper level winds are significantly weaker than in FRONT and POST. Surface winds blow from the south and veer to southeasterly directions in
25
ACPD
6, 6081–6124, 2006Modeling biomass smoke injection into
the LS (part II)
G. Luderer et al. Title Page Abstract Introduction Conclusions References Tables Figures J I J I Back Close
Full Screen / Esc
Printer-friendly Version Interactive Discussion
EGU
4 Results
4.1 Definitions and analysis methods
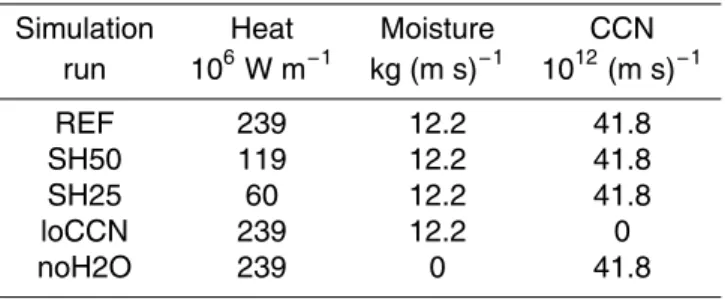
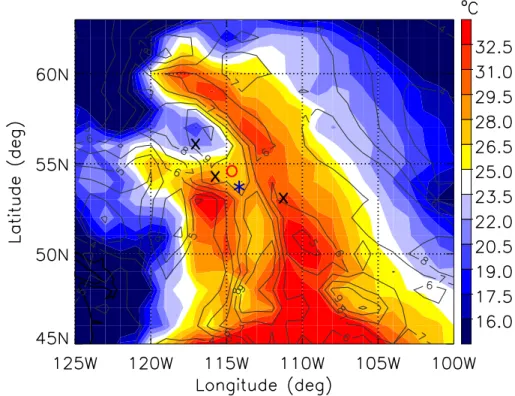
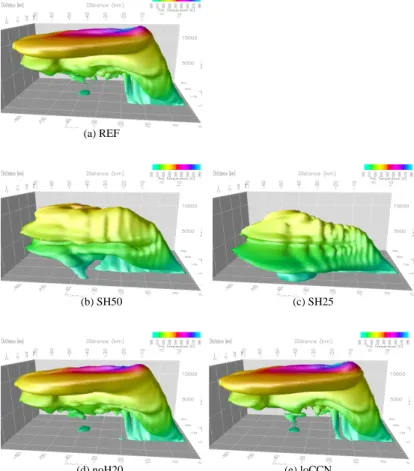
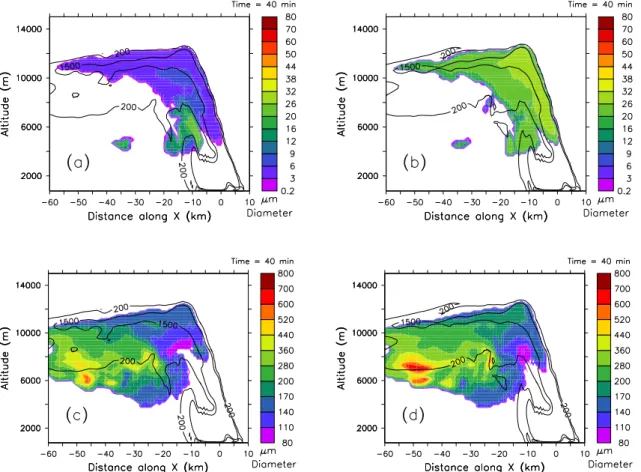
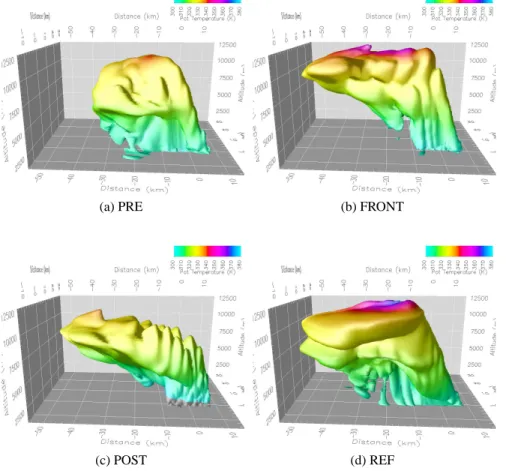
We used different parameters and analysis methods to characterize the results from the various numerical experiments. The relevant definitions are introduced in the following. The resulting numerical values are summarized in Tables 3 and 4. Figures 3 and
5
8 show 3-D visualizations of the modeled smoke plumes as 100 µg m−3 aerosol iso-surfaces with potential temperature as color shading.
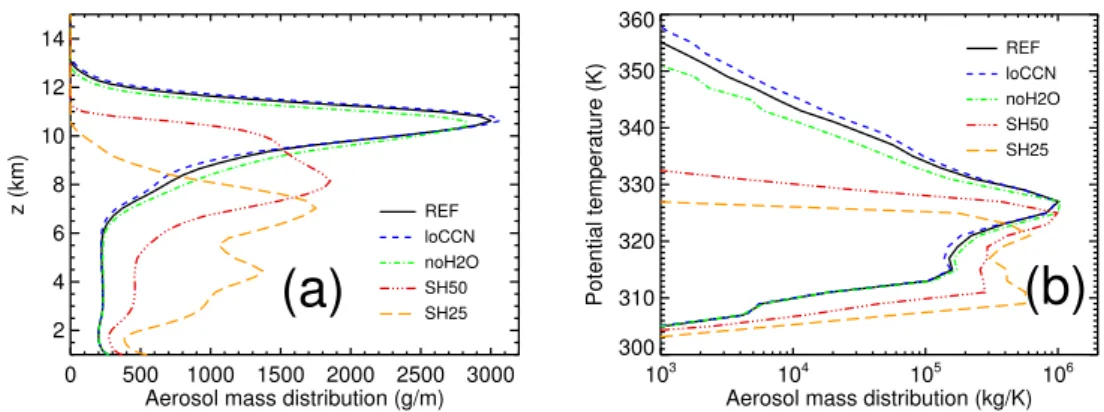
Stratospheric penetration and the height to which the smoke is transported were assessed by means of the vertical aerosol distribution as a function of geometrical height (Fig.4a) and potential temperature (Fig.4b). The outflow height zoutwas defined
10
as the geometrical level of the maximum of the vertical aerosol profile. We also defined the maximum penetration height zmaxas the level below which 99% of the aerosol mass is located. All altitude levels are given as height above sea level. The ground level was 695 m, 940 m and 640 m, for PRE, FRONT and POST, respectively, and 770 m for REF. In the absence of diabatic processes (radiation, microphysical processes, turbulent
15
mixing), long range transport of air parcels in the lower stratosphere occurs along isen-tropes. The aerosol mass distribution as a function of potential temperature (Fig.4b) is therefore useful for the assessment of troposphere-to-stratosphere transport. Due to the large gradients of the potential temperature at the tropopause and above, this region is better resolved in this representation compared to the lower troposphere. In
20
order to better represent the low yet significant aerosol mass above the tropopause we used a logarithmic scale. We masked out the region of high temperatures directly above the fire by only considering aerosol above 5 km.
The dynamical tropopause (PV=2 PVU) over the Chisholm region was located at a potential temperature of about 332 K at 11 km altitude. The stratospheric aerosol
25
injection was estimated as total mass, mas, above this potential temperature level. The tropopause level was similar for the PRE, FRONT, and POST profiles, hence for all simulation runs the same threshold value of 332 K was assumed for the estimation
ACPD
6, 6081–6124, 2006Modeling biomass smoke injection into
the LS (part II)
G. Luderer et al. Title Page Abstract Introduction Conclusions References Tables Figures J I J I Back Close
Full Screen / Esc
Printer-friendly Version Interactive Discussion
of aerosol injection into the stratosphere. Whereas mas is very useful for comparing the different simulations, its absolute value should be treated with caution. Due to the large vertical gradient in the aerosol concentration near the tropopause, it is extremely sensitive to the tropopause definition and the simulation time. Since our simulations did not account for removal by scavenging of interstitial aerosol particles, the numerical
5
value of mascan be considered an estimate of the upper limit of aerosol mass injected into the stratosphere.
We also used different parameters to characterize the vigor and the energy budget of the pyro-convection for the various cases. The maximum vertical velocity wmax is located close to the ground and mostly influenced by the fire forcing. Therefore, we
10
additionally defined the mean updraft velocity as a parameter that is more characteristic of the convection throughout the entire vertical column of the cloud:
w= 1
R cad V Z
wcad V. (1)
In order to represent the conditions in the updraft region of the pyro-cloud, the integra-tion was performed over all grid boxes with more than 0.05 g kg−1hydrometeor content
15
and vertical velocity w≥5 m s−1, and the aerosol mass concentration cawas used as a weight function.
For the characterization of the pyroCb’s updraft region, we defined the mean vertical profile of any quantity Q as
Q(z)= R Q(x, y, z)w(x, y, z)ca(x, y, z) dxd y
R wcadxd y , (2)
20
where the vertical aerosol flux wca was used as a weight function and the integration was performed for w>0.
ACPD
6, 6081–6124, 2006Modeling biomass smoke injection into
the LS (part II)
G. Luderer et al. Title Page Abstract Introduction Conclusions References Tables Figures J I J I Back Close
Full Screen / Esc
Printer-friendly Version Interactive Discussion
EGU
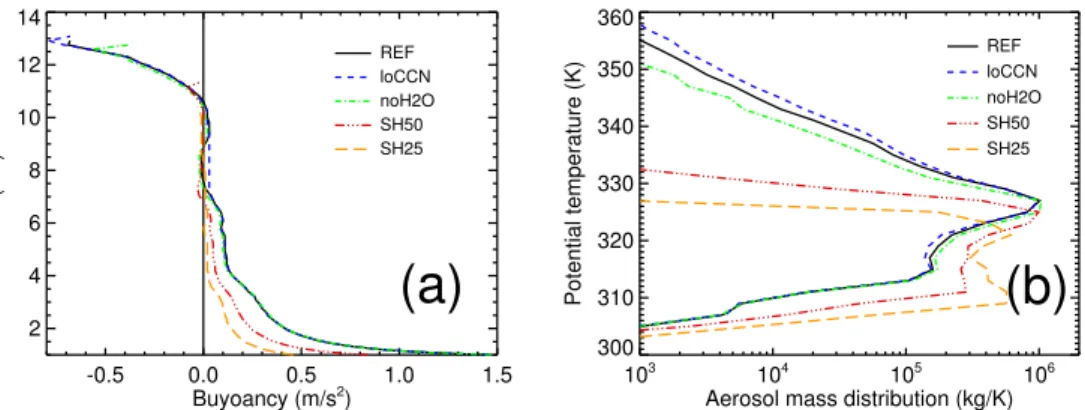
in Figs.5and10. The buoyancy b was calculated as
b(x, y, z)= g ρ(x, y, z) − ρe(z)
ρe(z) , (3)
where g is the acceleration of gravity and the in situ density ρ(x, y, z) and environ-mental density ρe(z) were determined with consideration of the density effects of water vapor and hydrometeor content.
5
The vertical mean buoyancy b can be readily determined according to Eq. (2). The integrated buoyancy IB can then be defined as
IB= ZZLNB
Z0
b(z)d z, (4)
where the integration is performed from ground level Z0to the level of neutral buoyancy ZLNB with b(ZLNB)=0. IB indicates the amount of potential energy a smoky air parcel
10
extracts from its buoyancy traveling from the fire to its LNB. It is closely related to CAPE. Whereas the CAPE concept considers the energy of an air parcel traveling from the boundary layer to its LNB and neglects effects of mixing, the IB concept calculates the effective energy for the vertical column under full consideration of entrainment, and also accounts for the effects of additional heat sources such as the fire forcing. In
15
contrast to CAPE, however, detailed information about vertical profiles of temperature, moisture and hydrometeor loading within the convection is required.
The results obtained for the reference simulation REF are presented in detail in
Trent-mann et al. (2006). In the following, the results of the sensitivity experiments are com-pared with those of REF.
20
4.2 Fire release of sensible heat
From the results obtained for SH50 and SH25, the sensitivity studies with the sensible heat release from the fire reduced to 50 and 25% of the original value, respectively,
ACPD
6, 6081–6124, 2006Modeling biomass smoke injection into
the LS (part II)
G. Luderer et al. Title Page Abstract Introduction Conclusions References Tables Figures J I J I Back Close
Full Screen / Esc
Printer-friendly Version Interactive Discussion
a strong dependence of the cloud vertical plume development on the fire heating is clearly evident (Figs. 3 and 4). In the reference simulation REF most of the smoke outflow from the pyroCb occurs in the tropopause region and slightly below. Strato-spheric penetration can be inferred from the high potential temperatures at the plume top, with red, purple and blue colors in Fig.3a indicating potential temperatures above
5
∼335 K. The plume exhibits a region where the cloud-aerosol mixture overshoots be-yond the level of the anvil. Near the overshoot, the plume reaches maximum potential temperatures in excess of 350 K. Satellite observations of this “warm core” were also reported byFromm and Servranckx(2003). By contrast, for the SH50 simulation and to a yet larger extent for SH25, the vertical development of the plume is much weaker
10
with a much less established updraft region (Fig.3b, c). Gravity-wave-like features are apparent, however there is no distinct overshoot nor any warm core region. In both sim-ulations, the plumes do not reach beyond the tropopause and remain at tropospheric potential temperature and altitude levels.
For the simulations with reduced sensible heat release, the vertical distribution of
15
aerosol mass is more diffuse and strongly shifted towards lower altitudes (Fig. 4a), with outflow heights at 8.1 km for SH50 and 7.0 km for SH25, compared to 10.6 km for REF. REF had a maximum penetration height zmax=12.2 km, whereas SH50 and SH25 only reached to zmax=10.7 km and zmax=9.5 km, respectively (Table3).
In Fig.4b, the difference between SH25, SH50 and REF is even more evident than
20
in Fig.4a. In REF, 7.1×10⁵kg of aerosol mass, a minor yet significant fraction (7%) of the total 8.9×10⁶kg of aerosol released by the fire, is injected above the tropopause after 40 min integration time. Both the SH50 and the SH25 plumes, on the other hand, are not able to overcome the tropopause mixing barrier. The SH50 plume features large amounts of aerosol mass in the upper troposphere with the maximum of the
25
distribution about 5 K below the tropopause, however there is almost no aerosol above 332 K (Fig.4b).
Both the w and wmaxstrongly depend on the amount of sensible heat released by the fire: w after 40 min integration time drops from 18.1 m/s for REF to 11.8 m/s for SH50
ACPD
6, 6081–6124, 2006Modeling biomass smoke injection into
the LS (part II)
G. Luderer et al. Title Page Abstract Introduction Conclusions References Tables Figures J I J I Back Close
Full Screen / Esc
Printer-friendly Version Interactive Discussion
EGU
and 8.7 m/s for SH25, with a similar decrease in wmax(3). IB was found to be almost linearly proportional to the released sensible heat: Whereas REF resulted in a value of 2070 J/kg, IB was reduced to 1110 J/kg for SH50 and 610 J/kg for SH25.
Also the hydrometeor formation is very sensitive to the sensible heat forcing by the fire. After 40 min, 9.7×10⁹kg of hydrometeor mass was formed in REF, significantly
5
more than the 6.1×10⁹kg and 2.9×10⁹kg obtained for SH50 and SH25, respectively. The vertical profiles of hydrometeor mixing ratios (Fig. 5b) show that particularly at higher levels much less water is condensed for SH50 and SH25, because the pyroCbs do not reach as high and become diluted at a much lower level. Hence, the higher the release of sensible heat by the fire, the more efficient is the pyroCb at accessing
10
the latent heat available from the background and fire moisture. Considering that the latent heat from the condensation of hydrometeors contributes much more to the po-tential temperature gain of air parcels in the pyroCb than the fire energy (Trentmann
et al.,2006), this positive feedback is an important aspect for the explanation of the invigoration of the pyro-convection due to fire heating.
15
4.3 Fire release of moisture
In contrast to the sensible heat, the release of latent heat by the fire was found to be of rather low significance for the evolution of the Chisholm pyroCb. The 3-D structure of the plume obtained for noH2O, the simulation without any moisture release from the fire, is similar to that obtained for REF (Fig.3a, d). The differences in IB, maximum
20
and mean vertical updraft speed are also rather small (Table3). The total hydrome-teor mass for noH2O only decreased by 8% compared to REF. This is consistent with the result fromTrentmann et al.(2006), where we reported that the fire moisture only accounts for less than 5–10% of the pyro-cloud’s water budget, whereas most of the humidity and condensed water within the cloud stems from entrained environmental air.
25
The low contribution of the fire moisture to cloud water and convection dynamics found here does not support the hypothesis fromPotter(2005), who stated that it constituted a major portion of the cloud water and significantly influenced convection.
ACPD
6, 6081–6124, 2006Modeling biomass smoke injection into
the LS (part II)
G. Luderer et al. Title Page Abstract Introduction Conclusions References Tables Figures J I J I Back Close
Full Screen / Esc
Printer-friendly Version Interactive Discussion
Considering the vertical aerosol mass distribution, we found that the outflow level zout of the pyro-cloud and the maximum penetration height zmax are shifted by only 0.2 and 0.3 km towards lower altitudes for noH2O compared to REF (Fig. 4a). Due to the lack of latent heat released from the fire, however, the aerosol distribution as a function of potential temperature (Fig.4b) exhibits significantly lower aerosol mass at
5
potential temperatures above the peak outflow level. Consequently, the total aerosol mass above 332 K is 4.3×10⁵kg for noH20, i.e., 35% lower than for REF.
4.4 Sensitivity to CCN emissions
For the loCCN simulation, the sensitivity study assuming that the fire aerosol parti-cles are inactive as CCN, we found rather small effects of the aerosol burden on the
10
dynamics. In contrast to results from observational studies of pyro-clouds in the Ama-zon (Andreae et al., 2004), our results suggest that the vertical development of the Chisholm pyroCb would have been even slightly more vigorous without the fire aerosol. As depicted in Fig.3e, the 3-D structure of the smoke plume is very similar to the one obtained for REF, albeit with a slightly higher overshoot and somewhat increased
po-15
tential temperatures in the warm core region. The vertical aerosol mass distribution is also almost equal to the result for REF, but features a maximum penetration height zmax that is about 100 m higher than that of REF (Fig.4a). Again, the differences between loCCN and REF are more pronounced in the distribution of aerosol mass as a function of potential temperature. As shown in Fig.4b, there is significantly more aerosol mass
20
in the distribution’s upper tail at high potential temperatures. We found an aerosol mass of 8.9×10⁵kg injected above the 332 K tropopause level for loCCN, substantially more than the 7.1×10⁵kg found for REF.
The other parameters describing the dynamic evolution of the pyroCb also show that the omission of aerosol effects results in marginally stronger updraft dynamics. Both
25
the mean updraft velocity w and the maximum updraft wmax are slightly larger than in REF (Table3). Also, IB obtained for loCCN is 2130 J kg−1, about 40 J kg−1 more than in REF.
ACPD
6, 6081–6124, 2006Modeling biomass smoke injection into
the LS (part II)
G. Luderer et al. Title Page Abstract Introduction Conclusions References Tables Figures J I J I Back Close
Full Screen / Esc
Printer-friendly Version Interactive Discussion
EGU
In contrast to the dynamics, the cloud microphysics is strongly impacted by the fire aerosol. As expected, the size of the hydrometeors in the reference study is much smaller than in loCCN (Fig.6). The hydrometeors of the small classes (cloud droplets and ice crystals) are most abundant in the updraft region above the fire and the upper part of the anvil. For REF their volume mean diameters (VMD) are smaller than 10 µm
5
throughout this region, with the exception of cloud areas outside of the smoke plume or regions greatly diluted with ambient air masses (Fig.6a). For droplets of this size, autoconversion, i.e., formation of larger drops as a result of collision and coalescence among small droplets, is inefficient, hence warm rain formation is strongly suppressed. For loCCN, on the other hand, the VMD of the cloud droplets and ice crystals are
10
20–30 µm (Fig.6b), a size where coagulation of droplets becomes active (Pruppacher
and Klett,1997). For the large hydrometeors, however, the difference between REF and loCCN is somewhat less pronounced. This size class is dominated by graupel throughout the anvil. For loCCN, the VMD of graupel at the top of the updraft region is almost 200 µm. In the anvil, the graupel grows to a VMD of up to 400–700 µm. For
15
REF, the VMD of the graupel at the top of the updraft region is about 150 µm (Fig.6a). Its growth is somewhat delayed further downwind compared to loCCN with VMD of about 300–500 µm in the lower part of the anvil, which is dominated by sedimenting graupel.
Our results show that there is no precipitation formation within the updraft region
20
in both the reference case and the case without “CCN-pollution”. At a mean vertical velocity of some 17 m s−1, air parcels are traveling from cloud base at 4000 m to the outflow level at 11 000 m in about 7 min, which is insufficient for the development of pre-cipitation even in clean conditions. Hydrometeors large enough to settle under gravity and precipitate are only developing outside the updraft, downwind of the fire and the
25
updraft. This is consistent with the finding that, even though the Chisholm pyroCb was very large and strong, almost no precipitation was recorded at the ground near the fire location (ASRD,2001). Also, in either case, all the cloud water reaches glaciation, hence the amount of latent heat of freezing released is equal for both simulations. For
ACPD
6, 6081–6124, 2006Modeling biomass smoke injection into
the LS (part II)
G. Luderer et al. Title Page Abstract Introduction Conclusions References Tables Figures J I J I Back Close
Full Screen / Esc
Printer-friendly Version Interactive Discussion
the small droplet sizes characteristic of polluted clouds, however, freezing is greatly delayed (Rosenfeld and Woodley,2000). Immersion freezing can be described by the stochastic hypothesis (Bigg,1953). According to this theory, which is implemented in ATHAM, the freezing probability is proportional to the droplet mass. Consequently, the glaciation level for the smaller droplets in REF is much higher than for the bigger ones
5
in loCCN. In fact, for REF most of the droplets do not freeze until they reach the level of homogeneous freezing of about −39◦C at approx. 9 km.
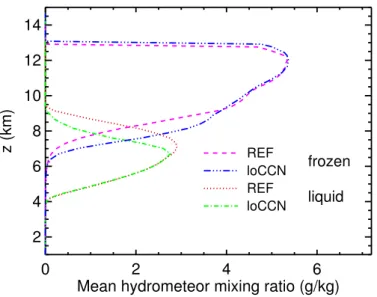
Figure 7 depicts the mean liquid and frozen hydrometeor contents for REF and loCCN, which were calculated according to Eq. (2), i.e., by using the upward aerosol flux as a weight function. It is found that freezing in REF is shifted by about 1 km to
10
higher altitudes compared to loCCN. The lower freezing level of loCCN explains its slightly stronger vertical development: The earlier release of the latent heat of freezing and consequent increase of buoyancy results in higher updraft velocities and stronger overshooting. This is clearly evident from the vertical profiles of the mean buoyancy (Fig.5a). The profiles for REF and loCCN are equal throughout almost the entire
tropo-15
sphere. Between 7 and 9 km, however, air parcels in REF are approximately neutrally buoyant, whereas those in loCCN remain significantly positively buoyant. This matches exactly the altitude range of the delayed glaciation.
4.5 Sensitivity to background meteorology
3-D visualizations of the aerosol plumes simulated for different meteorological
condi-20
tions after a simulation time of 30 min are shown in Fig.8. Because of stronger upper level winds of the ECMWF profiles, the plumes reached the boundaries of the model domain earlier than in the simulations with the radiosonde profiles. Therefore we had to limit the simulations to a 30 min integration time. The aerosol iso-surfaces for PRE, FRONT and POST, the three experiments with ECMWF background profiles, are
dis-25
tinctly different from each other, and also differ from the one obtained for the reference simulation, for which the meteorological profiles from radiosonde observations were used.
ACPD
6, 6081–6124, 2006Modeling biomass smoke injection into
the LS (part II)
G. Luderer et al. Title Page Abstract Introduction Conclusions References Tables Figures J I J I Back Close
Full Screen / Esc
Printer-friendly Version Interactive Discussion
EGU
For PRE, the experiment conducted with pre-frontal meteorological background con-ditions, the plume overshoots to levels close to the tropopause, however most of the aerosol remains in the mid-troposphere. The upper level winds are weaker than those in FRONT and POST, therefore the plume is more compact and less ambient air is en-trained into the pyroCb. As shown in Fig.9a and Table4, the maximum height of smoke
5
injection is at about 11 km, the vertical aerosol distribution for PRE has a maximum at 6.0 km altitude, where most of the outflow occurs.
This distribution can be understood in terms of the temperature and humidity profiles (Fig. 2a, Sect. 3.2). Due to the warm potential temperatures in the boundary layer, the air masses of the portion of the smoke plume situated below cloud base are highly
10
buoyant (Fig. 10a). Compared to the more moist conditions in FRONT and POST, however, the dry ambient air in PRE results in a higher cloud base and less latent heat released (Fig.10b). The total hydrometeor mass in the pyroCb simulated for PRE is 2.5×10⁹kg, compared to 6.2×10⁹kg for FRONT. Also, background mid and upper tropospheric temperatures are substantially warmer. Consequently, air parcels in the
15
pyroCb already become strongly negatively buoyant at about 6 km altitude. Air parcels overshooting this level therefore tend to sink back, giving rise to the observed peak in the aerosol distribution at this altitude. No aerosol is transported beyond potential temperatures of about 335 K, consequently the amount injected above the tropopause level is very small compared to that in FRONT (Fig.9b, Table4).
20
In the POST case, the aerosol plume only penetrates to zmax=9.7 km. Due to strong upper level winds, the plume is quickly advected to northwesterly directions and the maximum altitude is reached far downwind of the fire location. The air in the boundary layer is colder and more stably stratified than in PRE and FRONT (Fig.2), therefore the air masses in the plume are significantly less buoyant in the lowermost 4 km of
25
the troposphere. Above approx. 6 km, the air parcels in the smoke plume become negatively buoyant, resulting in an outflow level at zout=6.6 km altitude. Due to the high humidity in the boundary layer (about 9 g kg−1) and the colder temperatures (15◦C at ground level), the pyroCb’s cloud base is at 3.5 km, lower than for PRE and FRONT.
ACPD
6, 6081–6124, 2006Modeling biomass smoke injection into
the LS (part II)
G. Luderer et al. Title Page Abstract Introduction Conclusions References Tables Figures J I J I Back Close
Full Screen / Esc
Printer-friendly Version Interactive Discussion
The latent heat release results in a temperature lapse rate within the plume that is only slightly larger than the ambient lapse rate. Consequently, the plume air parcels are almost neutrally buoyant between 5 km and 9 km (Fig.10a). Along with the strong wind shear, this explains that the aerosol mass is almost evenly distributed in this altitude range (Fig.9a). There is no significant amount of aerosol above 330 K (Fig.9b). The
5
aerosol mass injected into the stratosphere is therefore very small (Table4).
Due to the warm and moist air masses in the boundary layer (Fig. 2b), the profile used in FRONT is strongly convectively unstable. The air parcels in the updraft re-gion of the pyroCb therefore remain positively buoyant up to a level of about 10 km (Fig.10a). Between approximately 7 and 8 km the buoyancy is reduced to almost zero,
10
due to the delayed glaciation induced by the aerosol effect on microphysics described in Sect. 4.4. The pyroCb significantly overshoots into the tropopause inversion and reaches a maximum penetration height of zmax=11.8 km. The aerosol distribution as a function of potential temperature features a maximum at 330 K. 3.5×10⁵kg of aerosol mass is injected above the 332 K tropopause, slightly more than in REF.
15
Even though FRONT and REF are similar in terms of vertical aerosol distribution, the total masses of condensed hydrometeors and stratospheric aerosol injection, as well as the 3-D shape of the plumes are significantly different (Figs. 8). In REF the anvil spreads into a round, umbrella-like shape, while the anvil obtained for FRONT is advected much faster into the downwind direction because of a much more pronounced
20
jet in the UT/LS region in this simulation. The cloud top structure obtained for REF more closely resembles observations from RADAR and satellite borne radiometers and should therefore be considered the best approximation of the real world situation.
The integrated buoyancy IB is rather large for all background profiles used. It is largely dominated by the contribution from the fire heating at low levels, where the
25
smoky air parcels are least diluted. The difference in IB between the various numer-ical experiments correlates well with the mean vertnumer-ical velocities. For FRONT, IB is highest at 2290 J kg−1, and w=17.2 m s−1. For PRE and POST, IB is somewhat lower with 1970 J kg−1 and 1860 J kg−1, respectively, and w is reduced to 16.8 m s−1 and
ACPD
6, 6081–6124, 2006Modeling biomass smoke injection into
the LS (part II)
G. Luderer et al. Title Page Abstract Introduction Conclusions References Tables Figures J I J I Back Close
Full Screen / Esc
Printer-friendly Version Interactive Discussion
EGU
15.3 m s−1, respectively (Table4).
5 Summary and conclusions
We have presented numerical experiments studying the sensitivity of deep-convective transport of smoke from the Chisholm wildfire into the UT/LS to fire emissions and background meteorology. From our results we conclude that the evolution of the pyroCb
5
convection and the transport to the UT/LS is dominated by the heat release from the fire and the background meteorology. The release of water vapor and aerosol particles were found to be of much lower significance.
The finding that sensible heat release is the most important parameter influencing the Chisholm pyroCb convection is consistent with other studies (Penner et al.,1986;
10
Lavou ´e et al.,2000), and should apply similarly to other cases of pyro-convection. Air parcels receiving greater input of heat from the fire ascend to higher altitudes, thereby condensing and freezing more of the available water and releasing additional latent heat, thus giving rise to a positive feedback. The strength of this feedback strongly depends on the meteorological conditions, such as the background temperature and
15
moisture profiles.
As discussed in Trentmann et al. (2006), there is significant uncertainty about the partitioning of the combustion energy between sensible heat available for convection and energy that is lost radiatively. According to our simulations, the structure, altitude and penetration height observed during the peak activity of the Chisholm pyroCb can
20
only be reproduced if the radiative loss is assumed to be small compared to the heat available for convection. Consequently, the radiative loss is likely to be smaller than the values of 30–60% obtained from laboratory and field studies of small fires (McCarter
and Broido,1965;Packham,1969). Possibly, a major portion of the radiation becomes intercepted by the pyroCb itself, which is rather intransparent in the thermal IR. It is
25
also conceivable that there is a scale effect involved: the larger the fire, the larger the volume of air-mass getting entrained into the convection and the higher the ratio of
ACPD
6, 6081–6124, 2006Modeling biomass smoke injection into
the LS (part II)
G. Luderer et al. Title Page Abstract Introduction Conclusions References Tables Figures J I J I Back Close
Full Screen / Esc
Printer-friendly Version Interactive Discussion
fire radiation absorbed within that region. Radiative energy absorbed on small spatial scales results in sensible heating, consequently reducing the radiative loss.
The low sensitivity of the pyro-convection dynamics to the release of fire moisture is in contrast with the results ofPotter (2005), who postulated, based on theoretical considerations and observations, that the fire moisture could account for a large portion
5
of the liquid water content and strongly contribute to the updraft dynamics for many pyro-clouds. Certainly, the relative contribution of the fire moisture to the cloud liquid water depends strongly on the environmental humidity, entrainment and fuel moisture. Its impact on convection dynamics is determined by the ratio of latent to sensible heat released by the fire. This ratio is constrained by reasonable ranges of fuel moisture and
10
radiative losses. In a comment toPotter(2005), Luderer et al. (2006)2show based on the combustion equation that the assumptions used inPotter (2005) are inconsistent with the relative amounts of combustion heat and released moisture. Hence, for pyro-convection the role of fuel moisture is generally less important than that of sensible heat.
15
According to our model experiments, the updraft dynamics of the Chisholm pyroCb is only weakly affected by CCN effects on microphysics. While previous studies reported stronger convection with increasing CCN pollution (Andreae et al.,2004;Koren et al.,
2005;Wang,2005), our findings are opposite: The updraft dynamics in the reference experiment is slightly weaker than without CCN inputs from the fire. InAndreae et al.
20
(2004) and Koren et al. (2005), the invigoration of deep convection with increasing aerosol abundance is explained by a delay in precipitation formation and consequent suppression of downdrafts and warm rain. In this scenario, convection reaches higher and is more likely to reach the freezing level, thereby releasing additional latent heat. Because of the lack of precipitation formation within the updraft region for both the
25
reference and the loCCN simulations, there are no invigorating effects of CCN on
dy-2
Luderer, G., Trentmann, J., and Andreae, M. O.: Comment on “A new look on the role of released moisture on the dynamics of pyro-convection”, Int. J. Wildland Fire, in preparation, 2006.
ACPD
6, 6081–6124, 2006Modeling biomass smoke injection into
the LS (part II)
G. Luderer et al. Title Page Abstract Introduction Conclusions References Tables Figures J I J I Back Close
Full Screen / Esc
Printer-friendly Version Interactive Discussion
EGU
namics for the special case of mid-latitude pyro-convection studied here. The weak negative feedback can be explained by the delay in the freezing of the small cloud droplets in the polluted case, resulting in later release of the latent heat of freezing and decreased buoyancy.
Two-moment microphysics schemes such as the one used in this study are limited
5
in their ability to simulate the development of precipitation-sized hydrometeors. The width of the hydrometeor size distribution is prescribed, therefore the broadening of the droplet spectrum through collision and coalescence is not reproduced. As a con-sequence, the simulated precipitation formation might be underestimated. We had to limit ourselves to this approach due to computational constraints. Efforts to implement
10
a more complex spectral hydrometeor scheme (Khain et al.,2000) for further investi-gations are under way.
From sensitivity experiments with different background profiles we inferred that me-teorological effects are of major importance for the convection dynamics. Due to the large contribution of latent heat release from entrained moisture to the total convection
15
energy and the significant entrainment at intermediate levels (Trentmann et al.,2006), the convection is strongly influenced by the humidity in the low and mid-troposphere. Whereas initialization with a frontal profile resulted in substantial stratospheric smoke injection, the vertical development was much weaker for the pre-frontal and post-frontal profiles. This finding is in good agreement with the severe intensification of the
pyro-20
convection upon the passage of a cold front that was observed for the Chisholm py-roCb (Fromm and Servranckx,2003; Rosenfeld et al., 20061) as well as other pyroCbs (Fromm et al.,2005).
The recently discovered phenomenon of biomass smoke injection into the lower stratosphere by severe pyro-convection might have substantial impact on atmospheric
25
chemistry and climate. For the case of the Chisholm pyroCb, we were able to re-produce the stratospheric smoke injection. We identified fire heating and background meteorology as the most important contributing factors. Assessing the effects of pyro-convection on a global scale is challenging. It requires not only accurate knowledge
ACPD
6, 6081–6124, 2006Modeling biomass smoke injection into
the LS (part II)
G. Luderer et al. Title Page Abstract Introduction Conclusions References Tables Figures J I J I Back Close
Full Screen / Esc
Printer-friendly Version Interactive Discussion
about the frequency of pyroCB events but also about the altitude and potential temper-ature level to which biomass smoke is transported. For this purpose, and the develop-ment of parameterizations, additional studies of other pyroCb events with a variety of atmospheric conditions and fire activities are required.
Acknowledgements. We would like to thank M. Fromm, A. Khain, B. Potter, D. Rosenfeld, R.
5
Servranckx and H. Wernli for stimulating discussions. G. Luderer was supported by an Interna-tional Max Planck Research School fellowship. J. Trentmann would like to thank the Alexander von Humboldt foundation for support through a Feodor-Lynen fellowship. Part of this work was funded by the German Ministry for Education and Research (BMBF) under grant 07 ATF 46 (EFEU) and by the Max Planck Society.
10
References
Andreae, M. O. and Merlet, P.: Emission of trace gases and aerosols from biomass burning, Global Biogeochem. Cycles, 15, 955–966, 2001. 6088
Andreae, M. O., Rosenfeld, D., Artaxo, P., Costa, A. A., Frank, G. P., Longo, K. M., and Silva-Dias, M. A. F.: Smoking rain clouds over the Amazon, Science, 303, 1337–1342, 2004. 15
6085,6089,6090,6099,6105
ASRD: Final Documentation Report – Chisholm Fire (LWF-063), Forest Protection Division, ISBN 0-7785-1841-8, Tech. rep., Alberta Sustainable Resource Development, 2001. 6088,
6091,6092,6100
Bigg, E. K.: The formation of atmospheric ice crystals by the freezing of droplets, Q. J. R. 20
Meteorol. Soc., 79, 510–519, 1953. 6101
Byram, G. M.: Combustion of forest fuels, in: Forest Fire Control and Use, edited by: Davis, K. P., McGraw-Hill, New York, 90–123, 1959. 6088,6089
Cook, J. and Highwood, E.: Climate response to tropospheric absorbing aerosol in an interme-diate general-circulation model, Q. J. R. Meteorol. Soc., 130, 175–191, 2004. 6083
25
Damoah, R., Spichtinger, N., Servranckx, R., Fromm, M., Eloranta, E. W., Razenkov, I. A., James, P., Shulski, M., Forster, C., and Stohl, A.: A case study of pyro-convection using transport model and remote sensing data, Atmos. Chem. Phys., 6, 173–185, 2006. 6083,
ACPD
6, 6081–6124, 2006Modeling biomass smoke injection into
the LS (part II)
G. Luderer et al. Title Page Abstract Introduction Conclusions References Tables Figures J I J I Back Close
Full Screen / Esc
Printer-friendly Version Interactive Discussion
EGU
Emanuel, K. A.: Atmospheric Convection, Oxford Univesity Press, New York, 1994. 6084,
6093
Fromm, M., Alfred, J., Hoppel, K., Hornstein, J., Bevilacqua, R., Shettle, E., Servranckx, R., Li, Z., and Stocks, B.: Observations of boreal forest fire smoke in the stratosphere by POAM III, SAGE II, and lidar in 1998, Geophys. Res. Lett., 27, 1407–1410, 2000. 6083,6090
5
Fromm, M., Bevilacqua, R., Stocks, B., and Servranckx, R.: New directions: Eruptive transport to the stratosphere: Add fire-convection to volcanoes, Atmos. Environ., 38, 163–165, 2004.
6083,6084
Fromm, M., Bevilacqua, R., Servranckx, R., Rosen, J., Thayler, J., Herman, J., and Larko, D.: Pyro-cumulonimbus injection of smoke into the stratosphere: Observerations and impact of a 10
super blowup in northwestern Canada on 3–4 August 1998, J. Geophys. Res., 110, D08205, doi:10.1029/2004JD005350, 2005. 6083,6084,6085,6090,6106
Fromm, M. D. and Servranckx, R.: Transport of forest fire smoke above the tropopause by su-percell convection, Geophys. Res. Lett., 30, 1542, doi:10.1029/2002GL016820, 2003. 6083,
6085,6086,6090,6097,6106
15
Graf, H.-F.: The Complex Interactions of Aerosols and Clouds, Science, 303, 1309–1311, 2004.
6086
Graf, H.-F., Herzog, M., Oberhuber, J. M., and Textor, C.: The effect of environmental conditions on volcanic plume rise, J. Geophys. Res., 104, 24 309–24 320, 1999. 6087
Herzog, M., Graf, H.-F., Textor, C., and Oberhuber, J. M.: The effect of phase changes of water 20
on the development of volcanic plumes, J. Volcanol. Geotherm. Res, 87, 55–74, 1998. 6087
Herzog, M., Oberhuber, J. M., and Graf, H.-F.: A prognostic turbulence scheme for the nonhy-drostatic plume model ATHAM, J. Atmos. Sci., 60, 2783–2796, 2003. 6087
Houze, R. A.: Cloud Dynamics, Academic Press, San Diego, 1993. 6084
Jost, H.-J., Drdla, K., Stohl, A., Pfister, L., Loewenstein, M., Lopez, J. P., Hudson, P. K., Murphy, 25
D. M., Mahoney, D. J., Cziczo, D. J., Fromm, M., Bui, T. P., Dean-Day, J., Gerbig, C., Mahoney, M. J., erik C. Richard, Spichtinger, N., Pittman, J. V., Weinstock, E. M., Wilson, J. C., and Xueref, I.: In-situ observation of mid-latitude forest fire plumes deep in the stratosphere, Geophys. Res. Lett., 31, L11101, doi:10.1029/2003GL019253, 2004. 6083,6084
Khain, A., Ovtchinnikov, M., Pinsky, M., Pokrovsky, A., and Krugliak, H.: Notes on the state-of-30
the-art numerical modeling of cloud microphysics, Atmos. Res., 55, 159–224, 2000. 6106
Koren, I., Kaufman, Y. J., Rosenfeld, D., Remer, L. A., and Rudich, Y.: Aerosol invigo-ration and restructuring of Atlantic convective clouds, Geophys. Res. Lett., 32, L14828,