DNA Methylation Heterogeneity
Patterns in Breast Cancer Cell Lines
The MIT Faculty has made this article openly available.
Please share
how this access benefits you. Your story matters.
Citation
Sun, Shuying, Sunny Tian, Karina Bertelsmann, Linda Yu, and
Shuying Sun. “DNA Methylation Heterogeneity Patterns in Breast
Cancer Cell Lines.” Cancer Informatics (September 2016): 1. © 2016
the authors, publisher and licensee Libertas Academica Limited
As Published
http://dx.doi.org/10.4137/cin.s40300
Publisher
Libertas Academica, Ltd.
Version
Final published version
Citable link
http://hdl.handle.net/1721.1/108129
Terms of Use
Creative Commons Attribution-NonCommercial 3.0 Unported
Introduction
Cancer is one of the leading causes of death worldwide. There were approximately 1.7 million new cases of cancer and over 585,000 cancer-related deaths in the U.S. alone in 2014.1
Around one in eight women will be diagnosed with breast cancer in their lifetime, and hundreds of thousands of people in the U.S. are diagnosed with this disease each year.2 Because
cancer springs from the rapid growth of abnormal cells, effec-tive early detection and screening are principal to overcoming this disease. Therefore, medical researchers have been con-ducting genetic and epigenetic research to find potential bio-markers for early detection, screening, and treatment.3–5
Traditional pathological examination of tumors tends to rely on needle biopsy, a procedure that analyzes tiny frac-tions of cells that may not sufficiently represent the tumor mass in heterogeneous cells. This means that important dis-ease details and features may be overlooked. Furthermore, increasing evidence indicates greater heterogeneity of cancer cells when compared to normal cells. Although some research has been done on cancer heterogeneity patterns using DNA sequencing data,6 this topic is relatively new and challenging
because genome-wide DNA sequencing datasets are as large
as hundreds of gigabytes or even terabytes and have complex biological and technical structures.7 In this paper, we focus
on studying cancer methylation heterogeneity patterns for breast cancer cell lines. Detailed information about DNA methylation is illustrated below.
DNA methylation occurs when a methyl group (-CH3) covalently bonds to a cytosine in the dinucleotide 5′-CpG-3′ (or the fifth nucleotide).8 When a cytosine is linked to a
gua-nine by a phosphodiester bond, a CG or CpG site is formed. CpG islands are genomic regions that are rich in CpG sites. These islands often overlap with transcription start sites of genes, as well as intergenic regions and gene bodies.9 DNA
methylation plays an important role in regulating gene expres-sion by directly preventing transcription factor binding.9 DNA
methylation near transcription starting sites may block initia-tion and methylainitia-tion in centromeres and other repeat regions. DNA methylation is also likely to have a role in both chromo-somal and genome stability through suppressing expression of transposable elements.10
Heterogeneous or differential methylation means that there is a large amount of methylation variation or difference among different samples of one group (eg, cancer patients)
Cancer Cell Lines
sunny tian
1, Karina Bertelsmann
2, Linda Yu
3and shuying sun
41Massachusetts Institute of Technology, Cambridge, MA, USA. 2Clear Creek High School, League City, TX, USA. 3St. John’s School, Houston,
TX, USA. 4Department of Mathematics, Texas State University, San Marcos, TX, USA.
Supplementary Issue: Computer Simulation, Bioinformatics, and Statistical Analysis of Cancer Data and Processes (A)
AbstrAct: Heterogeneous DNA methylation patterns are linked to tumor growth. In order to study DNA methylation heterogeneity patterns for breast cancer cell lines, we comparatively study four metrics: variance, I2 statistic, entropy, and methylation state. Using the categorical metric methylation
state, we select the two most heterogeneous states to identify genes that directly affect tumor suppressor genes and high- or moderate-risk breast cancer genes. Utilizing the Gene Set Enrichment Analysis software and the ConsensusPath Database visualization tool, we generate integrated gene networks to study biological relations of heterogeneous genes. This analysis has allowed us to contribute 19 potential breast cancer biomarker genes to cancer databases by locating “hub genes” – heterogeneous genes of significant biological interactions, selected from numerous cancer modules. We have discovered a con-siderable relationship between these hub genes and heterogeneously methylated oncogenes. Our results have many implications for further heterogeneity analyses of methylation patterns and early detection of breast cancer susceptibility.
Keywords: DNA methylation, heterogeneity, and hub genes SuPPLeMeNt: Computer simulation, Bioinformatics, and statistical analysis of Cancer Data and Processes (a)
CItAtIoN: tian et al. Dna methylation Heterogeneity Patterns in Breast Cancer Cell Lines. Cancer Informatics 2016:15(s4) 1–9 doi: 10.4137/CIn.s40300.
tYPe: original research
ReCeIveD: June 15, 2016. ReSuBMItteD: august 07, 2016. ACCePteD foR PuBLICAtIoN: august 13, 2016.
ACADeMIC eDItoR: J. T. Efird, Editor in Chief
PeeR RevIew: two peer reviewers contributed to the peer review report. reviewers’ reports totaled 860 words, excluding any confidential comments to the academic editor. fuNDINg: this work was supported by Dr. shuying sun’s start-up funds and the research enhancement Program provided by texas state University. the authors confirm that the funder had no influence over the study design, content of the article, or selection of this journal.
CoMPetINg INteReStS: Authors disclose no potential conflicts of interest. CoRReSPoNDeNCe: [email protected]
CoPYRIgHt: © the authors, publisher and licensee Libertas academica Limited. this is an open-access article distributed under the terms of the Creative Commons CC-BY-nC 3.0 License.
Paper subject to independent expert blind peer review. all editorial decisions made by independent academic editor. Upon submission manuscript was subject to anti-plagiarism scanning. Prior to publication all authors have given signed confirmation of agreement to article publication and compliance with all applicable ethical and legal requirements, including the accuracy of author and contributor information, disclosure of competing interests and funding sources, compliance with ethical requirements relating to human and animal study participants, and compliance with any copyright requirements of third parties. this journal is a member of the Committee on Publication ethics (CoPe). Published by Libertas academica. Learn more about this journal.
Tian et al
or between two groups (eg, cancer patients and normal individuals).11–14 For instance, comparing methylation ratios
at each cytosine base (mC-ratio) in different cancer patients reveals heterogeneous methylation patterns. It is important to identify the genes or regions that have heterogeneous methy-lation patterns across different samples or patients. Generally speaking, researchers are aware of the existence of methyla-tion heterogeneity, but it is unknown what the exact heteroge-neity patterns are. It is also unclear how many genes have such hetero geneous patterns and what the impact these heteroge-neous genes may have, especially in relation to cancer genes. In order to address the above questions, we conduct a bioin-formatics analysis. More detailed explanations of all steps and results are introduced in the following sections.
Methods
Four metrics for methylation heterogeneity analysis.
In some genomic regions, DNA methylation levels are hetero-geneous across different cancer patients or samples. The het-erogeneity pattern may be due to different methylation events within cancer cells. In order to gain some intuitive under-standing of the methylation heterogeneity or variation pat-terns, we first calculate the mean and standard deviation at selected CpG sites across all cell lines. Our exploratory analy-sis of mean and standard deviation of the methylation levels at each CpG site reveals that most CpG sites are either fully methylated or not at all. Moreover, there is clear evidence that the methylation levels at some CpG sites are much more het-erogeneous. We also find that greater variation or heterogene-ity is often observed in partially methylated sites. Based on this understanding, we choose to analyze DNA methylation heterogeneity patterns using four statistical metrics: variance, I 2 statistic, entropy score, and methylation state.
Variance. We calculate the sample variance of methylation levels of all samples at a CpG site and use the standard devia-tion to measure the variadevia-tion or spread of DNA methyladevia-tion levels. Large variation indicates that the methylation levels of different samples are very heterogeneous. We compare the other two quantitative metrics (see below) with standard devi-ation because this metric is a direct measure of varidevi-ation.
I2 statistic. The I 2 statistic was originally introduced by
Higgins et al.15,16 to measure the impact of heterogeneity on
meta-analysis. This statistic is defined based on the Cochran’s heterogeneity statistic Q, that is, I Q df
Q
2= − 100
× %, where Q is the chi-square statistic and df is the degree of freedom. In this article, we borrow the idea of the I 2 statistic and use a
slightly modified version of this statistic. Specifically, we use the chi-square statistic Q n=
(
−12)
s2σ , where n is the number of samples at each CpG site, s2 is the sample variance, and σ 2 is a
predetermined value with the default value of σ 2 = 0.0225 in
our analysis. Note that we choose this σ 2 default value based
on our previous exploratory analysis and a recent publication
on differential methylation identification.11 In the context of
testing if a population variance is equal to a specific value, H0: σ2 σ02 σ
2 0
2 21
1
= ,Q=
(
n−)
s ∼χ . This I n− 2 statistic takes the Qvalue and looks at it relative to its degree of freedom, thereby accounting for the sample size.
Entropy score. Entropy may be used to measure the randomness and heterogeneity level among different samples and determine if methylation levels vary from person to per-son among cancer patients. We will calculate an entropy score for each CpG site as defined by the method named Quantita-tive Differentially Methylated Regions (QDMR) below.14 Let
mi = (mi,1, mi,2, …, mi,s, …, mi,N) be the methylation levels at CpG site i and across N samples, where mi,s represents the methylation level in sample s. The sum of methylation levels of CpG site i in N samples is s N i s m =
∑
1 ,, and the ratio of methylation level of CpG site i in samples relative to the total value is defined as the relative methylation probability pi s mi s m
s N i s , = , / , =
∑
1 . Let Mi be the median for methylation levels in N samples at CpG site i and Si be the absolute distance |mi,s – Mi|. Thus, for each sample s, a uniform measure of distance from the cen-ter is defined as ui s mcSi s Mii
, = ,
−
+ ε , where ε = 0.0001 is used to prevent a zero denominator and c = 5 (default value) is a tun-ing constant. A piecewise weight is then calculated as follows:
w u u u u i s i s i s i s , , , , , ,
( )
=(
−)
≤ > 1 1 0 1 2 2 . A one-step Tukey’s biweight (Ti,b) is then introduced to transform methylation data, where
T w u m w u i b s N i s i s s N i s , , , , =
( )
× ( )
= =∑
∑
1 1is a weighted mean. A processed methylation level m′i,s for sample s is then calculated as m′i,s = |mi,s – Ti,b|. Using the transformed methylation levels, QDMR first defines an entropy score as: HP p
s N i s = − =
∑
1 ′, log2(p′i,s), where pi s mi s m s N i s ′, = , / ′, =∑
1. To account for the range of varia-tion, QDMR introduces a methylation weight to modify the above HP. In particular, let max(m′i,s) and min(m′i,s) be the maximum and minimum methylation levels, respectively, of region i. Let “MAX” and “MIN” be the highest and lowest methylation levels, respectively. With the methylation weight, wi = |log2 max min
MAX MIN m′i s, m′i s,
( )
−( )
− + ε |, where ε = 0.0001 is used to offset the logarithmic argument, the final entropy score is defined as HQ = HP × wi. Note that because the above entropy score was introduced by QDMR, we usenotations that are very similar to the ones used in the QDMR paper.
Methylation state. For methylation states, we categorize CpG sites into the several categories: L (Low), H (High), M (Median), and O (Other). A low methylation state (L) means that all methylation levels at a CpG site are below 0.2, and a high methylation state (H) means that all methy-lation levels at a CpG site are above 0.8. A median methyla-tion state (M) means that all methylamethyla-tion levels at a CpG site are between 0.2 and 0.8. The CpG sites with methyla-tion levels that do not fall in any of these three categories are defined as an O (Other) state. CpG sites of the O state are then further categorized into Bimodal, High-Medium (HM) methylation, Low-Medium (LM) methylation, and then Rest (R). A Bimodal methylation state means that over 40% of the samples at a CpG site have methylation levels below 0.2, and over 40% of the samples have levels above 0.8. A High-Median (HM) methylation state occurs when all methylation levels at a CpG site are above 0.4. A Low-Median (LM) methylation state occurs when all methylation levels at a CpG site are below 0.6. The remaining CpG sites are categorized as the Rest (R) methylation state. All meth-ylation states are shown using example data in Figure 1. By categorizing the data with these classifications as shown in Figure 1, we can analyze the methylation heterogeneity patterns in more detail. Among all the above methylation states, we are most interested in the Bimodal and the Rest methylation states because they are the most heterogeneous, or least consistent, and therefore most likely to affect tumor suppressor genes and oncogenes.
data and r functions. The dataset used in this project
contains the methylation level for each CpG site of seven breast cancer cell lines, namely, BT20, BT474, MCF7, MDAMB231, MDAMB468, T47D, and ZR751. The DNA methylation sequencing data of these seven samples are publicly available (GSE27003).17 The data preprocessing step is done
using the methylation sequencing alignment tool BRAT-bw.18
From our preliminary study, we know that cancer methylation
levels are more heterogeneous than normal data.12 Abnormal
heterogeneous methylation patterns may cause the silencing of tumor suppressor genes and the overexpression of oncogenes. Before any statistical analysis, we process our data by extract-ing the CpG sites with methylation levels for more than 70% of the samples for better accuracy.
Genome datasets are enormous, and it takes time to process them. In order to analyze and interpret DNA meth-ylation sequencing data, we have used the statistical com-puter language R to analyze heterogeneity patterns for DNA methylation sequencing data. To speed up the analysis, we have used a high-performing super computer with multiple nodes for parallel processing. With the obtained output files, we then run other programs to process further information, such as obtain-ing a list of genes that cover selected heterogeneous CpG sites.
results
Performance of four metrics. In the last section, we
illustrated the performance of the four metrics that we use to study methylation heterogeneity or variation levels. Among these four metrics, methylation state is the most intuitive one. Based on the definition of the different methylation states, CpG sites with High (H) and Low (L) methylation states have low variation, whereas Median (M) and Other (O) methylation states show more variation, which is expected. The methyla-tion state of one chromosome (chr1) is summarized in Table 1. From Table 1, we can see that the High (H) and Low (L) states together contribute about 55% (16.33% + 38.13%) of the CpG sites. The High-Median (HM) and Low-Median (LM) states together contribute to about 17% (11.83% + 5.22%) of the CpG sites. The Median (M) state has the least number of CpG sites (only 0.19%). About 2% of CpG sites have the Bimodal pattern. The Rest state has about 26.32% of the total sites. CpG sites with the Rest state are heterogeneous but lack patterns, making it difficult to categorize them specifically. Among the seven methylation states, Bimodal and Rest have most heterogeneous patterns.
1.0 Bimodal H HM L LM M Rest 0.8 0.6 0.4 0.2 Methylation level 0.0 1 2 3 4 5 6 7
figure 1. Dot plot of methylation states.
table 1. number and percentage of CpG sites belonging to each methylation state. MetHYLAtIoN StAte NuMBeR of Cpg SIteS PeRCeNtAge of totAL Cpg SIteS Bimodal 2106 1.98% High 17362 16.33% High-Median 12575 11.83% Low 40541 38.13% Low-Median 5548 5.22% Median 205 0.19% Rest 27980 26.32% total 106317 100.00%
Notes: the summary is done for chromosome 1, but the percentages
are representative of the entire genome. methylation states are shown in alphabetical order.
Tian et al
Because the qualitative metric (methylation state) is the most intuitive and biologically meaningful metric, we plot the three quantitative metrics: standard deviation, I 2
statis-tic, and entropy score against each methylation state using boxplots (Fig. 2). These plots will help us analyze how well each quantitative metric measures heterogeneity level. The two metrics standard deviation and I 2 statistic produce very
similar representations of heterogeneity. However, it is evi-dent that entropy does not produce an analogous result. We then compare the entropy score with standard deviation using a plot with different methylation states highlighted with dif-ferent colors (Fig. 3). Figure 3 shows that the entropy score nearly reverses the relative variation pattern for some CpG
sites: High (H) and Low (L) methylation states show greater heterogeneity, while Median (M) and other methylation states show lower heterogeneity. That is, Figure 2 shows a different pattern when comparing entropy with standard deviation, and this pattern is counterintuitive.
When the I 2 statistic versus the standard deviation is
graphed, there is a clear positive correlation between the two metrics (Fig. 4). The CpG sites categorized as High (H) or Low (L) have very low I 2 values, which are expected because
the methylation levels in these categories have a very narrow range for the values to fall into. Furthermore, the Bimodal and Rest states have high I 2 statistic values. CpG sites that have a
methylation state considered to be Bimodal or Rest are actually far more heterogeneous. As Table 1 shows, Bimodal and Rest states together hold a significant percentage (about 28.3% of the data) of CpG sites in each chromosome.
As shown above, the entropy score gives a different and counterintuitive result. However, variance (or standard devia-tion), I 2 statistic, and methylation state all give relatively
intu-itive and similar measures of heterogeneity or variation. These
BiModal H HM L LM M Rest 0.5 0.3 0.4 0.4 0.6 0.8 0.2 0.2 0.1 Standard deviation I-square Entropy Methylation state BiModal H HM L LM M Rest Methylation state BiModal H HM L LM M Rest Methylation state
Standard deviation vs. methylation states
I-square vs. methylation states
Entropy vs. methylation states
0.0 0.0 0 5 10 15 20
figure 2. Boxplots of quantitative metrics vs. methylation states.
20 15 10 5 0 0.0 0.1 BiModal H HM L LM M Rest 0.2 0.3 0.4 0.5 Standard deviation Entropy vs. standard deviation
Entropy score
figure 3. a scatterplot of entropy against standard deviation.
0.8 HHM Bimodal LM M Rest L 0.6 0.4 0.2 0.0 0.0 0.1 0.2 0.3 0.4
Standard deviation of CpG sites
I2 statistic vs. standard deviation
I
2 statistic pf CpG sites
0.5
three metrics could be considered for measures of variability or heterogeneity across samples. For the rest of the section, we use the intuitive metric (methylation state) to consider the biological implication that heterogeneous genes may have on breast cancer.
biological implications based on genetics and pathway analysis. Genetic analysis. Because we are specifically interested
in the genes with highly heterogeneous methylation patterns, we select the CpG sites that are categorized as Bimodal and Rest methylation states. We utilize an R function written by Dr. Sun’s laboratory to annotate our processed breast cancer data, generating two lists of genes with CpG sites in the body or in the promoter region. These lists are combined and repeats are omitted. We then obtain a variable that is the number of heterogeneous CpG sites associated with each gene. When checking the distribution of this variable, we find that this list of numbers ranges from 1 to 112 and that 75% of these num-bers are not larger than 3. In order to ensure that the selected genes are of greater importance in relation to breast cancer, we have specified parameters in our code to select only the genes with over 25 heterogeneous CpG sites. With this selection, we further analyze the top 13.5% of heterogeneous genes. Using this particular list of genes, we utilize the ConsensusPath Database (ConsensusPathDB)19–21 to integrate interaction
networks among genes, creating genetic maps for visualiza-tion of our heterogeneous gene lists. In the entire genome of breast cancer data from the 7 cell lines, there are 2618 dis-tinct genes with at least 25 heterogeneous CpG sites that are categorized as the most heterogeneous methylation states, Bimodal and Rest. A total of 710 of these genes are related to cancer modules22 (ie, cancer-related gene sets). We then use
these genes in our further analyses. These cancer modules are identified by mining a large compendium of cancer-related microarray data.22 To determine the link between our
signifi-cant genes and their biological importance, we compare them to lists of breast cancer methylated genes, tumor suppressor genes, oncogenes, and transcription factors. This comparison indicates that of our specified gene list, 43 are known breast cancer methylated genes, 5 are tumor suppressor genes, 81 are oncogenes, and a significant 376 are transcription factors. Moreover, 44 of these transcription factors are also identified as oncogenes; therefore, if expressed, they may have a high impact on tumor growth.
We further analyze our 2618 genes with heterogeneous CpG sites and their biological significance by utilizing the gene set enrichment analysis (GSEA) that was created by the Broad Institute of MIT and Harvard.23 This GSEA software
package uses a hypergeometric distribution to compare our list of heterogeneous genes with gene lists found in Molecu-lar Signatures Database, a collection of annotated gene sets. To ensure statistical significance, we use the GSEA default FDR (False Discovery Rate) q-values ,0.05. Using “can-cer modules” as “gene sets”, our GSEA analysis shows that with q-values less than 0.05, at least 173 genes are overlapped
or significantly represented in the top 10 cancer modules. Examination of gene sets and their overlap can highlight common biological processes. Among 173 hetero geneous genes, 15 significantly represent in the top 10 cancer mod-ules (Table 2). Detailed descriptions of these 15 genes can be found online in GeneCards (www.genecards.org). The num-bers of the top cancer modules are listed in Table 2. These modules are gene sets that are significantly changed in various cancer conditions.22 More detailed description of these cancer
modules can be found online.24 In addition, instead of using
cancer modules as “gene sets”, we may use the KEGG path-ways as “gene sets” for the GSEA. Using the KEGG pathway for GSEA, important KEGG cancer pathways and signaling pathways (eg, MAPK signaling pathway and calcium signal-ing pathway) are significantly represented.
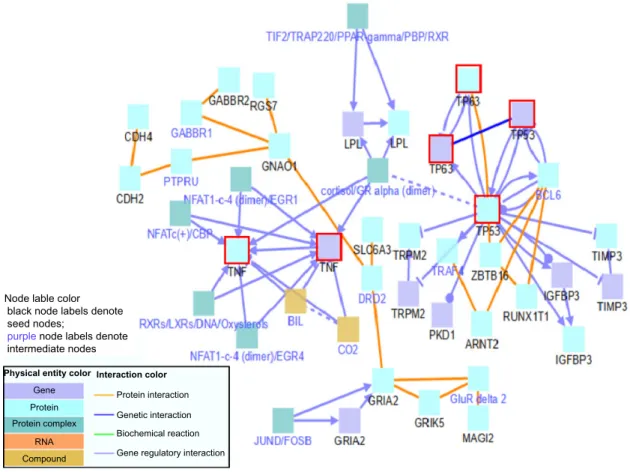
Tumor suppressor and breast cancer-related genetic pathways. Using the carefully chosen list of heterogeneous genes, we select 173 genes that are significantly represented in numer-ous important cancer modules to determine potential links between certain genes in our list and the genes related to breast cancer. Utilizing the genetic software, ConsensusPathDB, we have created an induced network module as shown in Figure 5, considering only high-confidence binary protein and gene regulatory interactions to ensure the importance of the genes’ roles in relation to breast cancer. In addition to the selected heterogeneous genes of high-confidence relation, we have also included genes that regulate the cell cycle, tumor suppression, transcription factors, and cell reception, which are frequently linked with breast cancer. Abnormal methylation of these genes may lead to tumorigenesis. In order to include these genes, we first take a list of genes that are typically linked with
table 2. fifteen heterogeneous sample genes represented in top 10 significant cancer modules.
geNe SYMBoL CANCeR MoDuLe ID 100 66 137 11 220 47 12 41 88 55 PDGfra X X X – X – X X X X DPYsL3 X X X X X X X – – – sPoCK1 X X X X X X – – – – tfaP2B X X X X X – X X X X PaX6 X X X X X – X X X X soX9 X X X X X – X – X X feZ1 X X X X X – X – – – ntrK2 X X X X X – X – – – CrmP1 X X X X X – X – – – KaL1 X X X X X – X – – – neUrL X X X X X – – X X X nrG2 X X X X X – – X X X DPYsL4 X X X X X – – X X X tBr1 X X X X X – – X X X CBLn1 X X X X X – – X – –
Tian et al
breast cancer and then add them to the list of heterogeneous genes before running the ConsensusPathDB. By including genes that have known links to breast cancer in the network, the ability to identify a novel gene from the list of heteroge-neous genes that is linked to breast cancer may increase. That is, genes that are more connected to or share pathways with a large number of genes such as oncogenes and tumor sup-pressor genes are also more likely in general to be linked with breast cancer, and thus, the genes that are deeply rooted in the network of known cancer-related genes may also be novel bio-markers or cancer genes. In particular, as shown in Figure 5, the TP53 gene is a tumor suppressor protein containing DNA binding and transcriptional activation domains. TP53 inter-acts both indirectly and directly with many of our selected genes. The TNF-alpha gene is a tumor necrosis factor involved in a wide spectrum of biological interactions, and it is mostly indirectly connected to our selected heterogeneous genes.
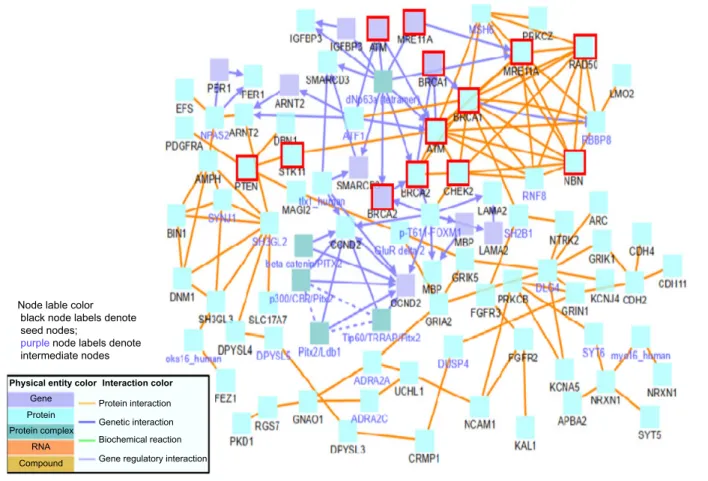
Beyond the above tumor suppressor genes, we have also formed genetic mappings between the heterogeneous gene list of 173 and known breast cancer genes of high- or intermediate-risk such as BRCA1, BRCA2, STK11, PTEN, ATM, CHEK2, MRE11A, RAD50, and NBN.25–27 Breast
cancer cases are usually associated with these abnormal genes. We have limited the number of breast cancer genes by choos-ing those with the most evidence of their relation to cancer.
Implementing the induced network module once again, we consider binary protein and gene regulatory interactions to determine biological links between our long list of poten-tial breast cancer biomarkers and these known cancer genes. From this network, we notice a multitude of heterogeneous genes directly linked to high-risk breast cancer genes, espe-cially those in the top right section of Figure 6. Abnormalities in these genes are likely to affect gene and protein interac-tions and biological funcinterac-tions, thus giving a high potential for affecting and indicating breast cancer in a patient.
Hub genes and potential biomarkers for breast cancer. By selecting heterogeneous genes that show up most signifi-cantly in a greater number of cancer modules, we obtain a longer list of 271 genes. We then remove intermediate nodes, focusing only on the original data to discover hub genes as shown in Figure 7. In Figure 7, the number of interactions ranges from 1 to 8. We define hub genes as heterogeneous oncogenes that interact with six other genes. Therefore, we select approximately the top 25% of interactive genes, which likely lead to greater potential consequences due to increased relations. Genes that indicate potential effects in multiple cancer modules are more likely indicators of the breast cancer itself. In Figure 7, 12 indicated oncogenes are found among our prespecified heterogeneous genes. We notice that 6 of these 12 (or 50%) oncogenes are identified as hub genes. The
Node lable color black node labels denote seed nodes;
purple node labels denote intermediate nodes Physical entity color
Gene Protein Protein complex RNA Compound Protein interaction Genetic interaction Biochemical reaction Gene regulatory interaction Interaction color
figure 5. tumor suppressor gene network including tP53, tP63, and tnf-alpha.
Notes: the three genes (tP53, tP63, and tnf-alpha) are outlined in red. Black node labels represent heterogeneous genes. Blue node labels represent
Node lable color black node labels denote seed nodes;
purple node labels denote intermediate nodes Physical entity color
Gene Protein Protein complex RNA Compound Protein interaction Genetic interaction Biochemical reaction Gene regulatory interaction
Interaction color
figure 6. Breast cancer susceptibility of high- and intermediate-risk genetic mapping. Note: these breast cancer genes are outlined in red.
Physical entity color
Gene Protein Protein complex RNA Compound Protein interaction Genetic interaction Biochemical reaction Gene regulatory interaction
Interaction color
figure 7. networks for hub genes and potential biomarkers for breast cancer.
Tian et al
hub genes may have strong potential as breast cancer bio-markers and are listed along with their functions in Table 3. Our results show a relatively strong correlation between hetero geneous oncogenes in breast cancer cell lines and their roles as hub genes.
discussion
We focus part of our research on the comparison of metrics both quantitatively and qualitatively. It is intuitive that the qualitative methylation states of H, L, HM, and LM have relatively less variation than the Median, Bimodal, and Rest
states, but it is not quantitatively clear how large the variation of reach methylation state is and how different several methy-lation states are. In addition, as shown in the QDMR paper, the entropy seems to be a good method of identifying differ-ential methylation regions or characterizing the heterogeneity patterns of methylation levels. However, when we zoom in to investigate the performance of the entropy score, we find the surprising and counterintuitive results of QDMR entropy. This has sparked our interest in evaluating other quantitative metrics and comparing them with the intuitive qualitative metric of methylation states, as shown in Figure 2.
As for methylation states, we define them based on our understanding of the methylation sequencing data. We did some exploratory analysis as shown in Figure 1 of our previous publication at the International Journal of Biomedical Data Mining.12 According to Figure 1 and in theory, the Low (or L)
methylation state should be around “0”. In addition, consider-ing that there may be methylation sequencconsider-ing quality issues and large variation due to unknown reasons, we define it to be [0, 0.2]. Similarly, we define the High (or H) methylation state to be in the range of [0.8, 1].
Methylation, as a component of normal cellular ontogeny, likely plays a critical role in facilitating tumor cell progression. Because methylation, especially hemimethylation (methylation only on one DNA strand28), can be ephemeral in nature, it is
sometimes used to explain sudden changes in metastatic abili-ties. Variation in DNA methylation, which is related to eukary-otic gene control, may play a major role in the hetero geneity and phenotypic instability found in cancer cells. Random somatic mutational events, which are responsible for heterogeneity and are exemplified by the Bimodal and Rest methylation states, could reinforce increasingly malignant tumor cells and less responsive states due to increasing genetic alterations.29 In
addi-tion, increased epigenetic heterogeneity in cancer could support cancer cells in rapidly adapting to changing environments.30 conclusion
In this paper, we have studied the methylation heterogeneity patterns for breast cancer cell lines by comparing four met-rics: variance, I 2 statistic, entropy score, and methylation state.
After performing a comparative analysis on the effectiveness of each metric, we have used the categorical metric (methy-lation state) to extract genes with the most heterogeneous states (namely, Bimodal and Rest), which we run through the GSEA software to sort the genes in relation to cancer modules.22 We have compared the list of Bimodal and Rest
heterogeneous genes with numerous data sets to determine the number of known breast cancer methylated genes, tumor sup-pressor genes, oncogenes, and transcription factors found in the heterogeneous gene list. A significant number (376) of the entire gene list is transcription factors. Moreover, 44 of these transcription factors are also identified as oncogenes; there-fore, if expressed, these genes may have a high impact on cancer development.
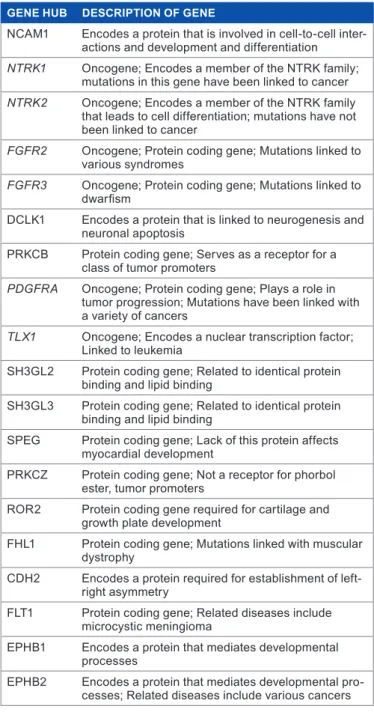
table 3. Carefully selected heterogeneous hub genes from cancer modules.
geNe HuB DeSCRIPtIoN of geNe
nCam1 encodes a protein that is involved in cell-to-cell inter-actions and development and differentiation NTRK1 oncogene; encodes a member of the ntrK family;
mutations in this gene have been linked to cancer NTRK2 oncogene; encodes a member of the ntrK family
that leads to cell differentiation; mutations have not been linked to cancer
FGFR2 oncogene; Protein coding gene; mutations linked to various syndromes
FGFR3 oncogene; Protein coding gene; mutations linked to dwarfism
DCLK1 encodes a protein that is linked to neurogenesis and neuronal apoptosis
PrKCB Protein coding gene; serves as a receptor for a class of tumor promoters
PDGFRA oncogene; Protein coding gene; Plays a role in tumor progression; mutations have been linked with a variety of cancers
TLX1 oncogene; encodes a nuclear transcription factor; Linked to leukemia
sH3GL2 Protein coding gene; related to identical protein binding and lipid binding
sH3GL3 Protein coding gene; related to identical protein binding and lipid binding
sPeG Protein coding gene; Lack of this protein affects myocardial development
PrKCZ Protein coding gene; not a receptor for phorbol ester, tumor promoters
ror2 Protein coding gene required for cartilage and growth plate development
fHL1 Protein coding gene; mutations linked with muscular dystrophy
CDH2 encodes a protein required for establishment of left-right asymmetry
fLt1 Protein coding gene; related diseases include microcystic meningioma
ePHB1 encodes a protein that mediates developmental processes
ePHB2 encodes a protein that mediates developmental pro-cesses; related diseases include various cancers Notes: the genetic functions of these genes are provided in the second
column. six known heterogeneous oncogenes are in italic. these hub genes have significant potential as indications of breast cancer susceptibility.
After selecting genes represented in the highest number of related cancer modules, we have utilized the publicly avail-able software ConsensusPathDB to analyze integrated gene networks. These networks display significant selected hetero-geneous genes that are linked in biological functions to tumor suppressor genes and high- and moderate-risk known breast cancer genes. Furthermore, we merge our results from GSEA and ConsensusPathDB to determine a link between hetero-geneous oncogenes and hub genes, or genes that interact with at least six separate genes from the cancer modules. There-fore, the more cancer modules in which a gene has effect, the stronger its indication of breast cancer. Using this information, we conclude that a considerable percentage of heterogeneous known oncogenes are also hub genes, determining 19 poten-tial breast cancer biomarker genes. These 19 genes are a contri-bution to the genetic databases PubMeth (pubmeth.org) and GeneCards (genecards.org), as well as cancer treatment and screening for early detection among breast cancer patients.
Our results provide a substantial contribution to the growing databases of breast cancer-related genes, which can be used during early treatment and screening of patients to discover certain genes that may have an important impact on breast cancer. Our results also show a significant correlation between heterogeneous oncogenes and hub genes (the poten-tial biomarkers) that other cancer researchers and doctors may find useful when locating cancerous genomic regions.
Acknowledgment
We appreciate the support provided by our IT colleagues and the MathWorks staff members at Texas State University.
Author contributions
Conceived and designed the experiments: SS. Analyzed the data: ST, KB, LY. Wrote the first draft of the manuscript: ST, KB, LY, SS. Contributed to the writing of the manuscript: ST, KB, LY, SS. Agreed with manuscript results and conclusions: ST, KB, LY, SS. Jointly developed the structure and argu-ments for the paper: ST, KB, LY, SS. Made critical revisions and approved the final version: SS. All the authors reviewed and approved the final manuscript.
reFerences
1. Siegel R, Ma J, Zou Z, Jemal A. Cancer statistics, 2014. CA Cancer J Clin. 2014;64(1):9–29.
2. DeSantis C, Ma J, Bryan L, Jemal A. Breast cancer statistics, 2013. CA Cancer J
Clin. 2014;64(1):52–62.
3. Domingo L, Jacobsen KK, von Euler-Chelpin M, et al. Seventeen-years over-view of breast cancer inside and outside screening in Denmark. Acta Oncol. 2013;52(1):48–56.
4. Houssami N, Given-Wilson R, Ciatto S. Early detection of breast cancer: over-view of the evidence on computer-aided detection in mammography screening.
J Med Imaging Radiat Oncol. 2009;53(2):171–6.
5. Shetty MK. Screening for breast cancer with mammography: current status and an overview. Indian J Surg Oncol. 2010;1(3):218–23.
6. Brooks MD, Burness ML, Wicha MS. Therapeutic implications of cellular hetero geneity and plasticity in breast cancer. Cell Stem Cell. 2015;17(3):260–71. 7. Mardis ER. The $1,000 genome, the $100,000 analysis? Genome Med. 2010;2(11):84. 8. Yang X, Yan L, Davidson NE. DNA methylation in breast cancer. Endocr Relat
Cancer. 2001;8(2):115–27.
9. Lim DH, Maher E. DNA methylation: a form of epigenetic control of gene expression. Obstetrician Gynaecologist. 2010;12:6.
10. Jones PA. Functions of DNA methylation: islands, start sites, gene bodies and beyond. Nat Rev Genet. 2012;13(7):484–92.
11. Sun S, Yu X. HMM-Fisher: identifying differential methylation using a hidden Markov model and Fisher’s exact test. Stat Appl Genet Mol Biol. 2016;15(1):55–67. 12. Xu L, Mitra-Behura S, Alston B, Zong Z, Sun S. Identifying DNA methylation
variation patterns to obtain potential breast cancer biomarker genes. Int J Biomed
Data Min. 2015;4:115.
13. Yu X, Sun S. HMM-DM: identifying differentially methylated regions using a hidden Markov model. Stat Appl Genet Mol Biol. 2016;15(1):69–81.
14. Zhang Y, Liu H, Lv J, et al. QDMR: a quantitative method for identification of differentially methylated regions by entropy. Nucleic Acids Res. 2011;39(9):e58. 15. Higgins JP, Thompson SG. Quantifying heterogeneity in a meta-analysis. Stat
Med. 2002;21(11):1539–58.
16. Higgins JP, Thompson SG, Deeks JJ, Altman DG. Measuring inconsistency in meta-analyses. BMJ. 2003;327(7414):557–60.
17. Sun Z, Asmann YW, Kalari KR, et al. Integrated analysis of gene expression, CpG island methylation, and gene copy number in breast cancer cells by deep sequencing. PLoS One. 2011;6(2):e17490.
18. Harris EY, Ponts N, Le Roch KG, Lonardi S. BRAT-BW: efficient and accurate mapping of bisulfite-treated reads. Bioinformatics. 2012;28(13):1795–6. 19. Kamburov A, Pentchev K, Galicka H, Wierling C, Lehrach H, Herwig R.
ConsensusPathDB: toward a more complete picture of cell biology. Nucleic Acids
Res. 2011;39(Database issue):D712–7.
20. Kamburov A, Stelzl U, Lehrach H, Herwig R. The ConsensusPathDB interaction database: 2013 update. Nucleic Acids Res. 2013;41(Database issue):D793–800. 21. Kamburov A, Wierling C, Lehrach H, Herwig R. ConsensusPathDB – a
data-base for integrating human functional interaction networks. Nucleic Acids Res. 2009;37(Database issue):D623–8.
22. Segal E, Friedman N, Koller D, Regev A. A module map showing conditional activity of expression modules in cancer. Nat Genet. 2004;36(10):1090–8. 23. Subramanian A, Tamayo P, Mootha VK, et al. Gene set enrichment analysis:
a knowledge-based approach for interpreting genome-wide expression profiles.
Proc Natl Acad Sci U S A. 2005;102(43):15545–50.
24. Available at: http://robotics.stanford.edu/∼erans/cancer/modules/.
25. Damiola F, Pertesi M, Oliver J, et al. Rare key functional domain missense substitutions in MRE11A, RAD50, and NBN contribute to breast cancer sus-ceptibility: results from a Breast Cancer Family Registry case-control mutation-screening study. Breast Cancer Res. 2014;16(3):R58.
26. Park DJ, Tao K, Le Calvez-Kelm F, et al. Rare mutations in RINT1 predis-pose carriers to breast and Lynch syndrome-spectrum cancers. Cancer Discov. 2014;4(7):804–15.
27. van der Groep P, van der Wall E, van Diest PJ. Pathology of hereditary breast cancer. Cell Oncol (Dordr). 2011;34(2):71–88.
28. Sun S, Li P. HMPL: a pipeline for identifying hemimethylation patterns by comparing two samples. Cancer Inform. 2015;14(suppl 2):235–45.
29. Jones PA. DNA methylation and cancer. Cancer Res. 1986;46(2):461–6. 30. Hansen KD, Timp W, Bravo HC, et al. Increased methylation variation in