HAL Id: hal-01625001
https://hal.uca.fr/hal-01625001
Submitted on 20 Dec 2018
HAL is a multi-disciplinary open access archive for the deposit and dissemination of sci-entific research documents, whether they are pub-lished or not. The documents may come from teaching and research institutions in France or abroad, or from public or private research centers.
L’archive ouverte pluridisciplinaire HAL, est destinée au dépôt et à la diffusion de documents scientifiques de niveau recherche, publiés ou non, émanant des établissements d’enseignement et de recherche français ou étrangers, des laboratoires publics ou privés.
V. Gueugneau, K. Kelfoun, Olivier Roche, L. Chupin
To cite this version:
V. Gueugneau, K. Kelfoun, Olivier Roche, L. Chupin. Effects of pore pressure in pyroclastic flows : nu-merical simulation and experimental validation. Geophysical Research Letters, American Geophysical Union, 2017, 44 (5), pp.2194-2202. �10.1002/2017GL072591�. �hal-01625001�
This article has been accepted for publication and undergone full peer review but has not been through the copyediting, typesetting, pagination and proofreading process which may lead to differences between this version and the Version of Record. Please cite this article as
Effects of pore pressure in pyroclastic flows: numerical simulation and
experimental validation
V. Gueugneau1, K. Kelfoun1, O. Roche1, L. Chupin2
1
Laboratoire Magmas et Volcans, Université Clermont Auvergne - CNRS - IRD, OPGC, Campus Universitaire des Cézeaux, 6 Avenue Blaise Pascal, 63178 Aubière Cedex.
2
Laboratoire de Mathématiques Blaise Pascal, Université Clermont Auvergne - CNRS, Campus Universitaire des Cézeaux, 3 place Vasarely, 63178 Aubière Cedex.
Corresponding author: Valentin Gueugneau ([email protected]).
Key Points:
The effect of pore pressure is considered to model pyroclastic flows with Coulomb rheology
The numerical model is validated by comparing with experiments and is applied to simulate real pyroclastic flows
Pore pressure diffusion provides a possible explanation for levée formation in pyroclastic flows
Abstract
Pyroclastic flows are mixtures of volcanic gases and particles that can be very hazardous owing to their fluid-like behavior. One possible mechanism to explain this behavior is the reduction of particles friction due to the internal gas pore pressure. To verify this hypothesis, we present a numerical model of a granular flow with high initial pore pressure that decreases with time as the gas-particle mixture propagates. Firstly, we validate the model by reproducing laboratory experiments. Then, the numerical code is applied to pyroclastic flows of Lascar volcano (1993 eruption, Chile). The simulation reproduces the runout and the morphological features of the deposits, with lateral levées, a central channel and a lobate front. Our results support the hypothesis of the role of gas pore pressure in pyroclastic flows and explain both the fluid-like behavior of the flows and the formation of lateral levees.
1. Introduction
Pyroclastic flows are common in volcanic environment and are formed by the collapse of a lava dome [e.g. Cole et al., 1999] or of an eruptive column [e.g. Sparks and Wilson, 1976]. They consist of a dense hot mixture of solid particles and volcanic gases, which is overridden by a dilute turbulent ash cloud [Druitt, 1998, Branney and Kokelaar, 2002, Sulpizio et al., 2014, Dufek, 2016]. Pyroclastic flows can propagate in a fluid-like manner and the largest flows may have velocities of tens of meters per second and runout distances up to 100 km, even on sub-horizontal slopes [Roche et al, 2016]. These flows can damage buildings and infrastructures, and they represent the first cause of death in volcanic environments [Blong, 1984]. Therefore, a robust forecasting of their related hazards is essential.
Despite numerous studies, the physics of pyroclastic flows is still debated [Sparks, 1976;
Wilson, 1984; Battaglia, 1993; Palladino and Valentine, 1995; Lube et al., 2007; Kelfoun et al., 2009; Kelfoun, 2011; Dufek 2016; Roche et al., 2016; Breard and Lube, 2017]. On one
hand, the long runout distances of pyroclastic flows suggest a fluid-like behavior caused by a mechanism that severely reduces intergranular stresses. Several authors have attributed this behavior to high interstitial gas pore pressure that reduces the inter-particle frictions in the granular mixture [Sparks, 1978; Wilson, 1984; Druitt et al., 2004, 2007; Roche 2012;
Bareschino et al., 2007]. On the other hand, some pyroclastic flow deposits have structures
like lateral levées and steep front lobes typical of frictional granular materials [Rowley et al., 1981; Lube et al., 2007], which suggests that friction reduction caused by high interstitial gas pore pressure, if occurring, may not operate spatially and/or temporarily through the entire flow mass.
We investigate here the effect of interstitial gas pressure on the dynamics of pyroclastic flows. We first develop a depth-averaged model of a granular flow with pore pressure that decreases according to a diffusion law. In the following we use the terms “flow with pore pressure” and “dry flow” to indicate that the pore pressure is higher or equal to the atmospheric pressure, respectively. We validate the model by reproducing the results of laboratory experiments. Finally, we simulate the emplacement of pyroclastic flows at a real scale and show that the model simulates both high flow mobility and deposit morphology similar to that of natural deposits.
2. Granular flows and fluidization mechanism
2.1. Gas pore pressure and fluidization
A granular flow is an assemblage of solid particles which can move independently from one another. The kinetic energy of a dense granular flow is lost essentially through the shear stress between the flow particles as well as between the flow base and the surface on which the particles propagate [Pouliquen and Forterre, 2001; GDR MiDi, 2004]. For a dry granular flow over a flat horizontal surface, the frictional shear stress τ at any depth H can be described as a first approximation by a Coulomb law:
tan gH
, (1)
where is the flow density, g is the gravity and is the friction angle of the material. We distinguish the internal friction angle = int, between the particles themselves and the basal
friction angle = bed, between the particles and the surface on which they flow. These angles
are often assumed to be constant even if they may vary by a few degrees according to the velocity and the thickness of the flow (see the works on the (I) rheology, Pouliquen and
Forterre, 2001).
If the granular medium has gas pore pressure higher than the atmospheric pressure, the pressure gradient causes the gas to escape. The gas motion generates a drag force on the particles that can counterbalance their weight and, consequently, can lower the inter-particles frictions. Assuming that the pressure gradient is vertical, and integrating it from the flow surface to a given depth H in the flow gives:
gH P Ps
tan (2)
where P is the pore fluid pressure at the depth H and Ps is the pressure at the flow surface (in
this study the atmospheric pressure, Ps = Patm). In the following, to simplify the writing, we
use apparent friction angles that are defined as follows:
tan s tan
gH gH P P
so that tan 1 P Ps tan
gH (3)
We use int and bed for the internal and basal apparent friction angles respectively. If the
pressure gradient PPsequals the lithostatic pressure gH, the frictional stress is zero ( 0
) as well as the apparent friction angles (
int
bed 0) and the granular medium is said to be fluidized.2.2. Pore pressure variation
Because the gas escapes, the initial pore pressure decreases progressively to the ambient pressure Patm. The evolution of the gas density along the vertical axis z with time t can be
solved from both an equation of mass conservation (4) and the Darcy’s law (5) [Yilmaz et al., 1994]:
( ) 0 g gv t z (4) k P v z (5)where g is the gas density (kg m-3), the gas volume fraction, v the vertical velocity of the
gas through the granular material (m s-1), k the hydraulic permeability (m²), and the dynamic viscosity of the gas (Pa s).
Using Eq. (4) and (5) and the ideal gas law, the pressure decrease at any depth can be simulated using a simple diffusion equation (see Yilmaz et al., 1994 and Montserrat et al., 2012 for details): 2 2 P P D t z (6)
where D is the diffusion coefficient of the gas through the granular medium. This coefficient depends on the characteristics of the particles and of the interstitial fluid, here assumed to be air, so that [Iverson 1997]:
k D
(7)
with the gas compressibility (Pa-1). We consider hereafter that is constant because the range of pressure in our experiments (Section 4) is relatively small (101300 Pa to 104243 Pa, i.e. difference <3 %).
Because we use a depth-averaged approach in our numerical code (presented in Section 3), we have to use a form of Eq. (6) compatible with our averaging. Then, at the base (z = 0) of the granular material of thickness h, the basal pressure Pb can be approached by:
2 2 2 b s b P P P D t h , (8)The detailed derivation of Eq. (8) from Eq. (6) is presented in Supporting Information. A similar approach was already proposed by Iverson and Denlinger [2001] for water in mud flows, the main differences being the water incompressibility and density. Note that this is
also close to the approach of Stilmant et al. [2014] for simulation of ash coke flows. However, Eq. (8) is slightly different than their solution that uses a coefficient2 D, instead of
2
2 D
(see Supporting Information).
3. Numerical modelling
We simulate the flow emplacement by solving the equations of mass conservation and momentum balance with a depth-averaged approach:
0 h hu t x (9)
2
2 actpass bed 1 tan 2 u hu hu k gh gh t x x u (10)where h is the flow thickness, u is the flow velocity and kactpassis the earth pressure coefficient, which accounts for pressure anisotropy and is affected by the pressure gradient through the values of the apparent friction angles int and bed so that:
1 2 1 (1 cos ² (1 tan ² )) 2 1 cos ² int bed actpass int k . (11)
The sign is related to the horizontal and vertical stresses in the flow: negative (and kactpass
active) where the flow is divergent and positive (and kactpass passive) where it is convergent
(see Savage and Hutter, 1991 for more details).
The effect of the slope is not taken into account here because the flow propagates on a horizontal base, as in the laboratory experiments (see Section 4). The basal pore pressure diffuses and is advected [Iverson and Denlinger, 2001] with the granular mass through another balance equation:
2 2 ² b b b s P P P P u D t x h . (12)
To solve the Eq. (9-12), we have modified the numerical code VolcFlow (see Kelfoun and
Druitt, 2005 for details) to advect the pore pressure, to calculate the decrease of pore pressure
according to a diffusion law (Eq. 12), and to take into account both the influence of the pressure on the friction angles (Eq. 3) and their effect on the flow dynamics (Eq. 10-11).
4. Laboratory experiments
We have validated our numerical results with a series of dam-break experiments with glass beads of 80 m diameter and a density of 2500 kg m-3, and bulk density (i.e. for beads and interstitial air) of about 1500 kg m-3. The beads were released from a reservoir by rapid gate opening, which created a flow in a horizontal channel (see details on the experimental device in Roche 2012). We considered flow with initial high pore pressure (Pb =gh + Patm)
or dry flows (Pb = Patm). To generate flows with initial high pore pressure an air flux was
injected at the minimum fluidization velocity through a porous plate at the base of the reservoir, i.e. int = bed = 0 according to Eq. (2). The small size of the beads conferred a
hydraulic permeability of ~10-11 m2, which was sufficiently small at the laboratory scale to allow for slow pore pressure diffusion [Roche, 2012]. The initial thickness Hr of the granular
column in the reservoir was 10 cm or 20 cm and the initial length Lr was 20 cm. We restricted
our study to relatively small thicknesses (Hr Lr), which permitted to use the depth-averaged approach in our simulations. The experiments were recorded with a high-speed video camera to measure both the flow front position with time and the shape of the deposit. The flows emplacement followed three distinct phases (acceleration, constant velocity and deceleration) typical of dam-break granular flows [e.g. Lube et al. 2007, Roche et al. 2008].
5. Comparison between simulations and experiments
5.1. Input parameters of the model
The input parameter values of the numerical model are those of the experiments: the bulk density of the air-particle mixture is =1500 kg m-3, and the internal and basal friction angles without pore fluid pressure are, respectively, int=24° (maximum slope of a pile of glass beads at rest) and bed = 19° (angle of slope needed for a layer of glass beads glued on a rigid plate to slide on the smooth experimental basal surface). There is no free parameter in the model, the only incertitude being the exact value of the diffusion coefficient, D, for pore pressure flows. Experimental measurements on defluidizing static granular columns of the same particles as we consider here by Roche (2012, see his Fig. 5) show that the experimental diffusion coefficient, De, is of the order of 0.01 m² s-1 and is related to the bed heights in the
reservoir for values of Hr considered in the present study (<0.2 m). Moreover, it is important
to note that the diffusion coefficient in a flowing granular mixture could be different from that in a static bed because of continuous rearrangement of the particles. It is why we have
estimated the best mean value of the diffusion coefficient by fitting the results of the simulations with that of the experiments.
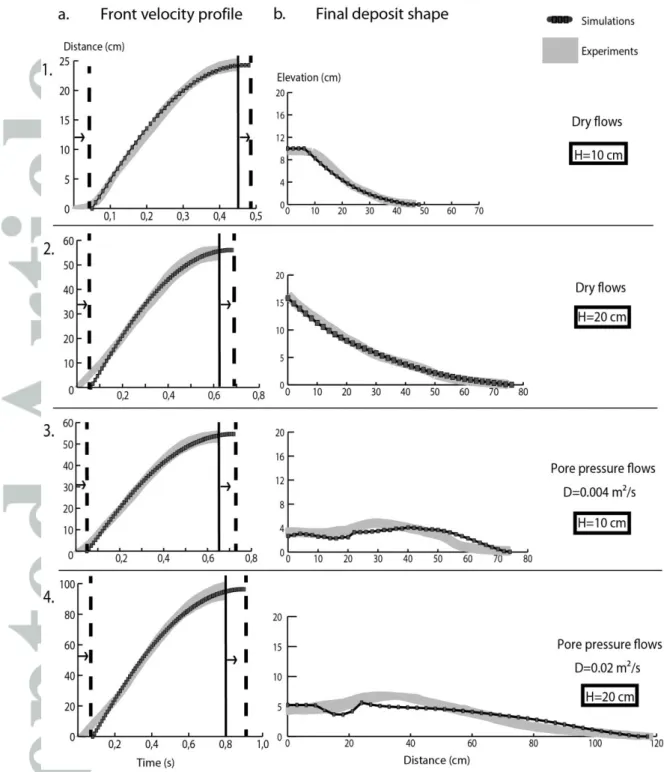
In all our simulations the duration of the acceleration phase is negligible compared to that of both the constant-velocity and deceleration phases (Fig. 1). It is likely that the acceleration phase in the experiments was influenced by the duration of gate opening (< 0.1 s), which is instantaneous in the simulations. For this reason, the numerical results of Fig.1 are shifted to take into account the duration of gate opening in the experiments, which was measured accurately in the high speed videos.
5.2. Dry Flows
Dry flows (i.e. pore pressure equal atmospheric pressure) slow down rapidly to form a wedge-shaped pile of beads with a more or less pronounced upward-concave shape (Fig. 1). The simulations reproduce well both the front kinematics and the deposit morphology, though the simulated flow duration and runout are a bit longer than in experiments (3-4%). For Hr = 0.1 m, only the part of the column close to the gate is set in motion while the part
behind remains static. The simulated deposit is slightly thinner (5%) than the experimental one close to the position of the gate. In contrast, for Hr = 0.2 m, all the initial mass at the top
of the column flows and the deposit in the simulations is very close to that in experiments. We recall that, in these simulations, all the input parameters of the model equal the experimental values and that there is no adjustable parameters. Small differences between the model and the experiments might be related to the depth-averaged approach chosen.
5.3. Flows with initial pore pressure
In these experiments, the granular column is totally fluidized before release in order to produce flows with high initial pore pressure. The granular flows spread as inviscid fluids [Roche et al., 2008] in the channel and loose pore pressure according to a pore pressure diffusion law (Eq. 6). Hence they travel a longer distance than their dry counterparts with the same initial geometry, and they decelerate once the pore pressure is low and the friction counteracts motion (Fig. 1). In simulation, we use the same initial conditions as in experiments in the reservoir (Pb =gh + Patm ,
int
bed 0). Results show the flow frontkinematics in the experiments and simulations are very close for both Hr = 0.1 m and 0.2 m
(Fig. 1). To reproduce numerically the experiments, the best-fit values of D are 0.004 m² s-1 for Hr = 0.1 m and 0.02 m² s-1 for Hr = 0.2 m, in agreement with empirical values reported by
Roche [2012] for defluidizing static columns of the same material. There are two possible
competing processes related to the flow thinning: on one hand, thinning at constant pore pressure favors the fluid-like behavior because it decreases the lithostatic pressure ( g h) and
the particles can be supported by the pore pressure gradient (see Eq. 2). On the other hand, thinning causes faster loss of pore pressure (see Eq. 8). Flow deceleration, however, suggests that the effect of pore pressure loss becomes dominant during propagation. The model shows that the granular interactions increase more rapidly at the front where the flow is thinner, and this rapidly causes halting of the granular mass (see Supporting Information). This phenomenon propagates rearwards, from the front toward the initial column position.
Though the lengths of the deposits in the simulations are very close to that in the experiments, the shapes of the deposits reveal significant differences, in contrast to dry flows. In fact at both Hr = 0.1 m and 0.2 m in the experiments the deposit reveals a bulge
immediately beyond the gate at the entrance of the channel (Fig. 1). In contrast, in the numerical simulations, more material was transported downstream, which results in a bulge located close to the front of the deposit. However, the main morphological deposit characteristics are correctly reproduced by the simulations.
6. Application to natural flows
Our new numerical model is now applied to test its ability to simulate natural pyroclastic flows, especially pumice flows of relatively small volume (<106 m3) whose deposits are characterized by terminal lobes with lateral levées and a smooth front. We consider the well described pumice flow deposits of the 1993 Lascar eruption in Chile [Sparks et al., 1997,
Jessop et al., 2012]. For the simulation, equations (9-12) are now solved in x and y directions
(the direction of the flow is parallel to y), adding the slope and curvature effects, using the equations of Kelfoun and Druitt [2005]. The slope angles of the studied area of Lascar volcano decreases from 12° to 6° [Jessop et al., 2012]. We fit this topography with a simple exponential law, to ensure that the deposit morphology reproduced by the model is not caused by the underlain topography that includes the 1993 pumice flow deposits. We then simulate a pyroclastic flow with our new model described above. Figure 2 compares the results obtained with a Coulomb law including pore pressure to two behaviors used previously for the simulation of pyroclastic flows: a dry Coulomb law [Saucedo et al., 2005] and a plastic rheology [Kelfoun et al., 2009 ; Kelfoun, 2011]. The physical parameters (flow
density, volume, initial velocity, slope angle, and specific parameters) for each simulation are listed in the Table 1.
For each case we obtain a well-defined deposit morphology. As already reported by
Kelfoun [2011], the dry Coulomb behavior cannot form a channel with lateral levées in the
range of natural gentle slopes (12° to 6°) for natural friction angle (15°). The plastic behavior is able to form realistic levée-channel morphologies [Kelfoun, 2011] but the frontal lobe is less pronounced than in the field [Jessop et al., 2012]. The Coulomb behavior with pore pressure is able to simulate both the long travel distances on gentle slopes and the levée-channel morphology. This morphology is formed for a large range of initial pore pressure (from 10% to 100% of the lithostatic pressure, see Supporting Information). The simulation that best fits the Lascar deposits (Fig. 2) is obtained for a diffusion coefficient D=0.005 m² s-1 and for an initial pore pressure of 60% of the lithostatic pressure (details in Supporting Information).
The deposit morphology is strongly related to the decrease of pore pressure. For a dry granular flow, levées can be formed on slopes close to the friction angles due to an increase of friction at the margins of the flow [Mangeney et al., 2007] and because at the edges the driving stresses induced respectively by the weight (downslope) and the flow thickness (lateral spreading) are not in the same direction [see Kelfoun, 2011]. For a flow with high pore pressure, the levée-channel morphology is more pronounced because the flow edges, thinner than the flow body, lose pore pressure more rapidly. Hence resistance to motion is more important at the lateral edges where the granular material becomes static and form the levées. In contrast the material in the central channel between the edges maintains a relatively high pore pressure, which favors flow motion. When the supply ceases, the material with high pore pressure in the central channel is drained, the front decelerates and the material accumulates rearwards, hence forming a well-defined frontal lobe and levée-channel morphology.
7. Discussion
7.1. Experimental validation
Our model reproduces the kinematics and the geometry of the deposits of flows with or without initial pore pressure at the laboratory scale. We can conclude that the model captures the main physics of our experimental granular flows. This demonstrates also that the depth-averaged approach is well suited for reproducing the emplacement of flows with initial pore pressure to the first order, even for initial aspect ratios (Hr/Lr) close to 1.
In detail, a clear discrepancy exists between the shape of the deposits in the model and that in the experiments. The deposits in simulations are thicker than in the experiments close to the front, whereas they are thinner close to the initial reservoir (Fig. 1). This might be caused by the depth-averaged approach that cannot reproduce the late injection of particles from the reservoir at the end of the experiments when the bed is thin.
7.2. Implications for pyroclastic flows
The good agreement between the model and the experimental results is promising for the simulation of pyroclastic flows. The model is able to reproduce the emplacement of experimental granular flows with initial Hr/Lr ratios lower than or equal to 1. Natural
pyroclastic flows are long (several kilometers) and thin (some decimeters / meters) and their
Hr/Lr ratio is clearly lower than 1. Moreover, our simulations of granular flows with initial
pore pressure use a physically explained rheological behavior to reproduce the main characteristics of the 1993 Lascar pyroclastic flow deposits: a levée-channel morphology, a frontal lobe (better reproduced than by considering any other rheological laws) and an ability to flow even on small slopes between 12° to 6°. The shapes and dimensions of both the channel and levées are correctly reproduced (see Fig. 2). One exception is the depth of the channel, which is nearly emptied in our model. This could be due to phenomena that are not taken into account in the model such as deposit aggradation or particle segregation that changes the material permeability and hence the pore pressure diffusion timescales [e.g.
Girolami et al., 2010; Roche 2012].
The levée-channel morphology was obtained earlier experimentally and numerically in granular flows without pore pressure [e.g. Mangeney et al., 2007, Kokelaar et al., 2013].
Kokelaar et al. [2013] and Mangeney et al. [2007] have also shown that particle segregation
in a polydisperse flow can facilitate the development of the levée-channel morphology, which causes increase of the runout. However, to form a flow and to create levées the slope angle must be high (between 27° to 29°) and close to the friction angle of the particles. This is significantly higher than the natural range of slopes (generally less than 10°) such as those we considered here. Johnson et al. [2012] have reproduced levées on a horizontal surface in experiments with water-saturated mixtures, suggesting that processes similar to that in gas-particles flows may operate. Kelfoun [2011] have reproduced a levée-channel morphology on realistic slopes considering a plastic rheology. The limit of the plastic model, however, is that its origin is not physically explained. The novelty of our model relies on well-established
physics and shows that a granular flow has a long runout and forms a levée-channel morphology even on very gentle slopes when initial pore pressure is accounted for.
8. Conclusion
Our model is able to reproduce laboratory experiments of granular flows with initial pore pressure as well as the main characteristics of real pyroclastic flows deposits of moderate volume. It shows that a levées-channel morphology can be obtained on gentle slopes below the material friction angle with a Coulomb rheology if the gas pore pressure is taken into account. Gas pressure confers a fluid-like behavior to most of the granular mass while it diffuses rapidly at the flow margins where static levées form. Though the ability of the model to reproduce natural pyroclastic flows must be compared with other natural field cases to test its limits, our results provide interesting perspectives for a better assessment of volcanic hazards related to pyroclastic flows.
Acknowledgments and Data
We thank Greg Valentine for his positive and useful comments on this work. We are also grateful for insightful and constructive comments provided by an anonymous reviewer. This work has be founded by the Domerapi – ANR (French Agence Nationale de la Recherche) Project (ANR-12-BS06-0012). It is a Labex ClerVolc contribution n°241. Supporting data are included as 4 figures and 3 descriptions in Supporting Information file.
References
Battaglia, M. (1993), On pyroclastic flow emplacement, J. Geophys. Res., 98, 22269-22272. Bareschino, P., A. Marzocchella, P. Salatino, L. Lirer, and P. Petrosino (2008),
Self-fluidization of subaerial rapid granular flows, Powder Technol., 182, 323–333. Blong, R. J. (1984), Volcanic Hazards, Academic Press, North Ryde.
Branney, M. J., and P. Kokelaar, (1992), A reappraisal of ignimbrite emplacement: progressive aggradation and changes from particulate to non-particulate flow during emplacement of high-grade ignimbrite, Bull. Volcanol., 54, 504–520.
Breard, E. C. P., and Lube, G. (2017), Inside pyroclastic density currents – uncovering the enigmatic flow structure and transport behavior in large-scale experiments, Earth
Planet. Sci. Lett., 458, 22–36.
Cole, P. D., E. S. Calder, T. H. Druitt, R. Hoblitt, R. Robertson, R. S. J. Sparks, and S. R. Young (1998), Pyroclastic flows generated by gravitational instability of the 1996-97 lava dome of Soufriere Hills Volcano, Montserrat, Geophys. Res. Lett., 25, 3425-3428. Cole, P. D., E. S. Calder, R. S. J. Sparks, A. B. Clarke, T. H. Druitt, S. R. Young , R. A.
Herd, C. L. Harford, and G. E. Norton (2002), Deposits from dome-collapse and fountain-collapse pyroclastic flows at Soufriere Hills Volcano, Montserrat, Geol. Soc.
Mem., 21, 231–262
Druitt, T. H. (1998), Pyroclastic density currents, in The physics of Explosive Volcanic
Eruptions , Geol. Soc. Spec. Publ., vol. 145, edited by J. S. Gilbert and R. S. J. Sparks,
pp. 145–182, The Geological Society, London.
Druitt, T. H., G. Bruni, P. Lettieri, and J.G. Yates (2004), The fluidization behaviour of ignimbrite at high temperature and with mechanical agitation, Geophys. Res. Lett., 31, 1-5.
Druitt, T. H., G. Avard, G. Bruni, P. Lettieri, and F. Maez (2007), Gas retention in fine-grained pyroclastic flow materials at high temperatures, Bull. Volcanol., 69, 881–901. Dufek, J. (2016), The fluid mechanics of pyroclastic density currents, Annu. Rev. Fluid
Mech., 48, 459–485.
Eames, I., and M.A. Gilbertson (2000), The flow of aerated particles over a horizontal rigid surface, J. Fluid Mech, 424, 169–195.
GDR MiDi (2004), On dense granular flows, Eur. Phys. J. E., 14, 341– 365. Geldart, D. (1973), Types of gas fluidization, Powder Technol., 7(5), 285-292.
Girolami, L., O. Roche, T. H. Druitt, and T. Corpetti (2010), Particle velocity fields and depositional processes in laboratory ash flows, with implications for the sedimentation of dense pyroclastic flows, Bull. Volcanol., 72(6), 747–759, doi:10.1007/s00445-010-0356-9
Iverson, R. M. (1997), The physics of debris flows, Rev. Geophys., 35, 245– 296.
Iverson, R. M., and R. P. Denlinger (2001), Flow of variably fluidized granular masses across three-dimensional terrain 1. Coulomb mixture theory, J. Geophys. Res., 106, 537–552. Jessop, D. E., K. Kelfoun, P. Labazuy, A. Mangeney , O. Roche, J. L. Tillier, M. Trouillet,
and G. Thibault (2012), LiDAR derived morphology of the 1993 Lascar pyroclastic flow deposits, and implication for flow dynamics and rheology, J. Volcanol. Geotherm.
Johnson, C. G., B. P. Kokelaar, R. M. Iverson, M. Logan, R. G. LaHusen, and J. M. N. T. Gray, (2012), Grain-size segregation and levee formation in geophysical mass flows. Journal of Geophysical Research, Solid Earth, 117, F01032.
Kelfoun, K., and T. H. Druitt (2005), Numerical modeling of the emplacement of Socompa rock avalanche, Chile, J. Geophys. Res., 110, B12202.
Kelfoun, K., P. Samaniego, P. Palacios, and D. Barba (2009), Testing the suitability of frictional behaviour for pyroclastic flow simulation by comparison with a well-constrained eruption at Tungurahua volcano (Ecuador), Bull. Volcanol., 71, 1057–1075. Kelfoun, K., (2011), Suitability of simple rheological laws for the numerical simulation of dense pyroclastic flows and long-runout volcanic avalanches, J. Geophys. Res., 116, B08209, doi:10.1029/2010JB007622.
Kokelaar, B. P., R. L. Graham, J. M. N. T. Gray, and J. W. Vallance (2013), Fine-grained linings of leveed channels facilitate runout of granular flows, Earth Planet. Sci. Lett., 385, 172–180.
Lube, G., H. E. Huppert, R. S. J. Sparks, and A. Freundt (2007b), Static and flowing regions in granular collapses down channels, Phys. Fluids, 19, 043301.
Mangeney, A., F. Bouchut, N. Thomas, J. P. Vilotte, and M. O. Bristeau (2007), Numerical modeling of self-channelling granular flows and of their levée channel deposits, J.
Geophys. Res.,112, F02017.
Mangold, N., F. Costard, and F. Forget (2003), Debris flows over sand dunes on Mars: Evidence for liquid water, J. Geophys. Res., 108(E4), 5027.
Montserrat, S., A. Tamburrino, O. Roche, Y. Niño, and C. F. Ihle (2016), Enhanced run-out of dam-break granular flows caused by initial fluidization and initial material expansion.
Granul. Matt., doi:10.1007/s10035-016-0604-6.
Palladino, D. M., and G. A. Valentine (1995), Coarse-tail vertical and lateral grading in pyroclastic flow deposits of the Latera Volcanic Complex (Vulsini, central Italy): Origin and implications for flow dynamics, J. Volcanol. Geotherm. Res., 69, 343 – 364. Pouliquen, O., and Y. Forterre, (2001), Friction law for dense granular flows: application to
the motion of a mass down a rough inclined plane, J. Fluid Mech., 453, 133-151.
Rhodes, M. J. (1998), Introduction to Particle Technology, John Wiley, Chichester, U. K., 466.
Roche, O. (2012), Depositional processes and gas pore pressure in pyroclastic flows: an experimental perspective, Bull. Volcanol., 74(8), 1807–1820, doi:10.1007/s00445-012-0639-4.
Roche, O., S. Montserrat, Y Niño, and A. Tamburrino (2008), Experimental observations of water-like behavior of initially fluidized, dam break granular flows and their relevance for the propagation of ash-rich pyroclastic flows, J. Geophys. Res., 113, B12203.
Roche, O., D. C. Buesch, and G. A. Valentine (2016), Slow-moving and far-travelled pyroclastic flows during the Peach Spring super-eruption, Nat. Comm., 7, 10890, doi: 10.1038/ncomms10890.
Rowley, P. D., M. A. Kuntz, and N. S. MacLeod (1991), Pyroclastic-flow deposits, U.S.
Saucedo, R., J. L. Macias, M. F. Sheridan, M. I. Bursik, and J. C. Komorowski (2005), Modeling of pyroclastic flows of Colima Volcano, Mexico : implications for hazard assessment, 139, 103–115, doi:10.1016/j.jvolgeores.2004.06.019.
Stilmant, F., M. Pirotton, P. Archambeau, S. Erpicum, and B. Dewals (2014), Can the collapse of a fly ash heap develop into an air-fluidized flow? Reanalysis of the Jupille accident (1961), Geomorpho., 228, 746-755, doi:10.1016/j.geomorph.2014.01.020. Sparks, R.S.J., (1976), Grain size variations in ignimbrite and implication for the transport of
pyroclastic flows, Sedimentology, 23, 147–188.
Sparks, R.S.J., (1978), Gas release rates from pyroclastic flows: an assessment of fluidization in their emplacement, Bull. Volcanol., 41, 1–9.
Sparks, R. S. J., and L. Wilson (1978). Theoretical modelling of the generation, movement and emplacement of pyroclastic flows by column collapse. J. Geophys. Res., B83, 1727-1739.
Sparks, R. S. J., M. C. Gardeweg, E. S. Calder, and S. J. Matthews (1997), Erosion by pyroclastic flows on Lascar Volcano, Chile, Bull. Volcanol., 58(7), 557–565. doi:10.1007/s004450050162.
Sulpizio, R., P. Dellino, D. M. Doronzo, and D. Sarocchi (2014), Pyroclastic density currents: state of the art and perspectives, J. Volcanol. Geotherm. Res., 283, 36-65,
doi:10.1016/j.jvolgeores.2014.1006.1014.
Wilson, C.J.N., (1984), The role of fluidization in the emplacement of pyroclastic flow 2. Experimental results and their interpretation, J. Volcanol. Geotherm. Res., 20, 55–78. Yilmaz, O., R. C. Nolen-Hoeksema, and A. Nur (1994), Pore pressure profiles in fractured
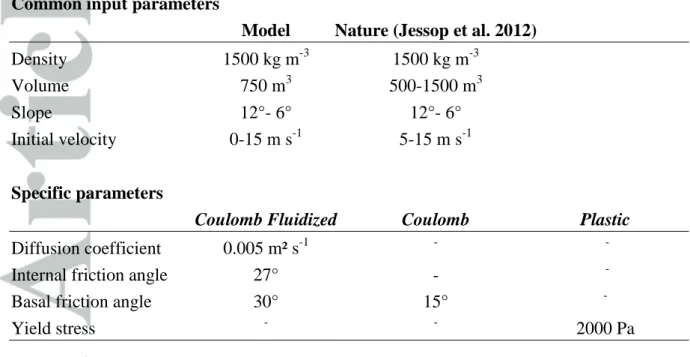
Table 1: Input parameters for the simulations in Fig. 2. The upper part refers to input
parameters common to all simulations for the three rheological behaviors. The lower part refers to input parameters specific to each behavior.
Common input parameters
Model Nature (Jessop et al. 2012)
Density 1500 kg m-3 1500 kg m-3
Volume 750 m3 500-1500 m3
Slope 12°- 6° 12°- 6°
Initial velocity 0-15 m s-1 5-15 m s-1
Specific parameters
Coulomb Fluidized Coulomb Plastic
Diffusion coefficient 0.005 m² s-1 -
-Internal friction angle 27° - -
Basal friction angle 30° 15° -
Figure 1: Flow front kinematics (a) and final shape (b) of deposits for experiments and
simulations (see legend). Initial bed thicknesses Hr are 0.1 m (1 and 3) and 0.2 m (2 and 4).
Parameters in the simulations are the bulk flow density of 1500 kg.m-3, internal friction angle of 24°, and basal friction angle of 19°. Fitted diffusion coefficients are D=0.004 m² s-1 for Hr
=0.1 m and D=0.02 m² s-1 for Hr =0.2 m. The experimental data represent the range of results
obtained for six experiments. For the front kinematics, each simulation curve is shifted by 0.06-0.1 s to the right to account for delays caused by gate opening.
Figure 2: Results of 3D simulations for the three models: dry Coulomb law, Coulomb low
including pore pressure and plastic behaviors. The simulations are made with the same initial conditions (Table 1). For each case, rheological parameters in the code are adapted to find the best simulation regarding Lascar deposits. Results are presented as a topographic map of deposits with contour lines. Cross sections of deposits (below each simulation) highlight the levées. The simulations can be compared to the DEM of real pyroclastic flow deposits from 1993 Lascar eruption (left).