HAL Id: hal-02304421
https://hal.sorbonne-universite.fr/hal-02304421
Submitted on 3 Oct 2019
HAL is a multi-disciplinary open access
archive for the deposit and dissemination of
sci-entific research documents, whether they are
pub-lished or not. The documents may come from
teaching and research institutions in France or
abroad, or from public or private research centers.
L’archive ouverte pluridisciplinaire HAL, est
destinée au dépôt et à la diffusion de documents
scientifiques de niveau recherche, publiés ou non,
émanant des établissements d’enseignement et de
recherche français ou étrangers, des laboratoires
publics ou privés.
adsorption: more insights from a combined neutron
reflectivity and electron microscopy study
Anastasia Christoulaki, Alexis Chennevière, Emmanuelle Dubois, Nicolas
Jouault
To cite this version:
Anastasia Christoulaki, Alexis Chennevière, Emmanuelle Dubois, Nicolas Jouault. Duplex nanoporous
alumina and polyelectrolyte adsorption: more insights from a combined neutron reflectivity and
electron microscopy study.
Nanoscale, Royal Society of Chemistry, 2019, 11 (5), pp.2148-2152.
Journal Name
COMMUNICATION
a.
Sorbonne Université, CNRS, Laboratoire PHENIX, F-75005, Paris, France. Email: nicolas.jouault@sorbonne-universite.fr
b.
Laboratoire Léon Brillouin, CEA Saclay, 91191 Gif-Sur-Yvette, France.
†Electronic Supplementary Information (ESI) available: [Current density curves, SEM analysis, all NR fitting parameters]. See DOI: 10.1039/x0xx00000x
Received 00th January 20xx, Accepted 00th January 20xx DOI: 10.1039/x0xx00000x www.rsc.org/
Duplex nanoporous alumina and polyelectrolyte adsorption: more
insights from a combined neutron reflectivity and electron
microscopy study
Anastasia Christoulaki,a Alexis Chennevière, b Emmanuelle Dubois, a and Nicolas Jouault*a
Neutron reflectivity (NR) is a powerful technique to investigate the incorporation of nanomaterials (polymers, nanoparticles,…) into multilayers porous systems. Here we propose an experimental approach combining NR and scanning electron microscopy (SEM) to successfully characterize duplex nanoporous anodic aluminum oxide (nAAO) and to extract quantitative information about the entering and adsorption of polyelectrolytes (PE) in nanopores. Duplex nAAO are promising systems to study the influence of geometrical constriction, i.e. reduction of pore diameter along the pore channel, on the confinement of condensed matter.
Nanoporous anodic alumina oxides (nAAO) are very promising host systems for confinement studies. nAAO are obtained through the controlled anodization of aluminum (Al) in acidic electrolytes and are composed of high-ratio parallel cylindrical channels with perfectly tunable pore diameters, interpore distances, lengths and porosity. Several studies have explored
the potential applications of nAAO such as biosensors1,
templates for the growth of functional materials2, ion selective
membranes3, filtration or chemical separation devices,making
nAAO interesting materials for many purposes.
Since the pioneering work of Masuda and Fukuda in 1995 who proposed a two-step anodization process to produce very
ordered nanopores4, new experimental strategies have been
developed to synthesize more complex nAAO with variable and modulated morphologies using anodization/chemical etching
sequences5, current pulses6 or cyclic current gradients7.
Among these new structures, bilayers or “duplex” nAAO are composed of two connected layers having similar pore density but different pore diameters Dp8: one top layer with large Dp
followed by a bottom layer with smaller Dp (see scheme in Fig.
1c). Such organization induces a geometrical constriction, i.e. a reduction of pore diameter along the pore channel, that plays
an important role for instance in gas adsorption and condensation9-11.
Duplex nAAO systems require original and suitable experimental strategies to characterize at the nanometer scale the different layers and also to investigate the behavior of
incorporated nano-objects such as liquid crystals12, liquid
mixtures13, polymer melts14 or polyelectrolytes15 (PEs). In particular the latter case of PE confinement is barely studied while it is of great interest for nanofluidic or biological applications as sequencing of DNA strands, designing pores for biosensors and selectivity properties16, filtration or chemical separation or for more fundamental aspects such as the
understanding of protein insertion17 and translocation into
biological membranes.
So far, duplex structures have been scarcely studied and were primarily characterized by direct imaging (Scanning
Electron Microscopy)9, 10 and interferometry techniques using
light radiation9, 15. Here we demonstrate that specular Neutron
Reflectivity (NR) is a powerful technique to extract quantitative information about the structure and composition of duplex nAAO and also provides information about the PE behavior in nanopores at the molecular level. Because of the use of short wavelengths and the fact that neutrons are strongly scattered by elements such as hydrogen (in contrast to X-rays), it makes NR very convenient to detect organic materials in multilayers
systems18. Herein we propose i) to characterize bare duplex
nAAO and ii) to gain more insights into the PE behavior in nanopores and in particular on the influence of the geometrical constriction present in duplex nAAO on the PE adsorption.
To perform NR on nAAO, a low roughness and strong adhesion of the sample on the substrate, such as Si wafer, is
required19. As previously observed, Al anodization on Si wafers
exhibits different structural characteristics than the anodized aluminum foils and greatly depends on the sputtered Al film
morphology tuned by the sputtering conditions20. Here duplex
nAAO have been synthesized through an
COMMUNICATION Journal Name
Fig. 1. (a) SEM images of duplex nAAO synthesized on Si wafer. (b) Zoom of the nAAO bottom revealing the inverted barrier layer (IBL). (c) Scheme of the duplex nAAO with the different characteristic sizes.
layer sputtered onto n-type Si wafer (5 mm thick and 2” in diameter) were purchased from ACM (Applications Couches Minces, Versailles, France). A first anodization is carried out in 0.3M oxalic acid under constant voltage (40 V) at a temperature of 18°C during 488 s. Then the nanopores are chemically etched by immersing the wafer in phosphochromic
solution (6% wt H3PO4 and 1.8% wt CrO3) during 2h45 at 20°C
in order to increase the pore size. Finally the porous nAAO is further anodized under the same previous conditions during 242 s until no Al is left (more synthesis details and current density versus time curves of the two anodizations are given in Fig. S1).
Fig. 1a shows the SEM image of the obtained duplex nAAO. Two connected porous layers (PLs) are clearly observed. The
top layer (PL1) is 850 nm thick with a Dp of 59 +/- 4 nm giving a
porosity of 33%. The bottom layer (PL2) is 320 nm thick with a
Dp of 32 +/- 5 nm giving a porosity of 9.6%. Note that the Dp of
both layers have been obtained from analysis of SEM section
images. The top surface Dp is 65 +/- 8 nm (slightly larger than
the PL1 diameter due to chemical etching during anodization),
the pore density is 1.2x10¹⁰ pores/cm2, the porosity is around
40 % and the interpore distance, Dint, is 88 nm (see Fig. S2). Dint
in the layers are 88+/-9 nm and 94+/-11 nm for PL1 and PL2, respectively. Since the anodizing conditions were the same for
the first and second anodizations, similar Dint are observed
indicating an uniform interface between layers. Fig. 1b shows a zoom of the alumina/Si interface revealing an inverted barrier layer (IBL) of around 25 nm consisting in voids beneath the pores separated by a thin alumina part, as typically observed
for anodization on substrate21, 22. It might originates from
mechanical stress pushing the barrier layer upward and
inducing a curvature inversion23, alumina dissolution due to
local temperature increase21 or oxygen bubbles formation22.
The bare duplex nAAO is then characterized by NR. NR is a convenient technique to access the thickness and the chemical composition of different layers at the surface of a substrate.
The composition is obtained through an important parameter named the scattering length density (SLD) that depends on the interaction between the neutron and the nature of the studied layers and expressed as follows:
SLD=rNa
M
å
i biwith ρ the density, Na the Avogadro number, M the molecular
weight and bi the scattering length of atom i of the layer. NR is
the only technique that can provide accurate experimental SLDs of the different layers without any hypothesis.
During a NR experiment a neutron beam is sent in grazing incidence (i.e. with a low incident angle) on the surface, then is reflected and/or refracted and finally monitored as a function of the scattering vector q. The ratio between the measured intensity and incident intensity in specular condition is called reflectivity, R. The Q dependency of this signal is directly related to the changes in refractive index in the sample along
the perpendicular direction to the surface24. These changes are
characterized by a SLD profile that can be extracted from the fitting of the NR curve. Detailed description of NR principle can be found in reviews 18 and 24. The NR experiments were performed on the HERMES time of flight reflectomer at Laboratoire Léon Brillouin (LLB, CEA Saclay, France) where a neutron pulse (having a large wavelength range from 2 to 22 Å) is sent at a given incident angle. Two angles were used (0.69° and 2°) to access the widest q range and two setup
geometries were employed: i) measurement in air (SLDair = 0):
the neutron beam is sent on the top of the nAAO and ii) measurement with a solvent: the neutron beam passes through the silicon wafer which is transparent to neutrons (SLDSi = 2.07 x10⁻⁶ Å-2). The layer thicknesses above 300 nm
cannot be measured due to instrumental resolution but, thanks to the low absorption cross section of alumina, multiple interfaces can be probed deep into the material down to the Si substrate, i.e. PL1/PL2, PL2/IBL and IBL/Si interfaces can be detected. An interface is defined by the gradual SLD changes between layers and the interfacial roughness is the thickness of this interface18.
Usually the NR is plotted in Rq4 representation to highlight
any features from the layer by compensating the q-4
asymptotic decay of the Fresnel reflectivity of Si/Air interface.
Fig. 2a shows the Rq4 representation of the duplex nAAO
measured in air with the fit. The NR fitting consists in describing the nAAO as a multilayer system. Each layer is defined by its thickness, SLD and interfacial roughness. The NR fitting is always a delicate process if no structural information is known from another technique, specifically for nAAO. Here we use the SEM images to define a three-layer model: one porous layer with high porosity (PL1), one porous layer with low porosity (PL2) and an IBL supported by Si substrate. Some NR parameters are fixed to the SEM value such as the thicknesses of the two PLs (857 nm and 323 nm respectively).
Duplex structure PL1 850 nm P = 33% PL2 320 nm P = 9.6% IBL (25 nm) IBL PL1 PL2 32 nm 59 nm a b c 65 nm Si constriction
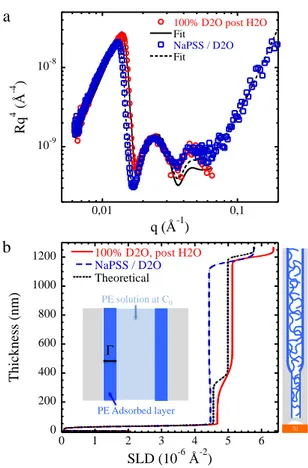
Fig. 2. (a) NR curve in Rq4 representation for the duplex nAAO measured in air. In insert is shown the R=f(q) representation. The continuous black line corresponds to the best fit based on a three layers model described in the top scheme (χ2=0.58). (b) SLD profile obtained from the NR fit.
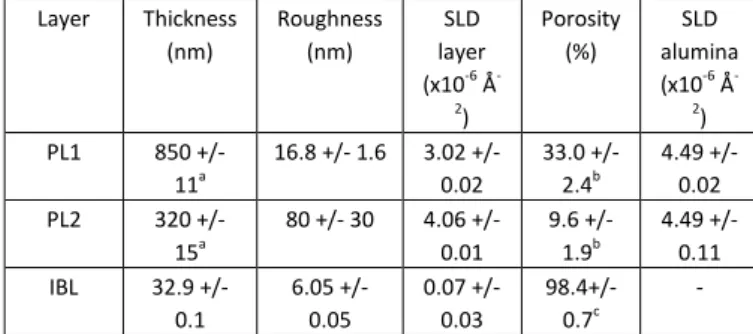
Layer Thickness (nm) Roughness (nm) SLD layer (x10-6 Å -2 ) Porosity (%) SLD alumina (x10-6 Å -2 ) PL1 850 +/- 11a 16.8 +/- 1.6 3.02 +/- 0.02 33.0 +/- 2.4b 4.49 +/-0.02 PL2 320 +/- 15a 80 +/- 30 4.06 +/- 0.01 9.6 +/- 1.9b 4.49 +/-0.11 IBL 32.9 +/- 0.1 6.05 +/- 0.05 0.07 +/- 0.03 98.4+/-0.7c -
Table 1. Results from the fitting of the NR of duplex nAAO in air. a These values were fixed during the NR fitting to the ones obtained in SEM. The Si substrate SLD was fixed to 2.07x10⁻⁶ Å-2. b from SEM. c Calculated using the IBL SLD.
The IBL thickness, the SLDs and the interfacial roughnesses of the three layers are fitting parameters. The data fitting was performed using the optical matrix method with the Motofit
program25 in which the instrumental resolution is also taken
into account and the best fit was determined by minimization
of the least- squares χ2 and subsequent visual validation. Table
1 presents the different parameters of the model. The best fit (χ2 = 0.58) gives a SLD of PL1, PL2 and IBL of 3.02 x10⁻⁶ Å-2, 4.06 x10⁻⁶ Å-2 and 0.07x10⁻⁶ Å-2, respectively. Note that the fit is mostly sensitive to the IBL layer and PL2 SLD. Fig. 2b shows the corresponding SLD profile from which the difference in porosities along the nAAO is evidenced. The geometrical constriction, characteristic of the duplex nAAO, is also probed with an extent of 160 +/- 60 nm (twice the PL2 roughness) with a large error bar due to the non-sensitivity of the fit to this
parameter. Most interestingly, from the layers SLDs and the porosity known from SEM, the SLD of alumina can be determined with good accuracy: 4.49+/-0.02 and 4.49+/-0.11
x10-6 Å-2 for PL1 and PL2 respectively. Such direct
determination is only possible with NR and provides information about the nAAO layer chemical compositions. Pure
amorphous Al2O3 with a density of 3.4 g.cm-3 has an expected
SLD of 4.89 x10⁻⁶ Å-2, slightly larger than our values. It is well known that nAAO are hydrated and contain some anion impurities coming from the electrolyte used during the anodization (here oxalates), modifying the density, the chemical compositions and thus the SLD. Finally, the thickness of the IBL is 32.9 nm with a roughness of 6.0 nm, in good agreement with the SEM estimation and has a SLD close to air (SLDIBL = 0.07 x10⁻⁶ Å-2) indicating that this layer is highly
porous.
Since several SLD profile might fit the same NR data, NR measurements using several neutron contrasts were
performed using different H2O/D2O mixtures: 100% D2O
(SLD=6.39x10⁻⁶ Å-2), 38% D2O (SLD=2.07x10⁻⁶ Å-2) and 100%
H2O (SLD=-0.56 x10⁻⁶ Å-2) to confirm the SLD profile obtained in
air. The NR curves are directly simulated using the parameters in air and compared to the experimental data. Assuming that the alumina chemical composition remains unchanged, the
layer SLDs were fixed and calculated using the SLDalumina
determined in air and the layer porosity P as:
The other parameters of the model (thicknesses and interfacial roughness) were all fixed to the values obtained in air (see Table 1). Fig. 3 presents the NR curves with the corresponding simulations. Without any fitting adjustments the NR data can
be nicely reproduced with a low χ2=15.72, 4.03 and 15.16 for
100% D2O, 38% D2O and 100% H2O respectively, confirming
unambiguously the profile obtained in air. Moreover, since the
nAAO might transform in contact with water26, a post-H2O NR
measurement was then performed in 100% D2O. The SLD
profile is similar to the first measurement in D2O (χ2=2.22, the
Rq4 curves are shown in Fig. S3), indicating that no chemical transformation occurred within the timescale of the different NR measurements, validating our previous hypothesis of no measurable transformation in water. We thus clearly demonstrate that NR is a powerful technique to investigate the structure and composition of duplex nAAO.
To further evidence the NR efficiency on these systems, we propose to study by NR the behavior of polyelectrolytes (PE) in duplex nAAO. Sodium polystyrene sulfonate (NaPSS 70 kDa
purchased from Sigma Aldrich) solution was prepared in D2O
(C0=206.4 g/L (≈ 11% v/v), i.e. within the semi-dilute entangled
regime with a correlation length ξdetermined by Small-Angle
Neutron Scattering of 3.5 nm, a Debye lengthκ-1 of 0.3 nm,
and a SLD of 5.77x10⁻⁶ Å-2) and deposited on top of the duplex
nAAO and sealed in a hermetic cell preventing solvent evaporation. NR measurement was performed 30 min after PE deposition.
Fig. 4a shows the Rq4 NR of the duplex nAAO filled with the
NaPSS solution compared to the bare duplex nAAO.
0 200 400 600 800 1000 1200 -1 0 1 2 3 4 T h ic k n es s (n m ) SLD (10-6 Å-2) 10-10 10-9 10-8 10-7 0,01 0,1 Air Fit R q 4 ( Å -4 ) q (Å-1 )
a
b
Air PL1 Si Neutrons IBL PL2 SiCOMMUNICATION Journal Name
Fig.3. NR curve in Rq4 representation for the duplex nAAO measured in different H2O/D2O mixtures (100% D2O, 38% D2O and 100% H2O). The black lines correspond to the modelling results using a three layers model. All parameters were fixed to the values obtained in air.
Since the PE entering will affect the composition of the layers and might adsorb on top of the pores, the only fitting parameters were the layer SLDs of PL1 and PL2 and the roughness of the PL1/solution interface. The others parameters were fixed. The best fit (χ2=1.97) is shown in Fig. 4a and Table 2 presents the results. First, the top interfacial roughness increases from 16.8 to 24.7 nm. This difference is around 8 nm, which is close to the radius of gyration (Rg) of
the PE, and can be due to possible plugging or PE adsorption15.
Then, the obtained layers SLDs are lower than the expected theoretical ones if we assume that the PE partitioning K = Cin/C0, (Cin being the concentration in the pores) is 127 (in that
case χ2=2.78), suggesting that the PE volume fraction inside
the pores is higher than in the bulk solution (Fig. 4b). Knowing the nAAO porosities P, one can calculate the SLD of the solution inside the pores, SLDin:
With these SLD values, a partitioning K of 3.44 and 3.48 is found for PL1 and PL2 respectively. Since the nAAO are
positively charged in pure water (pH = 6)28 and NaPSS is
negatively charged, attractive interaction occurs. The SLDlayer
decrease compared to the theoretical one can be interpreted by the presence of an adsorbed layer inside the pores. The PE adsorbs on the surface, increasing the PE concentration inside the pore compared to the outside bulk solution. In the
following, we propose to use the SLDlayer extracted from the fit
to estimate the surface excess Γ of this adsorbed layer. The
SLDin can be decomposed into two contributions as depicted in
Fig. 4b: one from the adsorbed PE and one from a PE solution taken at C0 (i.e. assuming K =1) as:
SLDin=fadsSLDPSS+(1-fads)SLDPEsolution
with ϕads the volume fraction of adsorbed chains in the pores
and SLDPE solution the SLD of the non adsorbed solution (=
5.77x10⁻⁶ Å-2). Note that the PE volume fraction inside the
Fig. 4. (a) NR curve in Rq4 representation for the duplex nAAO measured in 100% D2O without NaPSS (red circles) and with NaPSS (blue squares). The black lines correspond to the best fits. (b) SLD profile obtained from the NR fit. The theoretical SLD corresponds to the profile obtained if we assume K = 1. Insert: schemes of the PE adsorption model. Layer SLD layer (x10-6 Å-2) Roughness (nm) SLDin (x10-6 Å-2) ϕads in pore Γ (nm) PL1 4.43+/-0.01 24.7+/-0.8 4.27 0.52 9.0 PL2 4.47+/-0.02 80* 4.25 0.53 5.0
Table 2. Results from the NR fitting of duplex nAAO filled with NaPSS solution. * This value was fixed during the NR fitting.
pores is similar for PL1 and PL2 suggesting that the geometrical constriction doesn’t prevent the PE penetration and adsorption, consistent with theoretical work on concentrated neutral polymer penetration where the polymer entering is
controlled by the characteristic size ξ27, which is here smaller
than Dp. From ϕads, the surface excess Γ of the adsorbed layer
can be then calculated as:
G=Rpéë1-(1-
f
ads)1/2ùûwith Rp the pore radius. One finds Γ of 9.0 nm and 5.0 nm for
PL1 and PL2 respectively. The surface excess is smaller in PL2 suggesting that the pore reduction might control the amount of adsorbed PE but a more systematic study, which is beyond the scope of this paper, is necessary to investigate the exact role of the constriction in this observation.
10-10 10-9 10-8 0,01 0,1 100% D2O Fit 38% D2O Fit 100% H2O Fit R q 4 ( Å -4 ) q (Å-1 ) (c2=15.72) (c2=4.03) (c2=15.16) Solvent PL1 Si Neutrons IBL PL2 SLDin= SLDlayer-(1-P)SLDalumin a P 0 200 400 600 800 1000 1200 0 1 2 3 4 5 6
100% D2O, post H2O NaPSS / D2O Theoretical T h ic k n es s (n m ) SLD (10-6 Å-2)
a
b
PE Adsorbed layer PE solution at C0 10-9 10-8 0,01 0,1100% D2O post H2O Fit NaPSS / D2O Fit R q 4 ( Å -4 ) q (Å-1 ) Γ Si
Conclusions
In this paper we demonstrate that NR is a powerful technique to successfully investigate the structure of duplex nAAO and its composition since it allows direct SLD determination. NR can also detect any changes in SLD profile due to the incorporation of nano-objects into duplex nAAO. To illustrate it we investigate the PE behavior in duplex nAAO and interpreted our NR results by the PE adsorption in the nanopores and the adsorbed layer surface excess can be estimated from NR SLDs. Finally this work shows that NR can be used, through SLDs determination, to quantify PE entering and adsorption and can be further extended to lower C0 and to different geometrical
constriction (smaller in size, ordered or disordered interfaces between layers10…).
Conflicts of interest
There are no conflicts to declare.
Acknowledgements
The authors thank LLB for beam time allocation and Didier Lairez for his help during the NR experiments. David Montero is also thanked for his help during SEM sessions. Semfeg instrumentation was provided by the Institut des Matériaux de Paris Centre (IMPC FR2482) and was funded by UPMC, CNRS and by the C’Nano projects of the Région Ile-de-France.
References
1. K. Xiao, L. Wen and L. Jiang, Small, 2016, 12, 2810-2831. 2. C. T. Sousa, D. C. Leitao, M. P. Proenca, J. Ventura, A. M. Pereira and J. P. Araujo, Applied Physics Reviews, 2014, 1, 031102.
3. V. Romero, M. I. Vázquez, S. Cañete, V. Vega, J. García, V. M. Prida, B. Hernando and J. Benavente, The Journal of Physical Chemistry C, 2013, 117, 25513-25518.
4. H. Masuda and K. Fukuda, Science, 1995, 268, 1466-1468. 5. W. Lee and S. J. Park, Chemical Reviews, 2014, 114, 7487-7556.
6. W. Lee, J.-C. Kim and U. Gösele, Advanced Functional Materials, 2010, 20, 21-27.
7. D. Losic and M. Lillo, Small, 2009, 5, 1392-1397.
8. R. Krishnan and C. V. Thompson, Advanced materials, 2007,
19, 988-992.
9. F. Casanova, C. E. Chiang, C.-P. Li and I. K. Schuller, Applied Physics Letters, 2007, 91, 243103.
10. L. Bruschi, G. Mistura, P. Phadungbut, D. D. Do, D. Nicholson, Y. Mayamei and W. Lee, Langmuir, 2015, 31, 4895-4905.
11. G. Mistura, L. Bruschi and W. Lee, Journal of Low Temperature Physics, 2016, 185, 138-160.
12. C. V. Cerclier, M. Ndao, R. Busselez, R. Lefort, E. Grelet, P. Huber, A. V. Kityk, L. Noirez, A. Schonhals and D. Morineau, Journal of Physical Chemistry C, 2012, 116, 18990-18998.
13. R. Lefort, J.-L. Duvail, T. Corre, Y. Zhao and D. Morineau, The European Physical Journal E, 2011, 34, 1-7.
14. L. L. Li, D. S. Zhou, D. H. Huang and G. Xue, Macromolecules, 2014, 47, 297-303.
15. T. D. Lazzara, K. H. A. Lau, A. I. Abou-Kandil, A.-M. Caminade, J.-P. Majoral and W. Knoll, ACS Nano, 2010, 4, 3909-3920.
16. M. Ali, B. Yameen, J. Cervera, P. Ramírez, R. Neumann, W. Ensinger, W. Knoll and O. Azzaroni, J. Am. Chem. Soc, 2010,
132, 8338-8348.
17. L. Javidpour, M. R. R. Tabar and M. Sahimi, The Journal of Chemical Physics, 2009, 130, 085105.
18. F. Cousin and A. Menelle, EPJ Web of Conferences, 2015,
104, 01005.
19. N. P. Hu, X. C. Dong, X. Y. He, S. Argekar, Y. Zhang, J. F. Browning and D. W. Schaefer, Journal of Applied Crystallography, 2013, 46, 1386-1396.
20. A. F. Feil, M. V. da Costa, L. Amaral, S. R. Teixeira, P. Migowski, J. Dupont, G. Machado and S. B. Peripolli, Journal of Applied Physics, 2010, 107, 026103.
21. D. Crouse, Y.-H. Lo, A. Miller and M. Crouse, Applied Physics Letters, 2000, 76, 49-51.
22. S. Z. Chu, K. Wada, S. Inoue and S. Todoroki, Journal of the electrochemical Society, 2002, 149, B321-B327.
23. H.-S. Seo, Y.-G. Jung, S.-W. Jee, J. M. Yang and J.-H. Lee, Scripta Materialia, 2007, 57, 968-971.
24. J. Penfold and R. Thomas, Journal of Physics: Condensed Matter, 1990, 2, 1369.
25. A. Nelson, Journal of Applied Crystallography, 2006, 39, 273-276.
26. X. Carrier, E. Marceau, J.-F. Lambert and M. Che, Journal of Colloid and Interface Science, 2007, 308, 429-437.
27. S. Daoudi and F. Brochard, Macromolecules, 1978, 11, 751-758.
28. B. J. Pedimonte, T. Moest, T. Luxbacher, C. von Wilmowsky, T. Fey, K. A. Schlegel and P. Greil, Acta biomaterialia, 2014, 10, 968-974.