HAL Id: hal-02401592
https://hal-amu.archives-ouvertes.fr/hal-02401592
Submitted on 6 Apr 2020
HAL is a multi-disciplinary open access archive for the deposit and dissemination of sci-entific research documents, whether they are pub-lished or not. The documents may come from teaching and research institutions in France or abroad, or from public or private research centers.
L’archive ouverte pluridisciplinaire HAL, est destinée au dépôt et à la diffusion de documents scientifiques de niveau recherche, publiés ou non, émanant des établissements d’enseignement et de recherche français ou étrangers, des laboratoires publics ou privés.
Impact of precipitation, air temperature and abiotic
emissions on gross primary production in Mediterranean
ecosystems in Europe
S. Bartsch, A. Stegehuis, C. Boissard, J. Lathiere, J.-Y. Peterschmitt, I.
Reiter, T. Gauquelin, Virginie Baldy, L. Genesio, G. Matteucci, et al.
To cite this version:
S. Bartsch, A. Stegehuis, C. Boissard, J. Lathiere, J.-Y. Peterschmitt, et al.. Impact of precipitation, air temperature and abiotic emissions on gross primary production in Mediterranean ecosystems in Eu-rope. European Journal of Forest Research, Springer Verlag, 2020, 139, pp.111-126. �10.1007/s10342-019-01246-7�. �hal-02401592�
Impact of precipitation, air temperature and abiotic emissions
on gross primary production in Mediterranean ecosystems in Europe
S. Bartsch1 · A. I. Stegehuis1,2 · C. Boissard1,3 · J. Lathière1 · J.‑Y. Peterschmitt1 · I. M. Reiter4 · T. Gauquelin5 · V. Baldy5 ·
L. Genesio6 · G. Matteucci7 · C. Fernandez5 · B. Guenet1
Abstract
Mediterranean ecosystems are significant carbon sinks and are particularly sensitive to climate change. However, the carbon dynamics in such ecosystems are still not fully understood. An improved understanding of the drivers of carbon fixation by vegetation is needed to better predict how these ecosystems will respond to climate change. In this study, a large dataset collected through the FLUXNET network is used to estimate how the gross primary production (GPP) of different Medi-terranean ecosystems was affected by air temperature and precipitation between 1996 and 2013. We showed that annual precipitation and temperature were not significant drivers of annual GPP. However, inter-annual variations of GPP seemed largely controlled by the precipitation during early spring (March–April). Late spring and early summer temperature also had a positive effect on annual GPP. We furthermore show that GPP may also have been influenced by both summer rainfall pulses and abiotic emissions due to carbonates precipitation/dissolution. Finally, the sensitivity of GPP in the Mediterra-nean region to climate drivers seemed not to be ecosystem-type dependent. Our results can provide general information for modeling exercises and improve future biomass projections on a regional scale.
Keywords Growth primary production · Mediterranean ecosystems · FLUXNET · Climate
Introduction
Mediterranean land ecosystems are of particular interest for ecological research because their outstanding biodiversity is one of the most diverse after that of the tropical regions
(Cowling et al. 1996). This remarkable diversity is due to a combination of biogeographical and environmental fac-tors (e.g., soil types, precipitation and temperature), but also to human activities that have been present for millennia (Lavorel et al. 1998; Rey Benayas and Scheiner 2002). It has been hypothesized that these ecosystems could be severely affected by global climate change in the future. This includes the modification of temperature and precipitation regimes, with possibly longer periods of drought, heavier rainfall events and increased summer temperatures (Giorgi and
* B. Guenet
Bertrand.Guenet@lsce.ipsl.fr
1 Laboratoire des Sciences du Climat et de l’Environnement,
LSCE/IPSL, CEA-CNRS-OVSQ, Université Paris-Saclay, 91191 Gif-sur-Yvette, France
2 Peking University Shenzhen Graduate School, School
of Urban Planning and Design, Shenzhen Key Laboratory of Circular Economy, Shenzhen 518055, China
3 Université de Paris, 75013 Paris, France
4 Fédération de Recherche Ecosystèmes Continentaux et
Risques Environnementaux CNRS FR3098 ECCOREV, Domaine du Petit Arbois Avenue Louis Philibert, Bâtiment du CEREGE, BP 80, 13545 Aix-en-Provence Cedex 04, France
5 CNRS, IRD, IMBE (Institut Méditerranéen de Biodiversité et
d’Ecologie marine et continental), Aix Marseille Université, Avignon Université, 3 Place Victor Hugo, 13331 Marseille, France
6 Institute of BioEconomy (IBE), National Research Council
(CNR), Via Caproni 8, 50145 Florence, Italy
7 Institute for Agricultural and Forestry Systems
in the Mediterranean (ISAFoM), National Research Council of Italy (CNR), Via Patacca 85, 80056 Ercolano, NA, Italy
Lionello 2008; Hertig and Jacobeit 2008; Polade et al. 2014; Dubrovsky et al. 2014). CO2 increase may also become an
important driver of species distribution within these regions (Keenan et al. 2011). Mediterranean ecosystems supply numerous ecosystem services to people such as water clean-ing and flood protection and are also actclean-ing as carbon sinks, with a carbon uptake that is slightly lower than other Euro-pean forest types (Janssens et al. 2003). For instance, Vay-reda et al. (2012) and Pereira et al. (2007) observed a mean net ecosystem exchange (NEE) of 1.4 Mg C ha−1 yr−1 in a
Spanish and Portuguese forest and of 1.9 Mg C ha−1 yr−1 for
a grassland in Portugal, while an average NEE of 2.7 Mg C ha−1 yr−1 was found for forest ecosystems from the
EURO-FLUX network throughout Europe (Janssens et al. 2003). Over the last decade, considerable effort has been made to investigate the effect of precipitation and air tempera-ture on biomass production on several different ecosystems (Valladares et al. 2008; Goerner et al. 2009). So far, how-ever, most of this research was carried out using single site experiments (e.g., rain exclusion–Limousin et al. 2009, 2010; Martin-StPaul et al. 2013) or using only a few sites with a single ecosystem type (Reichstein et al. 2002). Con-sequently, contrasting results are reported in the literature. For instance, Reichstein et al. (2002) observed a high sensi-tivity to drought for three Mediterranean evergreen forests (two dominated by Quercus ilex L. and one by Juniperus
phoenicea L.) whereas Grünzweig et al. (2008) reported that
another Mediterranean species (Quercus calliprinos Webb) was not affected by drought. Sabaté et al. (2002) pointed out that Mediterranean oak forests (Quercus ilex) were particularly sensitive to summer drought, whereas Allard et al. (2008) observed an absence of response to summer drought for another Mediterranean oak forest also composed by Quercus ilex. Moreover, Maselli (2004) suggested that spring precipitation is the most important factor controlling inter-annual variations of vegetation stress. These results highlight the importance of taking the distribution of pre-cipitation within a year into account, rather than the annual sum. Our results also underline the species-specific response to climate drivers. This response to climate drivers there-fore results in an ecosystem response that depends on the floristic composition (Baldocchi et al. 2004, 2010; Forner et al. 2018).
To allow broader conclusions, satellite monitoring of nor-malized difference vegetation index (NDVI) has been used (Maselli et al. 2014). However, the link between a vegetation index and gross primary production (GPP) is not straight-forward and there is a substantial spread between different satellite products (Garrigues et al. 2008). Moreover, satellite data generally do not provide long-term information with high temporal resolution like site studies do. Thus, to allow broader conclusions over the Mediterranean region, studies with a long temporal scale and a large spatial distribution
are needed. Furthermore, the effect of annual or seasonal precipitation on primary production is generally addressed, but without taking extreme events into account that may sub-stantially impact primary production, particularly in Medi-terranean ecosystems (Zhang et al. 2013). Finally, carbonate soils are common in parts of the Mediterranean area (Dürr et al. 2005) and may influence GPP measurements through abiotic emissions (e.g., Hao et al. 2013), but are not often accounted for (e.g., Schulze et al. 2009). Abiotic emissions are the results of the carbonates formation and dissolution which may fix or emit CO2, and omitting such fluxes may
lead to errors in GPP estimation (Serrano-Ortiz et al. 2009). Another source of error for GPP is the emission of biogenic volatile organic compounds (BVOCs) that may represent a significant fraction of the GPP (Seco et al. 2017) and is gen-erally ignored in the GPP estimation (Papale et al. 2006).
Thus, the understanding of climate drivers of GPP in Mediterranean ecosystems is still suffering from caveats because, up to now, it has been based only on a few sites or on satellite data. To our knowledge, no other study has inves-tigated the impact of annual and seasonal precipitation and air temperature on the primary production of Mediterranean ecosystems using a large collection of sites under different climatic conditions and covering different vegetation types, furthermore taking abiotic emissions and dry season rainfall pulses into account. Model projections yet indicate that the Mediterranean region will be strongly affected by future cli-mate change (Giorgi and Lionello 2008; Polade et al. 2014; Guiot and Cramer 2016). This makes the Mediterranean region one of the most vulnerable regions to climate change worldwide (Nissen et al. 2014). In this context, understand-ing the response of Mediterranean ecosystems to changes in temperature and precipitation is of a major importance and it is essential to provide information for modeling exercises to improve future biomass projections on a regional scale. The main goal of this study is to identify the impact of annual and seasonal precipitation (PPT) and air temperature (T) on GPP throughout the European Mediterranean region, based on a multi-sites analysis and considering abiotic emissions effect on GPP estimation.
Materials and methods
Dataset and site selectionWe used the FLUXNET database (http://www.fluxd ata. org), which contains flux measurements (CO2, water, etc.)
based on the eddy covariance method (Baldocchi et al. 2001) and meteorological measurements at a high temporal reso-lution (up to 30-min intervals) for a time period which is site dependent (from few years to few decades). The data-base covers more than 500 registered sites worldwide and
is partly freely available under a fair-use policy. All data provided by the international FLUXNET network are pro-cessed according to standardized formats and data process-ing protocols (Reichstein et al. 2005; Papale et al. 2006; Moffat et al. 2007).
In this study, we used level 4 data (L4, 30 min time steps) of GPP, NEE, PPT, T, latent heat flux (LE), sensible heat flux (H) and soil water content (SWC) and level 3 data (L3, 30 min time steps) of wind speed (WS) from the La Thuile collection (see also https ://fluxn et.fluxd ata.org/data/la-thuil e-datas et/). Level 3&4 share the same data collection proto-col but group different variables. We selected sites that are located within the Mediterranean region with the follow-ing vegetation types: shrubs (S), deciduous broadleaf trees (DBT), evergreen needle leaf trees (ENT) and evergreen broadleaf trees (EBT). To increase statistical power, we did not consider the details floristic composition as an explain-ing factor but we grouped the site usexplain-ing the four vegetation types described previously. Nevertheless, dominant species are provided in the supplementary material (Table S2). We
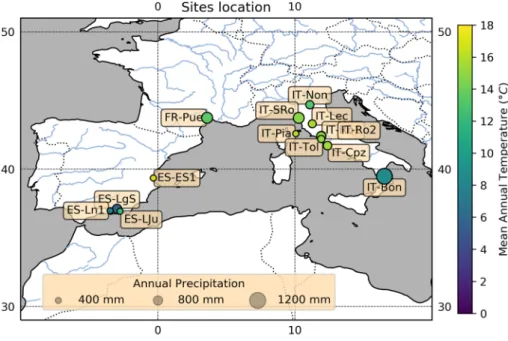
only focused on the European region (Table S1, Fig. 1). From the site-year files, we calculated the annual mean and sum of GPP, PPT and T for each site and for each year. We also included the corresponding vegetation types in our anal-ysis. To be able to investigate the impact of the sub-annual variability, we split the year into six parts using a bimonthly time step [January & February (JF), March & April (MA), May & June (MJ), July & August (JA), September & Octo-ber (SO), NovemOcto-ber & DecemOcto-ber (ND)] (cf. Table 1 subset S0–S6). We only considered the site-year files where at least 90% of the data per year or bimonthly time step were avail-able. We choose a bimonthly time step to be as integrative as possible over a season. Choosing a seasonal time step would have induced a large reduction of the dataset, and it would have been difficult to reach the 90% threshold fixed above. Furthermore, we only took sites that had no heavy manage-ment practices or major disturbances during the years of study (Table S2) into consideration. This selection process resulted in 15 sites in three different countries (France, Italy and Spain) as presented in Table S1 and in Fig. 1. The total
Fig. 1 Map of the distribution of sites used in the current study
Table 1 Annual and bimonthly subsets
ID Subset descrip on S0 mean annual (Jan.-Dec.) PPT and T S1 mean JF (Jan. & Feb.) PPT and T S2 mean MA (Mar. & Apr.) PPT and T S3 mean MJ (May & Jun.) PPT and T S4 mean JA (Jul. & Aug.) PPT and T S5
S6 mean SO (Sept. & Oct.) PPT and Tmean ND (Nov. & Dec.) PPT and T
(A) Impact on average annual GPP (B) Impact on total annual GPP (sum) (C) Impact on average seasonal GPP
PPT, precipitation; T, air temperature
Note that for the early winter (ND) subset we studied the impact of the PPT and T on the average annual GPP of the subsequent year rather than on the actual year
number of sites and site years can be found in Table 2 (1. No filter), rows 4 and 5, respectively.
Data filters
Two data filters were applied to all the sites before carrying out the statistical analysis to try to isolate the effect of mete-orological variables on GPP and avoid the impact of other abiotic processes that could possibly affect our results. GPP is not directly measured but estimated from net ecosystem exchange (NEE) and total ecosystem respiration measured overnight. NEE can be partially driven by abiotic processes inducing a bias in GPP estimations. Therefore, data filter-ing is generally recommended (Serrano-Ortiz et al. 2009). The first filter concerns abiotic emissions (Serrano-Ortiz et al. 2009; Sanchez-Cañete et al. 2011), and the second deals with rain events (e.g., Schwinning and Sala 2004). It is important to note that such filters are used to exclude days with environmental conditions favorable to abiotic emissions but cannot be used to directly estimate those abiotic fluxes.
Abiotic emissions can occur in certain ecosystems on carbonate soils and may influence NEE substantially (e.g., Kowalski et al. 2008). These soils can store in macropores large amounts of carbon that can be released to the atmos-phere by subterranean ventilation during dry weather con-ditions that mostly occur during the summer season (Kow-alski et al. 2008). The data filter is based on the research of Serrano-Ortiz et al. (2009) and Sánchez-Cañete et al. (2016). The first step separates ‘abiotic’ from ‘biological’ periods, as defined by Serrano-Ortiz et al. (2009) and fil-ters out the abiotic days from the data. Serrano-Ortiz et al. (2009) describe abiotic periods during the dry season with a soil water content (SWC) below 15% and a mean daytime Bowen ratio higher than 4. Biological periods have a mean daily Bowen ratio smaller than 4 and a daily average air temperature higher than 4 °C (Serrano-Ortiz et al. 2007, 2009). The second step involves wind speed and filters out ‘windy’ days, as defined by Sánchez-Cañete et al. (2016), with a wind speed higher than 0.5 m s−1. They found that
large amounts of carbon dioxide from below-ground storage were emitted to the atmosphere especially on windy days. This summarizes the first filter as:
1.1 Daily mean of ‘H/LE’ > 4; AND Daily mean of ‘SWC’ < 15%; AND 1.2 Daily mean WS > 0.5 m s−1
These days are left out of our analyses as the response of GPP (annual or bimonthly) may be mostly due to abiotic processes rather than being a biological response of the eco-system. Please refer to Table 2 (2. Rainfall filter) for the number of sites and site years left after the application of this filter (rows 4 and 5, respectively).
The second filter concerns rainfall pulses during the sum-mer season. These pulses have the ability to release large amounts of carbon from the soil (e.g., Unger et al. 2010; Hao et al. 2013; López-Ballesteros et al. 2015) and may therefore cause a miss-representation in the estimations of the GPP. To define the threshold value, we made a frequency distribution of the daily precipitation values from May to October (Schwinning and Sala 2004). We set this daily threshold value at 5 mm day−1, which occurs at 50% of the
days (Table S3). This summarizes as follows: 2. Daily mean precipitation > 5 mm
These days were excluded from our analyses for the same reason as the abiotic periods, i.e., the response in GPP may be caused by other processes than photosynthesis. The total number of sites and site years left after applying this filter can be found in Table 2 (3. Abiotic emissions filter), rows 4 and 5 respectively. We also tested the sensitivity of the daily precipitation threshold values of 75% (13 mm), 90% (25 mm) and 95% (37 mm), excluding only the 25%, 10% and 5% days with the largest rainfall pulses, respectively.
We performed the analyses with and without both filters to study the impact of subterranean ventilation and rainfall pulses during the summer in addition to the effect of tem-perature and precipitation on GPP.
Statistical methods
The statistical analyses were performed with RStudio (ver-sion 0.99.473, 2009–2015 RStudio). We first performed principal component analysis (PCA) to explore the data-set. Then, the impact of annual and seasonal PPT and T on annual and seasonal GPP was tested using nested ANOVA, with annual or seasonal GPP as variable to be explained and annual and seasonal PPT and T as explaining vari-ables. Each variable was calculated per site and per year. The sites and vegetation types were nested, which enabled us to take potential site- and vegetation-dependency effects into account. Because of non-normality that was not solved with classical transformation, data were rank-transformed before the analyses. This approach allowed us to use pow-erful parametric tools when application conditions are not respected (Conover and Iman 1981). This has already suc-cessfully been done in previous biogeochemistry studies (e.g., Guenet et al. 2014).
We tested seven different subsets (Table 1, S0–S6). We first investigated if the annual mean PPT and T significantly affected the annual mean GPP (Table 1, S0, case A). Then, we analyzed the annual GPP using the bimonthly mean, cal-culated per site and per year over the corresponding period, instead of annual mean PPT and T values (Table 1, S1–S6, case A). Note that we investigated the impact of PPT and
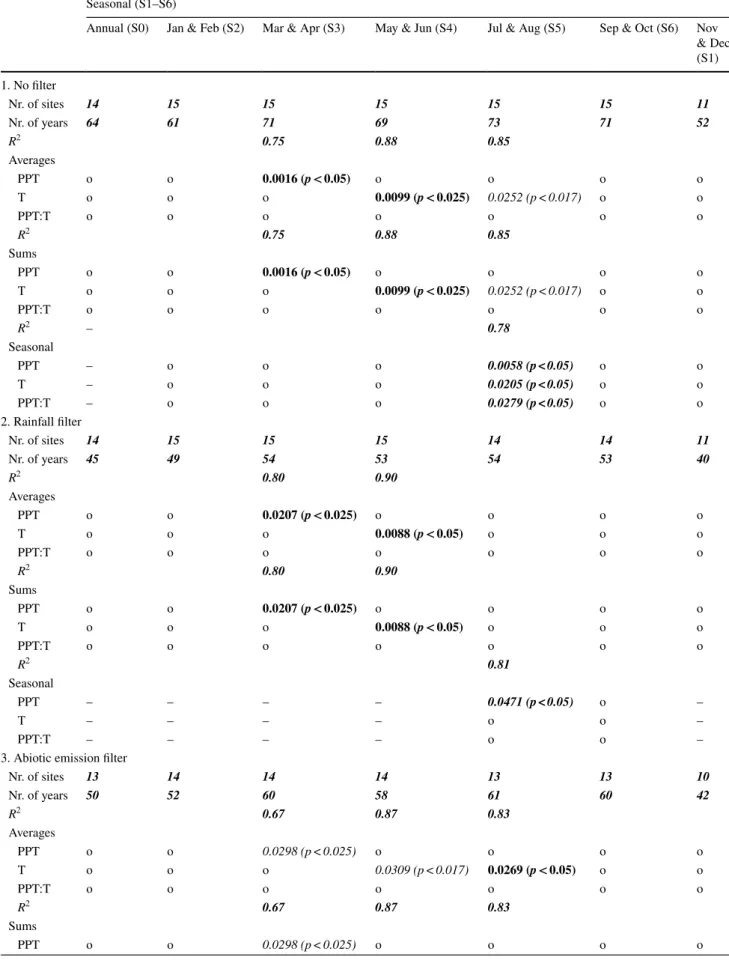
Table 2 Results of the statistical analysis using vegetation and site as random factors Seasonal (S1–S6)
Annual (S0) Jan & Feb (S2) Mar & Apr (S3) May & Jun (S4) Jul & Aug (S5) Sep & Oct (S6) Nov & Dec (S1) 1. No filter Nr. of sites 14 15 15 15 15 15 11 Nr. of years 64 61 71 69 73 71 52 R2 0.75 0.88 0.85 Averages PPT o o 0.0016 (p < 0.05) o o o o T o o o 0.0099 (p < 0.025) 0.0252 (p < 0.017) o o PPT:T o o o o o o o R2 0.75 0.88 0.85 Sums PPT o o 0.0016 (p < 0.05) o o o o T o o o 0.0099 (p < 0.025) 0.0252 (p < 0.017) o o PPT:T o o o o o o o R2 – 0.78 Seasonal PPT – o o o 0.0058 (p < 0.05) o o T – o o o 0.0205 (p < 0.05) o o PPT:T – o o o 0.0279 (p < 0.05) o o 2. Rainfall filter Nr. of sites 14 15 15 15 14 14 11 Nr. of years 45 49 54 53 54 53 40 R2 0.80 0.90 Averages PPT o o 0.0207 (p < 0.025) o o o o T o o o 0.0088 (p < 0.05) o o o PPT:T o o o o o o o R2 0.80 0.90 Sums PPT o o 0.0207 (p < 0.025) o o o o T o o o 0.0088 (p < 0.05) o o o PPT:T o o o o o o o R2 0.81 Seasonal PPT – – – – 0.0471 (p < 0.05) o – T – – – – o o – PPT:T – – – – o o –
3. Abiotic emission filter
Nr. of sites 13 14 14 14 13 13 10 Nr. of years 50 52 60 58 61 60 42 R2 0.67 0.87 0.83 Averages PPT o o 0.0298 (p < 0.025) o o o o T o o o 0.0309 (p < 0.017) 0.0269 (p < 0.05) o o PPT:T o o o o o o o R2 0.67 0.87 0.83 Sums PPT o o 0.0298 (p < 0.025) o o o o
T on the average annual GPP of the subsequent year rather than on the current year for the ND subset, because at this time of the year the current climatic factors hardly control the total growing strength of the current year (Table 1). In a next step, all tests were repeated using the total annual and bimonthly sum, instead of mean values for GPP and PPT (Table 1, S0–S6, case B). All the variables were calculated per site and per year. In the bimonthly case, only the data from the corresponding period were considered for the cal-culation of the mean value. As we applied several hypoth-eses on one single dataset, we faced the problem of multiple comparisons minimizing the probability of receiving a Type I error (i.e., the rejection of a true null hypothesis). Accord-ingly, we corrected the original significance level (p = 0.05) by applying the Holm–Bonferroni method (Holm 1979). In a last step, we investigated if the PPT and T of specific sea-sons (bimonthly time periods, both the sum and the average) significantly affected the GPP of the corresponding seasons (Table 1, S1–S6, case C). In the latter case, applying the Holm–Bonferroni method was not necessary as we used an independent dataset for every season and subset.
To interactively explore which predictors provided a good fit, we applied a stepwise regression in all cases, which con-ducts an automatic stepwise model selection by the (AIC) Akaike information criterion.
Results
Inter‑annual GPP variability
Over the selected sites, the vegetation faces a typical Medi-terranean climate, with usually hot and dry summers as well
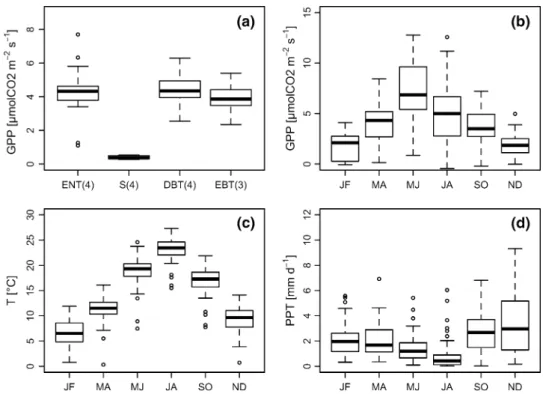
as mostly mild and moist winters (Fig. 2c–d). Temperature ranged from − 0.25 (in January–February) to 27.4 °C (in July–August) (Fig. 2c, bimonthly averages) and the seasonal PPT from 0.02 (in July–August) to 13.2 mm d−1 (in
Novem-ber–December) (Fig. 2d, bimonthly averages). For the dif-ferent forest types (ENT, DBT, EBT), the GPP values were rather similar to each other (Fig. 2a). GPP values for shrubs were lowest and showed very little variability. One of the investigated shrub sites, Pianosa, was already found to be unproductive by Reichstein et al. (2007) (Fig. 2a).
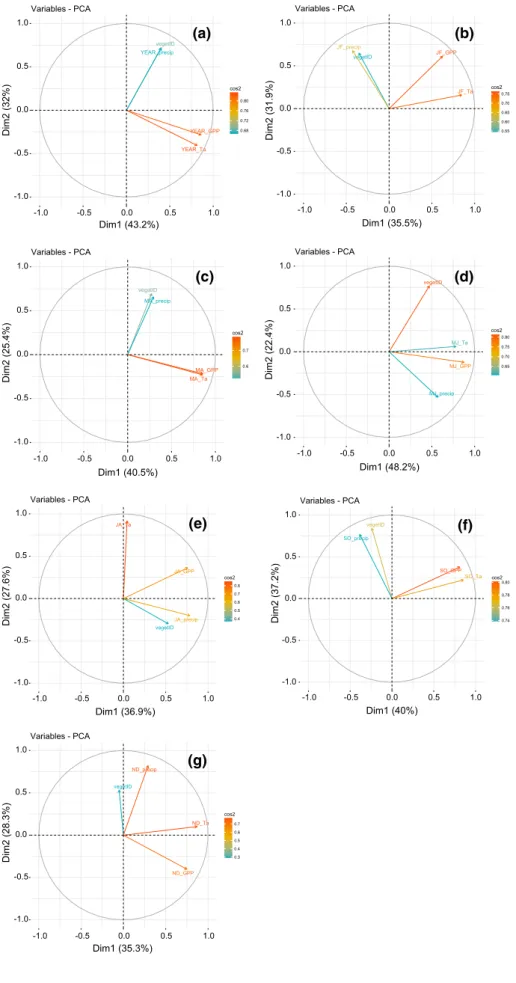
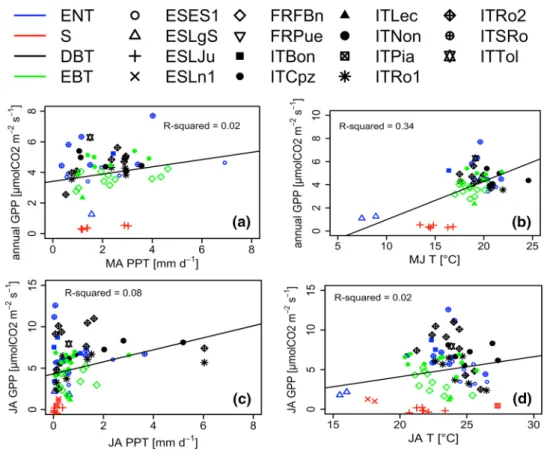
The two first axes of the PCA using the annual GPP, T and PPT explained 75.2% of the data variance (Fig. 3a). Principal component one (Dim1), which explained 43.2% of the data variance, was positively correlated with GPP and T. Dim2 accounted for 32% of the data variability and was positively related with PPT and vegetation types. Neverthe-less, with nested ANOVA, no significant correlation was found between annual GPP and annual T (for both mean and total) or annual PPT across sites and years (Table 2). Apply-ing simple linear regression models also did not result in a clear relationship between annual and bimonthly PPT and annual GPP (Fig. 4a, b), or between annual and seasonal T and annual GPP (Fig. 4c, d). However, by using bimonthly averages or the sum (in case of PPT) as explaining variables in the more advanced nested ANOVA, annual GPP (average and sum) could be explained (p < 0.05) by precipitation dur-ing early sprdur-ing (MA) and air temperature durdur-ing the early summer (MJ) (Table 2, Fig. 4a, c). Note that the regressions showed in Fig. 4 are only drawn when we found a significant interaction with the nested ANOVA (Table 2), and all the regressions are provided in supplementary materials. Fur-thermore, the R2 values in the figures relate to simple linear
regression. This was mainly done to show the differences
Table 2 (continued)
Seasonal (S1–S6)
Annual (S0) Jan & Feb (S2) Mar & Apr (S3) May & Jun (S4) Jul & Aug (S5) Sep & Oct (S6) Nov & Dec (S1) T o o o 0.0309 (p < 0.017) 0.0269 (p < 0.05) o o PPT:T o o o o o o o R2 0.77 Seasonal PPT – – – – 0.0350 (p < 0.05) o – T – – – – o o – PPT:T – – – – o o –
We performed three cases: In the first case, no filter was applied (1), in the second case the rainfall filter (2), in the third case the abiotic emis-sion filter (3). Numbers represent significant p values (p < 0.05) whereas an ‘o’ represents no significance (p > 0.05). The used significance levels are given in brackets. The R2 of the model is only reported when at least one variable was significant. Bold emphasis is representing p values
that are still significant after the Holm–Bonferroni correction. Italic emphasis indicates the p values that lost their significance after the Holm– Bonferroni correction. Bold italic emphasis represents the applied significance level without using the Holm–Bonferroni correction (seasonal approach)
between the two methods. Finally, the interactions between the explaining variables, T (bimonthly & annual) and PPT (bimonthly and annual), did not significantly impact the annual average of GPP (Table 2).
Intra‑annual GPP variability
The bimonthly distribution showed a low GPP at the begin-ning of the year (JF) that increased till MJ (highest median value 6.8 gC m−2 d−1) (Fig. 1b). During the summer (JA),
GPP slowly decreased until the lowest median value in ND (2.2 gC m−2 d−1). The highest variability in GPP was
observed in MJ and JA.
During the summer months (JA), PCA analysis showed that bimonthly average GPP was distributed over the two axes, whereas bimonthly average T and PPT were distrib-uted over Dim2 and Dim1, respectively (Fig. 3e). Consist-ently, nested ANOVA showed that the bimonthly average T affected the bimonthly average GPP (Fig. 4d; Table 2; sea-sonal approach). In general, seasea-sonal GPP was positively affected by seasonal T. In JA, the bimonthly average GPP was additionally affected by the bimonthly average of PPT (Fig. 4). Furthermore, there was an interaction between seasonal PPT and seasonal T during these months that was correlated to the bimonthly average of GPP (Table 2). Note that we also tried to perform the analysis at a monthly time step or using the previous time step of the observed clima-tology but no significant relationships were observed (data not shown).
Rainfall pulses and abiotic emissions
When we excluded rainfall pulses (days with precipitation events larger than 5 mm d−1—“Data filters” section) from
July to October, JA temperatures did no longer impact the annual GPP (Table 2). However, when applying the rainfall pulses with a threshold to 75% (excluding rainfall pulses larger than 13 mm d−1) or larger (90% and 95%),
the GPP is again sensitive to JA temperatures. Besides this, the results do not seem very sensitive to the threshold used to exclude days with rainfall pulses (Table S5). There was no change for MJ T and MA PPT. Due to the rainfall filter, there was one site less available for our analyses in both JA and SO. The number of suitable years decreased in all seasons, but there were still enough years to have confidence in the results (Table 2).
Excluding days with potential high abiotic emissions (“Data filters” section) did not change the influence of JA T on the GPP. However, the temperature in MJ no longer impacted annual GPP (p values < 0.05 but not significant after applying the Holm–Bonferroni correction). The lat-ter was also found for spring precipitation (MA), although the p values were very close to being significant after the correction method (Table 2). The number of available sites and years for our analysis decreased in all seasons. Also the correlation showed an overall decrease (Table 2).
Fig. 2 Boxplots showing a the general GPP distribution of the different vegetation types (ENT evergreen needle trees,
DBT deciduous broadleaf
trees, EBT evergreen broadleaf trees, S shrubs, numbers in the brackets indicating the numbers of sites per vegetation type) and b the GPP distribution c the air temperatures (T) and d the precipitation distribution observed during the different bimonthly time periods (JF January & February, MA March & April, MJ May & June, JA July & August, SO September & October, ND November & December)
Fig. 3 Principal component analysis for annual variables (a), and for each bimonthly period
(b–g) YEAR_precipvegetID YEAR_GPP YEAR_Ta -1.0 -0.5 0.0 0.5 1.0 -1.0 -0.5 0.0 0.5 1.0 Dim1 (43.2%) Dim2 (32% ) 0.68 0.72 0.76 0.80 cos2 Variables - PCA vegetID JF_precip JF_GPP JF_Ta -1.0 -0.5 0.0 0.5 1.0 -1.0 -0.5 0.0 0.5 1.0 Dim1 (35.5%) Dim2 (31.9%) 0.55 0.60 0.65 0.70 0.75 cos2 Variables - PCA vegetID MA_precip MA_GPP MA_Ta -1.0 -0.5 0.0 0.5 1.0 -1.0 -0.5 0.0 0.5 1.0 Dim1 (40.5%) Dim2 (25.4%) 0.6 0.7 cos2 Variables - PCA vegetID MJ_precip MJ_GPP MJ_Ta -1.0 -0.5 0.0 0.5 1.0 -1.0 -0.5 0.0 0.5 1.0 Dim1 (48.2%) Dim2 (22.4%) 0.65 0.70 0.75 0.80 cos2 Variables - PCA vegetID JA_precip JA_GPP JA_Ta -1.0 -0.5 0.0 0.5 1.0 -1.0 -0.5 0.0 0.5 1.0 Dim1 (36.9%) Dim2 (27.6% ) 0.4 0.5 0.6 0.7 0.8 cos2 Variables - PCA vegetID SO_precip SO_GPP SO_Ta -1.0 -0.5 0.0 0.5 1.0 -1.0 -0.5 0.0 0.5 1.0 Dim1 (40%) Dim2 (37.2% ) 0.74 0.76 0.78 0.80 cos2 Variables - PCA vegetID ND_precip ND_GPP ND_Ta -1.0 -0.5 0.0 0.5 1.0 -1.0 -0.5 0.0 0.5 1.0 Dim1 (35.3%) Dim2 (28.3% ) 0.3 0.4 0.5 0.6 0.7 cos2 Variables - PCA (a) (b) (c) (d) (e) (g) (f)
Discussion
GPP versus NEEIn this study, we investigated the response of GPP to the different climatic drivers, precipitation and temperature, in the Mediterranean region using data based on the eddy-covariance method from the FLUXNET database (Baldoc-chi et al. 2001). The GPP is derived from NEE measure-ments, and assumptions on ecosystem respiration (R) may not always reflect the primary production of the ecosystem if R is wrongly assessed (Reichstein et al. 2005). This may especially be an issue in Mediterranean ecosystems during drought conditions when GPP and R can be decoupled (e.g., Allard et al. 2008). Moreover, abiotic emissions can impact NEE measurements, as found at different Mediterranean sites (e.g., Serrano-Ortiz et al. 2007, 2009, 2010; Kowal-ski et al. 2008; Sanchez-Cañete et al. 2011, 2016 Pérez-Priego et al. 2013; López-Ballesteros et al. 2015), causing additional uncertainties in the GPP estimates. Furthermore, rain pulses during the dry season can cause uncertainties in GPP values as large amounts of CO2 may be released by soil
respiration depending on ‘pulse size’ and ‘pulse duration’ (e.g., Knapp et al. 2002; Cable and Huxman 2004; Schwin-ning and Sala 2004; Rey et al. 2005; López-Ballesteros et al. 2015). The latter involves complex interactions on different levels in the trophic web and different growth responses of
vegetation as described in detail by Schwinning and Sala (2004). To account for these effects, we applied two different filters to the data, and we repeated all the analyses for both GPP and NEE. Nevertheless, as described in “Data filters” section, the filters that we used help to exclude days with potential abiotic fluxes, but cannot be used to estimate the abiotic fluxes. GPP estimated based on NEE may also be biased due to the implicit assumption that BVOC emissions are negligible whereas they may represent a non-negligible fraction of the GPP (Portillo-Estrada et al. 2018). Moreo-ver, the BVOC fluxes are also controlled by climate drivers (Loreto and Fineschi 2015; Jiang et al. 2018). In this study, we ignored such contributions since the data were not avail-able. Incorporating BVOCs may however be a necessary step in the future as some studies show that emissions of isoprene, which is globally the most emitted BVOC, may be impacted by climate change (Staudt et al. 2017; Genard-Zielinski et al. 2018).
Spring precipitation
Interestingly, neither the annual T nor the annual PPT was found to have a major control on annual biomass production in the Mediterranean region. This underlines the importance of applying seasonal (or intra-annual) approaches rather than conducting mere inter-annual studies when investi-gating potential effects on biomass production within the
Fig. 4 Seasonal mean PPT versus the annual mean GPP (a), seasonal mean PPT versus the seasonal mean GPP (b), seasonal mean T versus the annual mean GPP (c) and seasonal mean T versus the seasonal mean GPP (d) for the different vegetation types and over the different bimonthly time periods. See Fig. 2 for the abbreviations of the vegetation types (ENT, DBT, EBT and S). The simple trend line and R-squared value were added where a significant p value was obtained during our statistical tests (see Table 2). Note that the R-squared value is obtained with a simple linear regression and does not correspond to the R-squared of Table 2. The nonsignificant relationships are given in supplementary material
Mediterranean region. This finding is not in line with Jongen et al. (2011) who observed a positive correlation between annual precipitation and GPP for a Portuguese grassland, although of course this may also be due to the different veg-etation type. Here, we did not investigate the precise floristic composition but divided the data into the four vegetation types, based on the dominant species of the sites, ignor-ing some species-specific response to climate drivers as previously observed (Baldocchi et al. 2004). Consequently, the absence of response here might result from a too large variance at ecosystems scales due to such species-specific response. At a global scale, Beer et al. (2010) also observed a positive relationship between GPP and mean annual pre-cipitation. This effect was also found in China over different vegetation types (Yu et al. 2013). Our results suggest how-ever that annual PPT may not be a major driver of GPP in the Mediterranean region. This is in accordance with Allard et al. (2008) who observed that the seasonal averages of precipitation, more than the annual average, were important drivers for GPP in a Mediterranean holm oak forest. Indeed, arid ecosystems seem less sensitive to annual PPT but more to its seasonality (Fay 2009; Robertson et al. 2009). Mediter-ranean vegetation is known to adapt its water use efficien-cies to prevent drought (Forner et al. 2018). For instance, at leaf level, plants tend to modify their ratio between net CO2 assimilation rate and stomatal conductance to increase the photosynthetic water use efficiency (Medrano et al. 2009). Consequently, those adaptive strategies may explain why Mediterranean vegetation is more sensitive to the seasonal-ity of PPT than to its annual average. Since we used a site compilation, in opposite to what is generally done for Medi-terranean region, where studies are usually performed only on one or few sites, our results can be considered as general trends over such type of ecosystems.
The rainfall during the early spring months (MA) had an important impact on annual GPP. PPT over the other time periods, however, did not significantly affect annual GPP (Table 2; Fig. 4). During MA, when the growing sea-son starts, the rainfall (Fig. 2d) is high enough to support vegetation growth, whereas the air temperature is not yet too high to reduce carbon fixation (Fig. 2c). Hence, early spring does not only provide good growing conditions, and it can also control the soil moisture conditions before the extremely dry and hot summer months (see Fig. 2b, c). As the evaporative demand of the atmosphere is still relatively low in this period, most precipitated rainfall can be used for the recharge of aquifers. The highest GPP values as well as the highest GPP variability were observed in the late spring and summer months (MJ, JA; Fig. 2b). MA can thus be seen as a decisive time period in the year in control-ling the annual biomass production which is consistent with Allard et al. (2008) who showed that a decrease of precipita-tion in April–June would have a large effect on annual net
ecosystem production (NEP), whereas the impact of decreas-ing precipitation in July–September on NEP would be less severe. A rainfall exclusion experiment in a Quercus ilex forest in the south of France confirmed these findings (Mis-son et al. 2010). Maselli (2004) also reported that vegetation activity was mainly affected by spring precipitation. Using NEE instead of GPP (Table S3) showed similar effects of PPT during MA. Because during these months the system is usually not yet water limited, GPP and R may not yet be uncoupled, resulting in better estimations of GPP obtained from NEE measurements.
GPP during the summer season
Temperature
Late spring and early summer T (MJ) seemed to significantly influence annual GPP (Table 2; Fig. 4c). Higher tempera-tures led to an increase in GPP. The soil moisture level at this stage of the summer may still have been sufficiently high to support the high temperatures and stimulate growth. Nev-ertheless, it is important to note that two sites (ESLJu and ESLgS), which are both located at high altitude in the Betic chain mountain, mainly drive this relationship over the 15 sites. Surprisingly, we found a slightly positive relationship between temperature and GPP during JA as well, although after applying the Holm–Bonferroni method the correlation was no longer significant (Table 2; Fig. 4c). Such a relation-ship was not expected as the Mediterranean region is char-acterized by a long growing season that is often interrupted during late summer, when water stress and temperatures are getting too high (e.g., Reichstein et al. 2002; Allard et al. 2008). Our results do not exactly support this finding, and Fig. 2b suggests that high GPP was also observed during JA. This is nevertheless coherent with Dong et al. (2019) who showed that the leaf carbon assimilation at the H. J. Andrews Experimental Forest (Oregon, USA) which faces a Mediter-ranean climate was relatively constant during summer.
Allard et al. (2008) suggested that under such extreme drought conditions, GPP and ecosystem respiration (Reco) are partly decoupled, most likely due to stomatal closure. However, as already mentioned, the results of GPP during the dry season may not perfectly reflect the biological activ-ity. This is confirmed when using NEE instead of GPP in our analyses. In this case, the effect of temperature during summer is no longer significant (Suppl. Tab. 2), indicating that other processes are playing a role as well. Moreover, it is important to note that even though all the sites in our study are located within the Mediterranean region, some sites are located in mountainous regions (Table S1) and face differ-ent temperature regimes. Such differences may increase the variance of the data and therefore hide some site-specific patterns. Also rainfall pulses and abiotic emissions should
be considered when studying GPP in the summer season as discussed in the following paragraphs.
Rain pulses
Birch (1958) already found that rewetting of a dry soil had a positive effect on mineralization. Orchard and Cook (1983) and (Van Gestel et al. 1993) also reported that remoistening of dry soils caused a peak in CO2 efflux. They ascribed this effect to both assimilation of dead microbial biomass and an increase in microbial respiration directly after the rewetting took place. This has later been confirmed by many other studies (e.g., Emmerich 2003; Rey et al. 2005; Jarvis 2007; López-Ballesteros et al. 2015). More hypotheses on the cause of the sudden CO2 efflux are discussed by Unger et al.
(2010). Although all these studies found a strong response of CO2 release to rainfall pulses, the magnitude of the pulse that triggered the response generally differed between studies (e.g., Schwinning and Sala 2004; Hao et al. 2013). Cable and Huxman (2004) tested for instance the difference between a 2 mm and a 25.4 mm rain pulse, while Unger et al. (2010) used a 20 mm irrigation pulse and Hao et al. (2013) used 3 mm and 5 mm at different times of the summer season. We used a daily frequency distribution of precipitation to choose different threshold values and decided on using 5, 13, 25 and 37 mm d−1. These are the values at which less than 50%,
75%, 90% and 95%, respectively, of all rainfall events occur (Table S3) and are comparable with the values found and used in other studies (e.g., Schwinning and Sala 2004; Hao et al. 2013). Excluding the 5 mm d−1 rainfall events (50% of
all events) from our data eliminated the effect of JA tempera-ture on the annual GPP. However, excluding only the heavier precipitation events (13 mm d−1—75%; 25 mm d−1—90%,
37 mm d−1—95%) made GPP sensitive to JA temperatures
again. This may depend partly on the number of days that are excluded (137, 47, 21 and 8 days for the 50%, 75%, 90% and 95%, respectively) bringing the number of days analyzed, when looking only at 75, 90 and 95%, closer to the original data when all rainfall events are included. In the original data, the JA T was influencing the GPP in JA as well. With the rainfall filters, this was no longer the case. It may sug-gest that during the days with rain, the clouds inhibited too much radiation, causing a decrease in photosynthesis. This is coherent with the observations of Moore et al. (2011) and Daly and McKee (2013) at HJ Andrews Experimental For-est (Oregon, USA). These results confirm the importance of including summer rainfall pulses in studies about drivers of GPP in the Mediterranean region. The effect of MA PPT on MA GPP and the effect of MJ T on MJ GPP did not change after the application of the rainfall filter. This may indicate that the soils still contain enough soil moisture to avoid the triggering of a CO2 efflux. The rainfall variability may also act differently on different vegetation types and soils, as the
way the vegetation responds to remoistening depends on the availability of water to the roots. Different rooting depths and infiltration rates will affect this response, but this was not investigated in the current study (e.g., Schwinning and Sala 2004) because such data were not available in our data-set. Additionally, we excluded all days with rainfall pulses from our analyses and did not take the dryness of the soil into account. CO2 releases mostly occur on dry soils, and by filtering all days with rainfall events, we may also have elim-inated rainy days over wet soils that may not be prone to CO2
release and may even stimulate GPP. Lastly, we excluded only single days from our data to avoid reducing our dataset too much. Abiotic CO2 fluxes mainly occur when weather conditions favor abiotic processes, but it is important to note that some studies suggest that the CO2 efflux can last up
to several days after the rain pulse (e.g., Jarvis 2007; Hao et al. 2013; López-Ballesteros et al. 2017). However, López-Ballesteros et al. (2017) also find the largest R at the day of the rain pulse, as Rey et al. (2005). Therefore, we think our 1-day exclusion is reasonable and filters most of the abiotic CO2 response from our analyses.
Abiotic emissions
Abiotic emissions probably play a role in our analyses as well, as shown by the different results after applying filter 1 (“Data filters” section; Table 2). In MJ, the temperature is no longer a driver of annual GPP while it is in JA. How-ever, JA T no longer impacts the GPP in JA. Furthermore, annual GPP shows a response to T in MJ and JA, but annual NEE does not show any significant relation with T in these bimonthly periods. This may indicate that CO2 is released by subterranean ventilation, which has been found at sev-eral sites in the Mediterranean area (e.g., Serrano-Ortiz et al. 2007; Kowalski et al. 2008; López-Ballesteros et al. 2017). Karst systems, or carbonate soils, have the poten-tial to store large amounts of CO2 that can be released after
dry periods under windy conditions (e.g., Sanchez-Cañete et al. 2011, 2016; Rey et al. 2012; Pérez-Priego et al. 2013; Roland et al. 2013). In our filter, we used a wind speed threshold of 0.5 m s−1 as defined by Sánchez-Cañete et al.
(2016); however, Rey et al. (2012) found that wind acts as a driver of CO2 effluxes at higher values of 2 m s−1 and
Emmerich (2003) even at 5 m s−1, while a lower value of
0.3 m s−1 is mentioned by Sanchez-Cañete et al. (2011).
The filter was furthermore applied to all sites. Most studies on subterranean ventilation have been done at El Llano de los Juanes (ES-LJu) and some other Spanish sites that were not included in our analyses. However, we decided to test all sites as it was concluded by several studies that these processes may occur at other Mediterranean sites as well (Rey et al. 2012; Roland et al. 2013), and carbonate soils are
relatively common in Europe and parts of the Mediterranean area (Dürr et al. 2005).
Future summer climate
Mediterranean summers are expected to become warmer and drier in general (Somot et al. 2008; Coumou and Robinson 2013), which could possibly lead to more abiotic emissions. However, these emissions also depend on wind speed, the projection of which is more uncertain in the future climate. Stilling (i.e., decrease in wind speed) has been observed over Europe over the last decades (Vautard et al. 2010; Bichet et al. 2012), although over the Mediterranean region the sign was unclear and sometimes even positive [Fig. 1 in Vautard et al. (2010); Table 2 in McVicar et al. (2012)]. During the summer season, most important for subterranean ventila-tion, a positive trend of mean wind (Azorin-Molina et al. 2014) and wind gust peaks (Azorin-Molina et al. 2016) was found over Spain and Portugal. Still, it is unclear how the wind speed will evolve over the coming decades. One of the possible explanations for the observed stilling is an increase in roughness length (Vautard et al. 2010) which could play a role in the Mediterranean region in the case of land aban-donment. Besides temperature and wind, more variability and heavy and shorter rainfall is predicted (Christensen and Christensen 2003; Giorgi and Lionello 2008). The increased variability with more extremes could possibly lead to more extreme pulses, and therefore, higher CO2 releases from the soil. Therefore, we recommend that future studies in the Mediterranean region also take abiotic emissions and sum-mer rainfall pulses into account.
Processes during autumn and winter
At many Mediterranean sites, a second peak of biological activity occurs after the summer, with the first autumn rain-fall (Allard et al. 2008). This would raise expectations of a clear relationship between autumn PPT and GPP. However, we did not find any significant correlation. Seasonal NEE was, however, affected by PPT in SO (Table S3). This could mean a response of respiration to the rainfall, but we cannot confirm this with our analyses.
During winter, vegetation can still be active at some Med-iterranean sites if the winter temperature does not drop too much, while the vegetation is mostly very well adapted to heat and water stress, it may not be able to survive low win-ter temperatures (Larcher 2000; Llorens et al. 2003; Aranda et al. 2005). Therefore, a positive relation could be expected between GPP and T. However, we did not find any response of temperature on GPP (and NEE) during this season (ND & JF) (Table 2; Table S3).
An aspect we did not investigate in our study is lagged effects. Below-zero temperatures during winter may induce
freezing-induced embolism, which can only be partly restored (Nardini et al. 2000; Cochard et al. 2001). These factors can predispose trees to drought and heat stress that are occurring during summer (Peguero-Pina et al. 2011). Bansal et al. (2015) and Sohn et al. (2012) found that winter conditions are sometimes more decisive for plant growth than summer aridity in some parts of the Mediterranean region. Future climate projections suggest an increase in air temperature in this area (Goubanova and Li 2007), reduc-ing the possibility of impacts of cold winter temperatures on GPP later in the year. However, more variability and extremes, also during the winter, could lead to an increased number of freezing–thawing cycles. Lagged effects may also occur after severe spring or summer drought or other extreme events during the year. Another aspect that may affect the GPP of Mediterranean ecosystems is the succes-sion of drought as predicted by climate models (Goubanova and Li 2007; Polade et al. 2014). Indeed, using dendrochro-nology some authors showed that repeated droughts in the past may have affected the biomass production of a given year (Badeau et al. 2011). Different adaptation strategies between species may largely impact their GPP response to climate change. For instance, Forner et al. (2018) showed that different water use efficiency and growth strategies between P. nigra and Q. faginea control their response to drought. Drought effects can even be amplified for trees facing competition for other resources (Linares et al. 2010; Grote et al. 2016). However, these mechanisms (Ryan 2011; Martínez-Vilalta and Garcia-Forner 2017) are not taken into account in the current study and could be subject to future research.
Conclusion
In this study, we investigated the response of GPP of Medi-terranean ecosystems to different climatic variables. We used a large collection of sites with different vegetation types over the European Mediterranean region with the aim to identify the impact of annual and seasonal precipitation and air temperature on GPP. Using a large collection of sites is filling a gap between studies done only at one site with limited spatial but often high temporal resolution and studies done using satellite data with a better spatial representation but with less information on temporal dynamic. Our main findings are as follows:
1. The annual GPP is not predominantly controlled by the annual precipitation and annual air temperature. 2. Early spring precipitation seems to play a major role on
the annual GPP with a positive effect.
3. Early summer air temperature has a positively effect on the annual GPP as well, although we found that both
dry season rainfall pulses and abiotic emissions play a role too and should not be neglected when carrying out studies in this region.
4. During the summer months (JA), both precipitation and temperature positively affect the GPP in these months. 5. The GPP in autumn and winter does not seem to be
influenced by temperature and precipitation.
The sites used in our study were located in Europe, more precisely in France, Spain and Italy. To broaden our conclu-sions, more data could be used from other sites, also from non-European parts of the Mediterranean region. Further-more, it would be interesting to add data for grasslands or other vegetation types as well to see if our conclusions hold over a broader range of Mediterranean sites, at least at sites where management is not the most important driver of GPP. Stand ages may also be a major driver for GPP but were not included in this analysis. Nevertheless, we showed that in the future, the reduction of spring precipitation will have a major impact on carbon storage of many different Mediter-ranean ecosystems.
Acknowledgements This work was supported by the French National Agency for Research (ANR-12-BSV7-0016-01, SECPRIME2). This work used eddy covariance data acquired and shared by the FLUXNET community, including these networks: AmeriFlux, AfriFlux, AsiaFlux, CarboAfrica, CarboEuropeIP, CarboItaly, CarboMont, ChinaFlux, Fluxnet-Canada, GreenGrass, ICOS, KoFlux, LBA, NECC, OzFlux-TERN, TCOS-Siberia and USCCC. The ERA-Interim reanalysis data are provided by ECMWF and processed by LSCE. The FLUXNET eddy covariance data processing and harmonization were carried out by the European Fluxes Database Cluster, AmeriFlux Management Project and Fluxdata project of FLUXNET, with the support of CDIAC and ICOS Ecosystem Thematic Center, and the OzFlux, ChinaFlux and AsiaFlux offices. The authors acknowledge P. Serrano-Ortiz, A. S. Kowalski and F. Guibal for sharing FLUXNET data.
References
Allard V, Ourcival JM, Rambal S et al (2008) Seasonal and annual vari-ation of carbon exchange in an evergreen Mediterranean forest in southern France. Glob Change Biol 14:714–725. https ://doi.org/ 10.1111/j.1365-2486.2008.01539 .x
Aranda I, Castro L, Alía R et al (2005) Low temperature during winter elicits differential responses among populations of the Mediterra-nean evergreen cork oak (Quercus suber). Tree Physiol 25:1085– 1090. https ://doi.org/10.1093/treep hys/25.8.1085
Azorin-Molina C, Vicente-Serrano SM, Mcvicar TR et al (2014) Homogenization and assessment of observed near-surface wind speed trends over Spain and Portugal, 1961–2011. J Clim 27:3692–3712. https ://doi.org/10.1175/JCLI-D-13-00652 .1
Azorin-Molina C, Guijarro J-A, McVicar TR et al (2016) Trends of daily peak wind gusts in Spain and Portugal, 1961–2014. J Geo-phys Res 121:1059–1078. https ://doi.org/10.1002/2013J D0202 25.Recei ved
Badeau V, Becker M, Bert D et al (2011) Long-term growth trends of trees: ten years of dendrochronological studies in France.
In: Spiecker H, Mielikäinen K, Köhl M, Skovsgaard JP (eds) Growth trends in European forests. Springer, Berlin, pp 167–181 Baldocchi D, Falge E, Gu LH et al (2001) FLUXNET: a new tool to study the temporal and spatial variability of ecosystem-scale carbon dioxide, water vapor, and energy flux densities. Bull Am Meteorol Soc 82:2415–2434. https ://doi.org/10.1175/1520-0477
Baldocchi DD, Xu L, Kiang N (2004) How plant functional-type, weather, seasonal drought, and soil physical properties alter water and energy fluxes of an oak-grass savanna and an annual grassland. Agric Forest Meteorol 123:13–39. https ://doi. org/10.1016/j.agrfo rmet.2003.11.006
Baldocchi DD, Ma S, Rambal S et al (2010) On the differential advantages of evergreenness and deciduousness in medi-terranean oak woodlands: a flux perspective. Ecol Appl 20:1583–1597
Bansal S, Harrington CA, Gould PJ, St.Clair JB (2015) Climate-related genetic variation in drought-resistance of Douglas-fir (Pseudotsuga menziesii). Glob Change Biol 21:947–958. https ://doi.org/10.1111/gcb.12719
Beer C, Reichstein M, Tomelleri E et al (2010) Terrestrial gross carbon dioxide uptake: global distribution and covariation with climate. Science 80(329):834–838
Bichet A, Wild M, Folini D, Schr C (2012) Causes for dec-adal variations of wind speed over land: sensitivity studies with a global climate model. Geophys Res Lett. https ://doi. org/10.1029/2012G L0516 85
Birch HF (1958) The effect of soil drying on humus decomposition and nitrogen availability. Plant Soil 10:1200–1213
Cable JM, Huxman TE (2004) Precipitation pulse size effects on Sonoran Desert soil microbial crusts. Oecologia 141:317–324.
https ://doi.org/10.1007/s0044 2-003-1461-7
Christensen JH, Christensen OB (2003) Severe summertime flooding in Europe. Nature 421:805–806. https ://doi.org/10.1038/42180 5a
Cochard H, Lemoine D, Améglio T, Granier a (2001) Mechanisms of xylem recovery from winter embolism in Fagus sylvatica. Tree Physiol 21:27–33. https ://doi.org/10.1093/treep hys/21.1.27
Conover WJ, Iman RL (1981) Rank transformations as a bridge between parametric and nonparametric statistics. Am Stat 35:124–
129.https ://doi.org/10.1080/00031 305.1981.10479 327
Coumou D, Robinson A (2013) Historic and future increase in the global land area affected by monthly heat extremes. Environ Res Lett. https ://doi.org/10.1088/1748-9326/8/3/03401 8
Cowling RM, Rundel PW, Lamont BB et al (1996) Plant diversity in Mediterranean-climate regions. Trends Ecol Evol 11:362–366.
https ://doi.org/10.1016/0169-5347(96)10044 -6
Daly C, McKee W (2013) Meteorological data from benchmark sta-tions at the Andrews Experimental Forest, 1957 to present, Long-Term Ecological Research. Forest Science Data Bank. http://andre
wsfor estor egons tate.edu/data/abstr act.cfm. Accessed July 2017
Dong Z, Driscoll CT, Johnson SL et al (2019) Projections of water, carbon, and nitrogen dynamics under future climate change in an old-growth Douglas-fir forest in the western Cascade Range using a biogeochemical model. Sci Total Environ 656:608–624. https :// doi.org/10.1016/j.scito tenv.2018.11.377
Dubrovsky M, Hayes M, Duce P et al (2014) Multi-GCM projections of future drought and climate variability indicators for the Mediter-ranean region. Reg Environ Change 14:1907–1919. https ://doi. org/10.1007/s1011 3-013-0562-z
Dürr HH, Meybeck M, Dürr SH (2005) Lithologic composition of the Earth’s continental surfaces derived from a new digital map emphasizing riverine material transfer. Glob Biogeochem Cycles 19:1–23. https ://doi.org/10.1029/2005G B0025 15
Emmerich WE (2003) Carbon dioxide fluxes in a semiarid environment with high carbonate soils. Agric Forest Meteorol 116:91–102.
Fay PA (2009) Precipitation variability and primary productivity in water-limited ecosystems: how plants ‘leverage’ precipitation to ‘finance’ growth. New Phytol 181:5–8
Forner A, Valladares F, Bonal D et al (2018) Extreme droughts affect-ing Mediterranean tree species’ growth and water-use efficiency: the importance of timing. Tree Physiol 38:1127–1137. https ://doi. org/10.1093/treep hys/tpy02 2
Garrigues S, Lacaze R, Baret F et al (2008) Validation and inter-comparison of global Leaf Area Index products derived from remote sensing data. J Geophys Res Biogeosci. https ://doi. org/10.1029/2007J G0006 35
Genard-Zielinski AC, Boissard C, Ormeño E et al (2018) Seasonal variations of Quercus pubescens isoprene emissions from an in natura forest under drought stress and sensitivity to future climate change in the Mediterranean area. Biogeosciences 15:4711–4730.
https ://doi.org/10.5194/bg-15-4711-2018
Giorgi F, Lionello P (2008) Climate change projections for the Medi-terranean region. Glob Planet Change 63:90–104. https ://doi. org/10.1016/j.glopl acha.2007.09.005
Goerner A, Reichstein M, Rambal S (2009) Tracking seasonal drought effects on ecosystem light use efficiency with satellite-based PRI in a Mediterranean forest. Remote Sens Environ 113:1101–1111.
https ://doi.org/10.1016/j.rse.2009.02.001
Goubanova K, Li L (2007) Extremes in temperature and precipitation around the Mediterranean basin in an ensemble of future climate scenario simulations. Glob Planet Change 57:27–42. https ://doi. org/10.1016/j.glopl acha.2006.11.012
Grote R, Gessler A, Hommel R et al (2016) Importance of tree height and social position for drought-related stress on tree growth and mortality. Trees 30:1467–1482. https ://doi.org/10.1007/s0046 8-016-1446-x
Grünzweig JM, Carmel Y, Riov J et al (2008) Growth, resource stor-age, and adaptation to drought in California and eastern Mediter-ranean oak seedlings. Can J Forest Res 38:331–342. https ://doi. org/10.1139/X07-152
Guenet B, Danger M, Harrault L et al (2014) Fast mineralization of land-born C in inland waters: first experimental evidences of aquatic priming effect. Hydrobiologia 721:35–44. https ://doi. org/10.1007/s1075 0-013-1635-1
Guiot J, Cramer W (2016) Climate change, the Paris Agreement thresh-olds and Mediterranean ecosystems. Science 80(4532):4528–4532 Hao Y, Kang X, Wu X et al (2013) Is frequency or amount of pre-cipitation more important in controlling CO2 fluxes in the
30-year-old fenced and the moderately grazed temperate steppe? Agric Ecosyst Environ 171:63–71. https ://doi.org/10.1016/j. agee.2013.03.011
Hertig E, Jacobeit J (2008) Assessments of Mediterranean precipita-tion changes for the 21st century using statistical downscaling techniques. Int J Climatol 28:1025–1045. https ://doi.org/10.1002/ joc.1597
Holm S (1979) A simple sequentially rejective multiple test procedure. Scand J Stat 6:65–70. https ://doi.org/10.2307/46157 33
Janssens IA, Freibauer A, Ciais P et al (2003) Europe’s terrestrial biosphere absorbs 7 to 12% of European anthropogenic CO2
emissions. Science 300:42–1538. https ://doi.org/10.1126/scien ce.10835 92
Jarvis NJ (2007) A review of non-equilibrium water flow and solute transport in soil macropores: principles, controlling factors and consequences for water quality. Eur J Soil Sci 58:523–546 Jiang X, Guenther A, Potosnak M et al (2018) Isoprene emission
response to drought and the impact on global atmospheric chem-istry. Atmos Environ 183:69–83. https ://doi.org/10.1016/j.atmos env.2018.01.026
Jongen M, Pereira JS, Aires LMI, Pio CA (2011) The effects of drought and timing of precipitation on the inter-annual vari-ation in ecosystem-atmosphere exchange in a Mediterranean
grassland. Agric Forest Meteorol 151:595–606. https ://doi. org/10.1016/j.agrfo rmet.2011.01.008
Keenan T, Maria Serra J, Lloret F et al (2011) Predicting the future of forests in the Mediterranean under climate change, with niche- and process-based models: CO2 matters! Glob Change Biol
17:565–579. https ://doi.org/10.1111/j.1365-2486.2010.02254 .x
Knapp AK, Fay PA, Blair JM et al (2002) Rainfall variability, carbon cycling, and plant species diversity in a mesic grassland. Sci-ence 80(298):2202–2205
Kowalski AS, Serrano-Ortiz P, Janssens IA et al (2008) Can flux tower research neglect geochemical CO2 exchange? Agric
For-est Meteorol 148:1045–1054. https ://doi.org/10.1016/J.AGRFO RMET.2008.02.004
Larcher W (2000) Temperature stress and survival ability of Mediter-ranean sclerophyllous plants. Plant Biosyst 134:279–295. https ://doi.org/10.1080/11263 50001 23313 50455
Lavorel S, Canadell J, Rambal S, Terradas J (1998) Mediterranean terrestrial ecosystems: research priorities on global change effects. Glob Ecol Biogeogr 7:157–166. https ://doi.org/10.1046/ j.1466-822X.1998.00277 .x
Limousin JM, Rambal S, Ourcival JM et al (2009) Long-term transpiration change with rainfall decline in a Mediterranean
Quercus ilexi forest. Glob Change Biol 15:2163–2175. https ://
doi.org/10.1111/j.1365-2486.2009.01852 .x
Limousin JM, Misson L, Lavoir AV et al (2010) Do photosynthetic limitations of evergreen Quercus ilexi leaves change with long-term increased drought severity? Plant Cell Environ 33:863–
875.https ://doi.org/10.1111/j.1365-3040.2009.02112 .x
Linares JC, Camarero JJ, Carreira JA (2010) Competition modulates the adaptation capacity of forests to climatic stress: insights from recent growth decline and death in relict stands of the Mediterranean fir Abies pinsapo. J Ecol 98:592–603. https :// doi.org/10.1111/j.1365-2745.2010.01645 .x
Llorens L, Penuelas J, Estiearte M (2003) Ecophysiological responses of two Mediterranean shrubs, Erica multiflora and
Globularia alypum, to experimentally drier and warmer
con-ditions. Physiol Plant 119:231–243. https ://doi.org/10.103 4/j.1399-3054.2003.00174 .x
López-Ballesteros A, Serrano-Ortiz P, Sánchez-Cañete EvP et al (2015) Rain pulses enhance the net CO2 release of a semi-arid
grassland in SE Spain. J Geophys Res Biogeosci. https ://doi. org/10.1002/2015J G0030 91
López-Ballesteros A, Serrano-Ortiz P, Kowalski AS et al (2017) Subterranean ventilation of allochthonous CO2 governs net CO2
exchange in a semiarid Mediterranean grassland. Agric Forest Meteorol 234–235:115–126
Loreto F, Fineschi S (2015) Reconciling functions and evolution of iso-prene emission in higher plants. New Phytol 206:578–582. https ://doi.org/10.1111/nph.13242
Martínez-Vilalta J, Garcia-Forner N (2017) Water potential regula-tion, stomatal behaviour and hydraulic transport under drought: deconstructing the iso/anisohydric concept. Plant Cell Environ 40:962–976. https ://doi.org/10.1111/pce.12846
Martin-Stpaul NK, Limousin JM, Vogt-Schilb H et al (2013) The temporal response to drought in a Mediterranean evergreen tree: comparing a regional precipitation gradient and a throughfall exclusion experiment. Glob Change Biol 19:2413–2426. https :// doi.org/10.1111/gcb.12215
Maselli F (2004) Monitoring forest conditions in a protected Medi-terranean coastal area by the analysis of multiyear NDVI data. Remote Sens Environ 89:423–433. https ://doi.org/10.1016/j. rse.2003.10.020
Maselli F, Cherubini P, Chiesi M et al (2014) Start of the dry season as a main determinant of inter-annual Mediterranean forest produc-tion variaproduc-tions. Agric Forest Meteorol 194:197–206. https ://doi. org/10.1016/j.agrfo rmet.2014.04.006