HAL Id: hal-02420857
https://hal.archives-ouvertes.fr/hal-02420857
Submitted on 7 Jan 2020
HAL is a multi-disciplinary open access
archive for the deposit and dissemination of
sci-entific research documents, whether they are
pub-lished or not. The documents may come from
teaching and research institutions in France or
abroad, or from public or private research centers.
L’archive ouverte pluridisciplinaire HAL, est
destinée au dépôt et à la diffusion de documents
scientifiques de niveau recherche, publiés ou non,
émanant des établissements d’enseignement et de
recherche français ou étrangers, des laboratoires
publics ou privés.
A multi-analytical approach towards the investigation of
Subarctic Athapaskan colouring of quillwork and its
sensitivity to photo-degradation
L.G. Troalen, S. Röhrs, T. Calligaro, C. Pacheco, S. Kunz, J.M. del
Hoyo-Meléndez, A.N. Hulme
To cite this version:
L.G. Troalen, S. Röhrs, T. Calligaro, C. Pacheco, S. Kunz, et al.. A multi-analytical approach
to-wards the investigation of Subarctic Athapaskan colouring of quillwork and its sensitivity to
photo-degradation. Microchemical Journal, Elsevier, 2016, 126, pp.83-91. �10.1016/j.microc.2015.11.053�.
�hal-02420857�
A multi-analytical approach towards the investigation of Subarctic
Athapaskan colouring of quillwork and its sensitivity
to photo-degradation
☆
L.G. Troalen
a,b,⁎
, S. Röhrs
c, T. Calligaro
d, C. Pacheco
d, S. Kunz
c, J.M. del Hoyo-Meléndez
e, A.N. Hulme
a,⁎⁎
aEaStCHEM School of Chemistry, Joseph Black Building, Kings Buildings, David Brewster Road, Edinburgh EH9 3FJ, UK b
National Museums Scotland, Collections Services Department, 242 West Granton Road, Edinburgh EH5 1JA, UK
c
Rathgen-Forschungslabor - Staatliche Museen zu Berlin, Schloßstraße 1A, Berlin 14059, Germany
d
Centre de Recherche et de Restauration des Musées de France, Quai François Mitterrand, Paris F 75 001, France
e
The National Museum in Krakow, Laboratory of Analysis and Non-Destructive Investigation of Heritage Objects, ul. Pilsudskiego 14, 109 Krakow, Poland
a b s t r a c t
a r t i c l e i n f o
Article history: Received 4 August 2015
Received in revised form 30 November 2015 Accepted 30 November 2015
Available online 3 December 2015
Non-European dyed materials other than textiles have received comparatively little systematic analysis, this is particularly true for objects made with dyed porcupine quills. This paper presents a comprehensive study of a group of Athapaskan porcupine quill specimens collected in 1862 which are held within the collections of National Museums Scotland, UK. Due to sampling limitations micro-destructive testing, or non-invasive analysis using PDA-UPLC, Raman Spectroscopy and PIXE were used to characterise the dye sources and metallic mordants. RBS was used to obtain additional information on the depth-profiling of the mordants in the keratin-based quill. The sensitivity of the quill specimens to photo-degradation was evaluated using Micro Fade Testing (MFT). The results from this multi-analytical study will be used to inform future display regimes of this unique collection.
© 2015 The Authors. Published by Elsevier B.V. This is an open access article under the CC BY license (http://creativecommons.org/licenses/by/4.0/). Keywords: Porcupine quillwork Dyestuffs Mordants UPLC PIXE/RBS Photo-degradation 1. Introduction
Non-European dyed materials other than textiles[1]have received little systematic study, particularly those made of porcupine quills, a material used by Native communities across North America and the Subarctic to decorate garments and basketry[2,3]. Since porcupine quills are made of a keratinous material similar to that of woolfibres
[4,5], the dyeing processes might be expected to be related, but only limited information is available about the actual dye sources[6,7]and dyeing processes used by native North Americans [8]. Northern Athapaskan artefacts are particularly rare, but significant collections of these may be found at the Canadian Museum of Civilization and National Museums Scotland (NMS)[9,10]. It is known that quillwork decoration was an important element of Athapaskan clothing[11,12]
and the Athapaskans used it to produce complex geometric coloured patterns[13]. Late 18th century European accounts of Athapaskan
quillwork mention the use native species including Galium tinctorium L. Scop. and Helleborus trifolis L. to obtain red and yellow colours
[8,14], while post 1850s Athapaskan work is characterised by the use of red, blue and white bands[13]but the dye sources for these are not well documented[8].
In this study, we analysed a unique group of dyed porcupine quills (Acc. N°: A.848.15) that were collected in 1862 from Northern Athapas-kans (Fig. 1a)[9,15]. The range of colour is extraordinary and includes various shades of blue, green, orange, yellow, and red; together with very pale quills that could be either un-dyed or more faded than the rest of the materials. This range of colours reflects complex dyeing practices, with combinations of dyestuffs and even the use of additives (e.g., metallic mordants) to the dyebath.
The characterisation of the dye sources used in porcupine quillwork is particularly challenging,firstly due to sampling limitations, secondly as the dyestuff is only adsorbed on the very thin outer cuticle layer, giving a very small volume to be extracted for analysis (Fig. 1B). To overcome these limitations, a combination of Photo Diode Array-Ultra Performance Liquid Chromatography (PDA-UPLC) and Raman Spectroscopy was used to characterise the dye sources either from micro samples, or completely non-invasively. This is thefirst application of PDA-UPLC to analyse quillwork, using a method recently developed for the study of historical textiles,[16] which provides a limit of
☆ Selected papers presented at TECHNART 2015 Conference, Catania (Italy), April 27– 30, 2015.
⁎ Correspondence to: National Museums Scotland, Collections Services Department, 242 West Granton Road, Edinburgh, EH5 1JA, UK
⁎⁎ Corresponding author.
E-mail addresses:l.troalen@nms.ac.uk(L.G. Troalen),Alison.Hulme@ed.ac.uk
(A.N. Hulme).
http://dx.doi.org/10.1016/j.microc.2015.11.053
0026-265X/© 2015 The Authors. Published by Elsevier B.V. This is an open access article under the CC BY license (http://creativecommons.org/licenses/by/4.0/).
Contents lists available atScienceDirect
Microchemical Journal
detection (LoD) in the ng range. The presence of residual metallic mor-dants was investigated using a combination of Inductively Coupled Plas-ma Optical Emission Spectroscopy (ICP-OES), and the non-invasive techniques Particle Induced X-Ray Emission (PIXE) and Rutherford/ Elastic Backscattering Spectrometry (RBS/EBS). PIXE analysis was used to identify and quantify minor and trace elements present on the sur-face of the quills including S, K, Ca, Fe, Cu, Cr and Sn. RBS/EBS analysis was used to provide depth-resolved information on the distribution of heavy elements in the light keratin matrix. Although PIXE and to a lesser extend RBS techniques are well established for the study of museum ob-jects,[17–19]their application to organic-based materials is much more limited[20]. Finally, the sensitivity of the quill specimens to photo-degradation was evaluated using Micro-Fade Testing (MFT), a tech-nique which allows the measurement of light-induced colour changes
[21–23]. As well as providing new information about the historic dyeing methods used in the production of these early artefacts, this multi-analytical study also presents a new approach for the study of quillwork which can be used to inform future display regimes to ensure the best long-term preservation of this type of collection.
2. Materials and methods 2.1. Dyeing processes and extraction 2.1.1. Reference specimens
Porcupine quills (Erethizon sp.) purchased from Native American artist Sarah Tronti were scoured and then dyed with either (i) cochineal (Dactylopius coccus C.) purchased from DBH Ltd Poole England, or (ii) turmeric (Curcuma longa L.) purchased from George Weil & Sons Ltd. Mordants, including alum, copper(II) sulfate, tin(II) chloride, iron(II) sulfate, chromium(IV) oxide, and cream of tartar were purchased from George Weil & Sons Ltd. Typically, dry quills (0.3 g) were dyed in a solution containing dyestuff (33 wt.%) and metal-lic mordants (25 wt.% alum, or 5–6 wt.% otherwise) for 1 h at 85–90 °C, as is traditionally reported for wool dyeing[24].
2.1.2. Extraction protocol for dye analysis
Reference and historical dyed porcupine quills (0.1–0.5 mg) were extracted with 37% HCl:H2O:MeOH [200μL, 2:1:1 (v/v/v)], at 100 °C
for 10 min. After ambient cooling to room temperature, the extract was centrifuged for 10 min at 10,000 rpm and thenfiltered directly into Waters UPLC vials® using a PTFE Phenomenex syringe filter (0.2μm, 4 mm). The extract was then cooled with liquid nitrogen and dried under vacuum using a freeze drier system. The dry residue was then reconstituted with H2O:MeOH [40μL, 1:1 (v/v)] — allowing a
single injection of 10μL, see[16]. Samples containing turmeric were ex-tracted with dimethyl sulfoxide (DMSO) [50μL] at 100 °C for 60 min followed byfiltration using a PTFE Phenomenex syringe filter (0.2 μm, 4 mm) allowing 10μL injection.
2.1.3. Extraction protocol for ICP-OES analysis
A selection of historical dyed porcupine quills (1.0 ± 0.1 mg) were extracted with 37% HCl:H2O:MeOH [200μL, 2:1:1 (v/v/v)], at 100 °C
for 10 min. The extract wasfiltered with a polyethylene filter (55 μm, 5 mm) from Crawford Scientific™. The frit was rinsed with methanol (200μL) and the combined filtrates were then diluted using a solution of 37% HCl:H2O [ca. 5 mL, 2:98 (v/v)] to give afinal mass of 5.0000 g
solution. The diluted extracts of the selected samples were analysed in triplicate and the mean concentration of Sn and Cu in each solution (per mg of quill) was calculated.
2.2. Dyestuff analysis 2.2.1. Reagents and calibration
All the standards were purchased from Sigma-Aldrich and ExtraSynthese, France with a dye content ranging between 90 and 97%. Calibration was achieved using a selection offlavonoid and isoflavonoid dyes, see[16]and additionally: (a) a solution of carminic acid (1) (1.00 ± 0.01 mg) in H2O:MeOH [25 mL, 1:1 (v/v); equivalent to
40μg mL−1]; (b) a solution containing juglone (2) and curcumin (7)
(0.50 ± 0.01 mg of each standard) in H2O:MeOH [25 mL, 1:1 (v/v);
equivalent to 20μg mL−1]; (c) a solution containing alizarin (6) and
purpurin (8) (0.20 ± 0.01 mg of each standard) in H2O:MeOH [10 mL,
1:1 (v/v); equivalent to 20μg mL−1]. Diluted solutions at concentrations of 20, 10, 5, 1, 0.5, 0.1, 0.05, 0.02 and 0.01μg mL−1, were prepared using
calibrated micro-pipettes.
2.2.2. Ultra performance liquid chromatography PDA-UPLC
A Waters Acquity UPLC® system was used with a Waters PDA detec-tor (250 to 500 nm). Data were collected and processed by Waters Empower 2 software and Origin 8.5 (OriginLab, Northampton, MA, USA). The method used a PST BEH C18 (130 Å) reverse phase column, 1.7μm particle size, 150 × 2.1 mm (length × i.d.), set-up with inline fil-ter. The total run time was 37.33 min at aflow rate of 250 μL min−1and
the column was maintained at 55 °C. A binary solvent system, was used; A: 0.02% aqueous HCOOH (pH 3), B: MeOH. The elution program was isocratic for 3.33 min (77A: 23B) then a linear gradient from 3.33 min to 29.33 min (10A: 90B) before recovery of the initial conditions over 1 min and equilibration over 7 min. For details of the experimental
Fig. 1. (a) Specimens of Athapaskan quills exhibiting blue to red colours: from left to right B1 bright blue, B17B dark green, B1 spotted blue, B17A dark green, B3 light green, B4 yellow (1), B4 yellow (2), B8 orange (1), B8 orange (2), B2 red (1), B2 RED (2), B6 red (1) (Acc. N°: A.848.15), © National Museums Scotland; (b) Stereomicroscopic observation of a section of a mod-ern reference quill dyed with cochineal showing the thin dyed cuticle layer (c. 60μm) and undyed cortex.
conditions used to extract reference and historical dyed porcupine quills, see[16].
2.2.3. Raman spectroscopy
Historical blue quills were further analysed with a Horiba XploRa Raman-Microscope equipped with three lasers working at 532, 638 and 785 nm. An edgefilter prevents the laser wavelength entering the CCD detector. The 785 nm laser with 90 nW was used with its power reduced to 1% byfilters, unless otherwise stated. A × 50 magnification objective was used to visualise the sample and to focus the laser on the object surface. A multi window acquisition mode was used; acquiring 3 × 2 spectral region for 600 s. Background subtraction and a smoothingfilter were then applied to the spectra.
2.3. Mordant analysis
2.3.1. Particle induced X-ray emission and Rutherford backscattered spec-trometry (PIXE/RBS)
Analyses were performed at the external beamline of the AGLAE fa-cility with a 3 MeV proton beam and afinal analytical spot of 50 μm, two Si(Li) detectors for PIXE analysis (nofilter for the low energy detector; 125μm Be filter and 28.5 mm air for High Energy detector) and a PIPS charged particle detector in IBM geometry, with a scattering angle of 150° for RBS analysis. Measurements were undertaken in He-rich atmo-sphere. To reduce beam damage, a beam current of 3–6 pA was used and an area of 100 × 500μm was scanned for an average of 4–5 min. Quan-titative analysis was performed in trace mode using GUPIXWIN 2.1[25]
and TRAUPIXE[26]software, modelling a thick layer of keratin using the elements C, H, N, O, S in proportion to their reported relative wt%[27]. Because of the detector geometry and larger active area (30 mm2), the
High Energy detector provided better statistical data, allowing the quantification of elements above S (Z = 16) present in the reference and historical porcupine quill specimens. Due to the lower statistical data obtained with the Low Energy Detector (10 mm2), the quanti
fica-tion of Na (Z = 11) and Al (Z = 13) are not discussed in this paper. A Dr-N certified standard was used to improve the quantification on the Low and High Energy detectors. RBS spectra were simulated with SIMNRA V6.5 software[28]and non-Rutherford reactions for the light elements in keratin (C, N, O) were added to the SIMNRA simulation[20]. 2.3.2. Inductively coupled plasma optical emission spectroscopy (ICP-OES) A selection of historical quills were analysed by ICP-OES using a Perkin Elmer Optima 5300 DV, employing an RF forward power of 1400 W, with argon gasflows of 15, 0.2 and 0.75 L min−1for plasma,
auxiliary, and nebuliserflows, respectively. Using a peristaltic pump, sample solutions were taken up into a Gem Tip cross-Flow nebuliser and Scotts spray chamber at a rate of 1.50 mL min−1. The system was calibrated using two standard solutions, one of copper and the other one tin, both at 1000μg mL−1. Calibration curves were obtained by
pre-paring a range of concentrations with calibrated micro-pipettes, allowing the analysis of concentrations ranging between 200 and 0.02μg mL−1. Two wavelengths were selected: 327.393 nm for the
analysis of copper(II) and 283.994 nm for the analysis of tin(II). Three replicates were run per sample.
2.4. Micro-fade testing (MFT)
An Oriel® Fading Test System (model 80190) was used with a mod-ified probe head that was upgraded by an endoscope camera for better sample positioning. For irradiation of the sample under 0° (angle to the surface normal), a 75 W xenon arc lamp was used. The reflection spectra were taken at 45° and were recorded with a photodiode array detector (control development, model PDA-512). The light line is viafibre optics. The irradiated area has a diameter of ca. 0.4 mm. The intensity of light at the illuminated spot was approximately 3–4 Mlx. The reflected light was measured constantly with an integration time of 6 ms and 10
spectra were averaged. From these spectra colour values in the CIELAB colour space where calculated using an illuminant and observer combi-nation of D65 and 2°, respectively. The colour difference to the initial (unfaded) measurement was given in colour difference value of CIE ΔE 2000 according to the recommendation of the International Com-mission on Illumination (ComCom-mission Internationale de l'Éclairage— CIE)[29].
The fading results were compared to ISO blue wool (BW) standard materials which have a known light fastness on a scale from BW 1 to BW 8, with BW 1 being the most light-sensitive. All samples were mea-sured for 60 min in an environment of about 50–55% RH and 20–24 °C. 3. Results and discussion
Porcupine quills have a similar structure to otherfibres, such as wool or hair, which are based on hardα-keratin[4,5]. X-ray diffraction stud-ies have shown that porcupine quills have a highly crystalline structure, with the external layer of the quill (cuticle) being less ordered com-pared to the internal layer of the quill[30]. Although there are extensive studies on the properties of wool and hairfibres, or feathers, especially with regard to their uptake of dyes and metal ions[31–34], there are only a very limited number of studies on porcupine quills and their dye-ing properties[6,7]. In contrast to woolfibres, where the dyestuff in evenly distributed through thefibre, generally only the thin cuticle layer of quills interacts with the dyebath (Fig. 1b) and adsorbs the dye-stuffs and metal ions. Similarly to wool and hairfibres, this cuticle layer is reported to be slightly richer in sulfur[35]and can range from 30– 100μm depending on the size of the quills (ESI 3).
3.1. Dye analysis
Prior to the analysis of historical artefacts, a UPLC method for dye-stuff identification in quillwork was developed, which would accommo-date the limitations of sample size and volume. The UPLC method included dye sources which were anticipated to be found in these late 19th century specimens such as alizarin, purpurin, indigo and the tan-nin juglone, all characterised in Eastern Woodlands quillwork;[6,7]
the dyes carminic acid and curcumin, which are included in the NMS purchase records for these specimens;[15]and theflavonoids luteolin, apigenin and genistein, which are present in a wide range offlavonoid dye sources[1,16,36].
For all the dye standards the average variation in retention time in 12 measurements by PDA-UPLC ranged between 0.04–0.06%. The limits of detection (LoD) and limits of quantification (LoQ) were calculated based on the average value of the baseline noise (Hnoise) of several
sol-vent blanks, considering all data points. The baseline of the UV detector at 254 nm averaged (9 ± 1) × 10−4AU, resulting in detection limits ranging from 0.5 ng for genistein (4) to 5.1 ng for purpurin (8) for an in-jection volume of 5μL, while the LoD of curcumin (7) was calculated at 450 nm and averaged 4.0 ng. (Table 1)
Table 1
Dye components used to calibrate the UPLC system with calculated limits of detection (LoD), limits of quantification (LoQ) and UV/Vis maximum absorptions in Methanol:Water. (Rt= retention time; sh = shoulder).
Component Rt (min) λ (nm) LoD [LoQ] (ng) λmax(MeOH:H2O) (nm) Carminic acid (1) 5.80 254 1.9 [5.9] 276, 312 (sh), 493 Juglone (2) 12.10 254 2.2 [6.6] 249, 330 (sh), 408 (sh), 424 Luteolin (3) 13.47 254 0.9 [2.6] 252, 291 (sh), 349 Genistein (4) 14.03 254 0.5 [1.6] 260, 332 (sh) Apigenin (5) 15.26 254 1.9 [5.7] 267, 300 (sh), 338 Alizarin (6) 17.70 254 0.8 [2.3] 230 (sh), 248, 280, 433 Curcumin (7) 20.41 450 4.0 [12.1] 264, 429 Purpurin (8) 20.77 254 5.1 [15.3] 256, 296, 456, 481, 515 (sh)
A reference quill dyed with American cochineal (Dactylopius coccus Costa) and 18 red and orange coloured Athapaskan porcupine quills were acid hydrolysed for PDA-UPLC analysis. In all these samples carminic acid (1) was found associated with the dye components dcII, dcIV, dcVII andflavokermesic acid that are known to occur in cochineal species from South America[36–39]. An unknown red dye component (Fig. 2a) was additionally observed in most of the historical samples. A complementary Mass Spectrometric study would be necessary to sug-gest a structure for this component, but UV–Vis spectra indicate that it is related toflavokermesic acid. (ESI 1) The relative amounts of dcII and carminic acid were found to be quite variable in the historical sam-ples, which could possibly relate to dyeing practices, as has been ob-served in the over-dyeing of textiles withflavonoid dye sources[16]. A reference quill dyed with turmeric (Curcuma longa L.) and 12 yellow, orange and green coloured Athapaskan porcupine quills were extracted with DMSO. The presence of bisdesmethoxycurcumin (7b), desmethoxycurcumin (7a) and curcumin (7) in these samples was characterised by PDA-UPLC (Fig. 2a and ESI 2); as with the acidic extrac-tion condiextrac-tions (HCl:H2O:MeOH), carminic acid (1) was also found in
the orange samples. In all these samples bisdesmethoxycurcumin (7b) was observed to be the main dye component extracted. This varied from data published for turmeric rhizomes from India and China,[40, 41]which exhibit higher levels of curcumin (7). The differences ob-served could reflect a higher affinity of bisdesmethoxycurcumin for the quill substrate (Fig. 2c). The brighter shades of green and blue
were obtained by an over-dyeing process with the sulfonated indigo carmine dye which was evidenced by Raman Spectroscopy (Fig. 2b).
The exclusive use of American cochineal instead of madder species, and of indigo carmine instead of indigo is in sharp contrast to results ob-tained in previous studies on pre-1850s Eastern Woodlands quillwork
[6]. The semi-synthetic dye indigo carmine would have been traded from Europe, where it was available and used for textile dyeing from 1770 until the beginning of the 20th century[42]. Since indigo carmine does not require a vat dyeing process it would have been easier to use than indigo, allowing the production of more intense shades of blue. The highly variable diarylheptanoid content[40,41]combined with the unknown affinity of the dyestuff components for the quill substrate, meant that it was not possible to attribute the turmeric compositions to a specific source (ESI 2), although it is likely that the turmeric originated from India[1,24]and reached the Athapaskans via trade into Europe. 3.2. Metallic mordants
Applications of PIXE to organic based materials are limited and thus it was necessary to evaluate the thickness of keratin being analysed and the limit of detection (LoD) of various metallic mordants to be detected. The range of the beam in the matrix of keratin was determined as 136μm using TRIM software (SRIM 2003 version),[44]and the effective depth values for S, K, Ca, Cr, Fe, Cu, Zn, Sn, As and Hg were calculated with GUCSA program in the GUPIXWIN 2.1 software package and vary
Fig. 2. (a) (i) Acid hydrolysed extract of a red quill with the identification of dcII, carminic acid (1), dcIV, Flavokermesic acid (Fk) and an unknown dye component (*); (ii) DMSO extract of a yellow quill with the identification of bisdesmethoxycurcumin (7b), desmethoxycurcumin (7a) and curcumin (7). Chromatograms were monitored at 430 nm (cochineal) and 450 nm (turmeric) and have been offset for clarity; (b) Raman spectra recorded with 785 nm laser of (i) a blue historical quill and (ii) indigo carmine reference. Spectra have been offset for clarity; (c) Ternary diagram of the relative amounts (% 450 nm) of bisdesmethoxycurcumin (7a), desmethoxycurcumin (7b) and curcumin (7) characterised in DMSO extracts of reference and Athapaskan quills, compared to the rhizome composition of Curcuma Longa L. from China, Burma and India (wt%)[40,41,43]. The red circle indicates where the composition of extracts from reference and historical quills cluster.
between a minimum of 52μm for S (Kα) and a maximum of 80μm for
Hg (Lα) (Table 2). Since the average thickness of the cuticle was
deter-mined as 58μm by SEM analysis (ESI 3), these effective depth values show that the concentration of mordant determined by PIXE experi-ments represents the average value of the cuticle layer. In some cases however, where the cuticle is thinner, PIXE values will be averaged from the contribution of both the cuticle and the cortex. The LoD of each element was averaged from 70 measurements using GUPIXWIN 2.1 software[25]and ranged between 3 ppm for Fe (Kα), 110 ppm for
the Sn (Lα) and 520 ppm for the Sn(Kα) lines. The quantification of Sn
was therefore undertaken using the Sn(Lα) line, which presented
lower LoD and better statistical data. The unfolding of Sn(La) and
K(Ka) was achieved by GUPIXWIN 2.1 software.
A small set of modern quills prepared with dyebaths containing combinations of cream of tartar, alum, Cr, Fe, Cu and Sn were investigat-ed by PIXE. Traces of Zn were detectinvestigat-ed in all the modern quills, including a scoured one, at an average concentration of 50 ppm, possibly corre-sponding to contamination. The levels of S were found to range between 2 and 4 wt.%, as would be expected in keratin. K levels were found to be significantly increased (2000 to 4000 ppm) for the quills where cream of tartar was added to the dyebath, while traces of Cr, Fe, Cu and Sn were detected at concentrations ranging from ~ 100 ppm to N1000 ppm, allowing differentiation between the individual dyebath processes (Table 3).
Around 70 historical quills were analysed, covering all the different colours observed in the specimens (Fig. 3a). The elemental data for a se-lection of quills is presented inTable 3. The S level was generally found
to range between 1.5 and 2.5 wt.%. A few green and blue quills exhibit up to 4.0 wt.% of S (Fig. 3b), which might be related to the presence of the sulfonated indigo carmine dye or to the use of sulfur-containing mordants such as alum. Traces of Zn were also identified at a concentra-tion below 100 ppm.
For the coloured historical quills, Fe, Cu and Sn were identified in varying amounts, while levels of K were found to be higher in blue, yel-low and green hues reaching 4000 ppm, with levels as high as 8000 ppm for two of the darker green quills (Fig. 3b). These results are in sharp contrast to earlier Eastern Woodlands quillwork, where XRF analysis re-vealed the presence of only Fe (and sometimes Cu) residues in a few ob-jects[7]. In the Athapaskan samples, Cu was found predominantly in the darker shades of blue and green to a maximum concentration of 6000 ppm, while Fe was in generally below 200 ppm with a few excep-tions where it reached ~ 1000 ppm (Fig. 3c & d). The level of Sn was found to be significantly higher in the red and oranges hues and one bright blue quill, ranging from 4000 to 15000 ppm (Fig. 3d). These levels are significantly higher than the levels observed in modern quills pre-pared with 5–6 wt.% of mordant. In order to confirm these ranges of concentrations, a selection of samples were additionally analysed by ICP-OES, a technique routinely used for the characterisation of metals in textile materials[46]. The values obtained cannot be directly com-pared to PIXE values, as surface heterogeneity is an important consider-ation and a standard mass of quills (1 mg) was extracted for ICP analysis. However, the values showed some correlation for both Cu and Sn analysis, with the level of Sn reaching 2.9 × 10⁴μg g−1
(or ppm) for the most concentrated samples.
Table 2
Effective depth values calculated with the GUCSA program of the GUPIXWIN 2.1 software package[25], representing the thickness inμm from which 95% of the detected X-rays are pro-duced and associated limit of detection (LoD) calculated with GUPIXWIN for each element analysed in the quills, modelling a thick target of keratin[27,45]. PIXE conditions: 3 MeV protons, 125μm Be filter and 28.5 mm air for High Energy Si(Li) detector.
Keratin (1.3 g cm−3) C (50.5 wt.%), O (22 .0 wt.%), N (16.5 wt.%), H (6.8 wt.%), S (3.7 wt.%) Element S (Kα) K (Kα) Ca (Kα) Cr (Kα) Fe (Kα) Cu (Kα) Zn (Kα) Sn (Kα) Sn (Lα) Hg (Lα) As (Lα) Effective depth (μm) 52 68 73 79 79 79 78 72 70 80 77 LoD (ppm) 32 23 31 6 3 5 5 520 110 13 6 Table 3
PIXE elemental data obtained with High Energy detector for a selection of modern quills and historical quills. In addition, the concentrations of Cu(II) and Sn(II) expressed inμg g−1(or
ppm) obtained by ICP-OES are presented for comparison. PIXE analysis entries marked“–” correspond to a level below LoD; ICP-OES entries marked “–” were not analysed.
PIXE ICP-OES Entry S (wt%) K (ppm) Ca (ppm) Cr (ppm) Fe (ppm) Zn (ppm) As (ppm) Hg (ppm) Sn (ppm) Cu (ppm) Sn(II) (μg g−1) Cu(II)(μg g−1)
Modern reference quills
Scoured quill 2.8 – 350 – 10 68 – – – – --
--Al, K, Cr 1.6 3944 379 1280 8 87 – – – 5 --
--Al, K, Sn 2.3 4173 702 – 8 55 – – 480 7 --
--Cu 3.1 380 111 – – 32 – – – 224 --
--K, Fe 4.0 2460 109 – 101 18 – – – – --
--Athapaskan quills (A.848.15)
B1 bright blue 1.8 1353 458 – 39 25 – – 592 859 -- --B1 spotted blue 3.4 1138 140 – 66 – – 122 580 404 -- --B2 red (1) 1.6 69 125 – 688 16 – – 7133 980 1.7 × 10⁴ 3.0 × 10³ B2 red (2) 1.3 160 220 – 70 45 – – 14900 200 2.9 × 10⁴ 2.0 × 10³ B3 light green 1.8 350 230 – 115 31 – – 1791 252 -- --B4 yellow (1) 1.4 2040 480 – 815 37 – – 826 1725 1.4 × 10⁴ 3.0 × 10³ B6 red (1) 1.8 509 546 – 71 17 – – 2492 288 9.0 × 10³ 2.0 × 10³ B6 red (2) 1.7 254 653 – 68 41 10 42 1801 380 1.0 × 10⁴ 1.0 × 10³ B8 orange (1) 1.6 365 137 – 59 52 – – 4315 250 1.1 × 10⁴ 2.0 × 10³ B8 orange (2) 1.3 230 224 – 69 40 – 71 7965 239 1.4 × 10⁴ 1.0 × 10³
B9A bright blue 2.2 1388 508 – 222 16 – – 1012 323 2.0 × 10³ 4.0 × 10²
B11A colourless 2.0 772 261 – 62 32 – – 537 958 --
--B12A colourless 1.9 419 372 – 90 61 – 30 990 432 --
--B17A dark green 2.8 6779 1406 – 358 100 – 78 563 1551 5.0 × 10³
1.0 × 10³
B17B dark green 2.2 8038 942 – 444 150 – 171 14500 5780 1.2 × 10⁴
The analysis of“colourless” quills also exhibited traces of Sn and Cu suggesting that either these quills were pre-mordanted or that these were previously dyed and are now extremely faded. Finally, As and Hg were found in only a few quills, with most analyses falling below the LoD, indicating that, in contrast to many organic collections in museums of this period, these specimens were unlikely to have been treated in the past with inorganic pesticides containing mercury and arsenic[47,48].
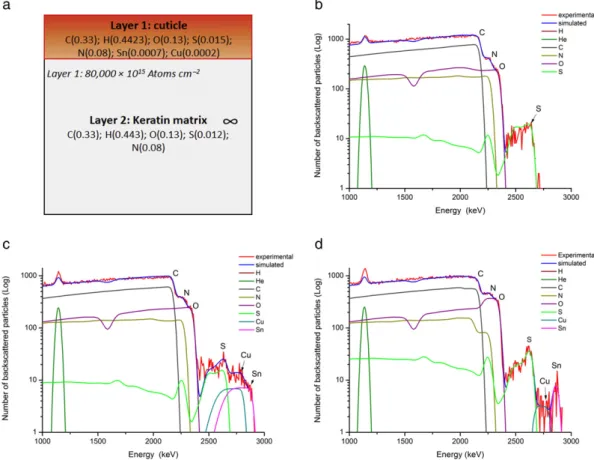
The quills were simultaneously analysed by RBS which provided ad-ditional information on the depth-profiling of the mordant in the cuticle layer. The RBS spectra were treated independently to the PIXE data. For the majority of the samples (modern and historical) a two-layered model was used for simulation with SIMNRA software comprising a thin layer of keratin containing traces of heavy metals (Layer 1) over an infinite layer of keratin (Layer 2) (Fig. 4a). The thickness of Layer 1 was evaluated to ~ 80,000 × 1015Atoms cm−2which is equivalent to 9μm considering the atomic composition and density of the keratin (ESI 4). This model showed a good correlation for the RBS spectra ob-tained from scoured (Fig. 4b) and mordanted modern quills, as well as dyed Athapaskan quills (Fig. 4c). For all the samples, the composition of Layers 1 & 2 was found to closely match the expected atomic concen-trations for keratin with the addition of traces of mordant (ESI 4). In all the samples analysed, the level of S and mordant was found to be higher in Layer 1 (4 to 5 wt.% for S) than the average values determined by PIXE (1.5 to 2.5 wt.% for S), see ESI 4. While a higher level of S is expected in the outer cuticle,[35]the higher levels of mordants could possibly cor-respond to a deposition on the surface of the cuticle. Finally, for a few blue and green quills a three-layered model was used (Fig. 4d), compris-ing of a very thin layer of keratin rich in S with traces of Sn and Cu (Layer 1, 1–2 μm), a second layer with a lower level of S and traces of Cu only (Layer 2, 3μm) over an infinite layer of keratin (Layer 3), see ESI 4. These samples showed a clear increase in S level at the surface (up to 13 wt.% in Layer 1), confirming the observations made by PIXE and supporting the hypothesis that there is either indigo carmine dye or
the deposition of a sulfur-containing mordant on the surface of the cu-ticle. The presence of Sn in Layer 1 only might reflect the use of multiple dyebaths with different mordants combinations, resulting in the forma-tion of successive thin layers at the surface of the quill.
3.3. Micro-fade testing
A selection of coloured quills were tested for their photo-sensitivity by Micro-Fade Testing (MFT), as shown inFig. 5a andTable 4. The MFT determines the photosensitivity of the measured spot as a colour change as perceived by the human eye (and not as a change of colourant concentration). The photo-sensitivity not only depends on the colourant and supporting materials but can also be influenced by mor-dant, surface particularities, chemical environment (air pollutants, oxy-gen level humidity) and colourant concentration. As a result MFT measurements are variable and require multiple repeats to obtain re-producible results which may be accurately interpreted.Table 4 sum-marises the MFT measurements; the results of one sample, B1 Spotted blue, have been omitted since the repeat variability was unusually high, probably due to the heterogeneity of the surface which was al-ready visually observable by the speckled colour effect of the quill.
It can be seen that, with the exception of B2 red (2), all the quills fall into (or very close to) the Blue Wool class 1 to 3. Materials of this class are considered to be highly responsive to light following the categories given in CEN/TS 16163:2014 [49] and CIE 157:2004 [50]. It is advised that such materials should be illuminated at a maximum recommended-level of 50 lx and only for a limited time span not ex-ceeding 15,000 lx h in a year.
It was observed that the concentration or type of mordant did not af-fect the MFT results as much as the type of dyestuffs used. As expected, indigo carmine and turmeric coloured quills [B1 blue, B3 blue, B4 yellow (1)] show the highest photo-sensitivity due to the low colourfastness of these colourants[22]. In mixtures the colours tend to be slightly more
Fig. 3. (a) High Energy PIXE spectrum for the B2 red (1) historical sample: Athapaskan quill (red line) with Gaussianfit obtained by GUPIXWIN (dotted line) identifying the presence of Fe, Cu and Sn; (b) comparison of the level of K (wt%) expressed as a function of S (wt%); (c) comparison of the level of Fe (wt%) expressed as a function of Cu (wt%); (d) comparison of the level of Sn (wt%) expressed as a function of Cu (wt%). For all graphics data were obtained with high energy detector and the Athapaskan quills are classified by colour.
stable as can be seen for samples B3 light green and B8 orange (1). In B8 orange (1), the turmeric is mixed with the more stable red American co-chineal which results in a colour that falls in the BW 3 class and may be categorised as a medium light responsive material. The photosensitivity of quill B8 orange (1) therefore lies between quills dyed with one of these colourant, i.e., American cochineal [B2 red (2) and B6 red (1)] and turmeric [B4 yellow (1)]. As the American cochineal is less respon-sive, a colour shift from orange to red results from the MFT process as indicated inFig. 5b because the more responsive yellow turmeric fadesfirst. The reason for the smaller colour change of the mixed dye
is probably not a stabilising effect of the American cochineal on the tur-meric, but the result of a smaller perceptual colour change due to the persisting colour of the American cochineal.
4. Conclusion
This study of Athapaskan quillwork, using a combination of tech-niques, has provided important new information on the dyeing process-es used in the Subarctic in the 1860s. Firstly PDA-UPLC was succprocess-essfully applied to micro-samples of porcupine quillwork allowing the dye
Fig. 4. (a) Two-layered model used for SIMNRA simulation; with atomic compositions and layer thicknesses in Atoms cm−2provided by the SIMNRA simulation (Layer 1 roughness of 40,000 equivalent in × 1015
Atoms cm−2); (b) RBS spectrum and SIMNRA simulation using the two-layered model for a scoured modern quill; (c) RBS spectrum and SIMNRA simulation using the two-layered model for the B1 red (2) historical quill confirming the presence of Cu and Sn mordants; (d) RBS spectrum and SIMNRA simulation using a three-layered model for the B1 Spotted Blue historical quill, showing the presence of a thin S and Sn-rich layer at the surface.
Fig. 5. (a) Colour change (Delta E) expressed as a function of time (min) for the Athapaskan quills investigated by MFT. Sample codes correspond toTable 4, and are as follows: (2) B2 red (2); (3) B3 Light green; (4) B3 blue; (6) B4 yellow (1); (7) B8 orange (1); (8) B17A dark green; (b) binary diagram showing the colour changes in samples (6) B4 yellow (1), (5) B6 red (1), and (7) B8 orange (1) during fading.
sources to be characterised. This revealed the unexpected use of imported European dyes in the Athapaskan quillwork, in sharp contrast to the local dye sources found in Eastern Woodlands quillwork pre-dating 1856[6,7]. Secondly the combined use of PIXE and RBS allowed the concentrations of various mordants (K, Ca, Fe, Cu and Sn) in the quills to be determined, providing an alternative non-destructive meth-odology for the study of keratin-based materials. RBS was applied for thefirst time to the investigation of quillwork and it allowed additional information on the depth-profiling of mordants at the surface of the quills to be obtained. Several quills presented a more complex layered system when analysed by RBS, which might be related to the use of mul-tiple dyebaths with different mordant combinations, resulting in the formation of successive thin layers containing metallic residues at the surface of the quill. These results present a promising opportunity for the study of quillwork and related keratinous materials, and would need to be further investigated by analysing modern quills prepared with successive dyebaths.
In all the Athapaskan specimens investigated, two to three metallic mordants (Fe, Cu, Sn) were found to be combined, and by changing the concentrations of these mordants brighter and darker hues were ob-tained from the same dyestuff combination. The high levels of metallic mordants observed in several of the specimens suggest that the effect of the mordants was appreciated and that they were deliberately added to the dyebath to change the property of the dyestuffs. This trans-fer of European dyeing practices might not be surprising given that there is evidence that European dyes and mordants were traded to Nova Scotia from the 1830s,[51]suggesting that by 1862 these mate-rials would also have been available in the Northern territories. Finally, the data obtained from the MFT confirmed previous findings which doc-ument the photosensitivity of Subarctic Athapaskan artefacts[21]. We expect that the combination of techniques presented in this paper will be adopted for the study of quillwork and related collections.
Acknowledgements
We thank Hamish McNab (University of Edinburgh) for his support and input to this research before his untimely death in 2010; Chantal Knowles and Henrietta Lidchi at NMS (Department of World Cultures) for access and sampling of the Athapaskan collections and Neil McLean (Department of Collections Services) for the photography of the speci-mens. Jim Tate (NMS) and Ina Reiche (Rathgen-Forschungslabor) are gratefully acknowledged for supporting this research, the AGLAE team at C2RMF for assistance with PIXE/RBS measurements and Lorna Eades (University of Edinburgh) for ICP-OES measurements.
Financial assistance was provided through the Science and Heritage Programme (studentship to LGT, grant ref. CDA08/411) and National Museums Scotland. Additionalfinancial support was provided by the Access to Research Infrastructures activity in the 7th Framework Programme of the EU (CHARISMA grant agreement n. 228330) for PIXE/RBS measurements (grant to LGT), and the COST Action TD1201, Colour and Space in Cultural Heritage (grant to JdHM).
Appendix A. Supplementary data
Electronic Supplementary Information (ESI) available: PDA-UPLC analysis of red and orange quills; PDA-UPLC analysis of yellow and green quills; natural dyes; SEM-EDX analysis; Rutherford Backscatter-ing Spectrometry. Supplementary data associated with this article can be found in the online version, athttp://dx.doi.org/10.1016/j.microc. 2015.11.053.
Primary datafiles for this work are available at the Edinburgh DataShare.
References
[1] E.S.B. Ferreira, H. McNab, A.N. Hulme, A. Quye, The natural constituent of historical textile dyes, Chem. Soc. Rev. 33 (2004) 329–336.
[2] W.C. Orchard, The Technique of Porcupine-quill Decoration among the North American Indians, Kessinger Publishing, 1916 (reprinted 2009).
[3] J. Thompson, Fascinating Challenges: Studying Material Culture with Dorothy Burnham, Canadian Museum of Civilization, 2001.
[4] I. MacArthur, Structure ofα-keratin, Nature 152 (1943) 38–41.
[5] R.D.B. Fraser, T.P. McRae, G.E. Rogers, Keratins, their Composition, Structure and Biosynthesis, Thomas Publishers, Springfield Ill., 1972
[6] C. Cole, S. Heald, The history and analysis of pre-aniline Native American quillwork dyes, Textile Society of America Symposium Proceedings, 2010 (Paper 14.http:// digitalcommons.unl.edu/tsaconf/14).
[7] C.L. Cole, The Contextual Analysis of Pre-1856 Eastern Woodlands Quillwork Dyes through Identification by Liquid Chromatography — Mass Spectrometry(Ph.D. (Ph.D. thesis) University of Delaware, 2010.
[8] R. Bohr, A. Lindsay, Dyeing commodities whether in Roote orfloure: reconstructing aboriginal dye techniques from documentary and museum sources, Mater. Cult. Rev. 69 (2009) 21–35.
[9] D. Idiens, The Athapaskan Indian collection in the Royal Scottish Museum, The Athapaskans: Strangers of the North. An international travelling exhibition from the collection of the National Museum of Man, Canada, and the Royal Scottish Museum, National Museum of Man, Ottawa 1974, pp. 15–16.
[10] C. Knowles, Objects journeys: Outreach work between National Museums Scotland and the Tłı̨chǫ, in: K.L. Brown (Ed.), Material Histories, Marischal Museum, University of Aberdeen 2008, pp. 37–56.
[11] J. Thompson, Pride of the Indian Wardrobe, Northern Athapaskan footwear, University of Toronto Press, for the Bata Shoe Museum, 1990.
[12] J. Thompson, From the Land: Two Hundred Years of Dene Clothing, Canadian Museum of Civilization, 1994.
[13] K.C. Duncan, Northern Athapaskan Art: A Beadwork Tradition, University of Washington Press, Seattle, 1989.
[14] J.R. Forster, A Letter from Mr. John Reinhold Forster, F. R. S. to William Watson, M. D. giving some account of the roots used by the Indians, in the neighbourhood of Hudson's-Bay, to dye porcupine quills, Philosophical Transactions (1683–1775), 621772 54–59 (http://www.jstor.org/stable/106038).
[15]L.G. Troalen, Historic dye Analysis: Method Development and new Applications in Cultural Heritage(Ph.D. thesis) The University of Edinburgh, 2013.
[16] L.G. Troalen, A.S. Phillips, D.A. Peggie, P.E. Barran, A.N. Hulme, Historical textile dye-ing with Genista tinctoria L.: a comprehensive study by UPLC-MS/MS analysis, Anal. Methods 6 (2014) 8915–8923,http://dx.doi.org/10.1039/c4ay01509f.
[17]T. Calligaro, J.C. Dran, J. Salomon, Ion beam microanalysis, in: K. Janssens, R. van Grieken (Eds.), Non-destructive microanalysis of cultural heritage materials, Wilson and Wilson's, comprehensive analytical chemistry, 42, Elsevier, Amsterdam 2004, pp. 227–276.
[18] L. Beck, L. de Viguerie, Ph. Walter, L. Pichon, P.C. Gutiérrez, J. Salomon, M. Menu, S. Sorieul, New approaches for investigating paintings by ion beam techniques, Nucl. Instrum. Methods B 268 (2010) 2086–2091,http://dx.doi.org/10.1016/j.nimb. 2010.02.059.
[19] M. Albéric, K. Müller, L. Pichon, Q. Lemasson, B. Moignard, C. Pacheco, E. Fontan, I. Reiche, Non-invasive quantitative micro-PIXE–RBS/EBS/EBS imaging reveals the Table 4
Dye source, mordant and MFT analysis for a selection of coloured Athapaskan quills. MFT results are the average of 3 measurements obtained after 60 min fading.
MFT entry Description Dye source(s)
UPLC & Raman
Principal mordant(s) PIXE
Fading after 60 min. CIELABΔE 2000
Blue wool category
Athapaskan quills A.848.15
1 B1 blue Indigo carmine K, Sn, Cu 3.1 2–3
-- B1 spotted blue Unidentified K, Ca, Sn, Cu Inconsistent results
--2 B2 red (2) Cochineal Fe, Sn, Cu 0.5 4
3 B3 light green Turmeric & Indigo carmine K, Ca, Fe, Sn, Cu 2.9 3
4 B3 blue Indigo carmine Not analysed 4.6 2
5 B6 red (1) Cochineal K, Ca, Fe, Sn, Cu 1.6 3–4
6 B4 yellow (1) Turmeric K, Fe, Sn, Cu 4.0 2
7 B8 orange (1) Turmeric & Cochineal K, Sn, Cu 2.0 3
lost polychromy and gilding of the Neo-Assyrian ivories from the Louvre collection, Talanta 137 (2015) 100–108,http://dx.doi.org/10.1016/j.talanta.2015.01.029. [20] L. Beck, J.-P. Cuif, L. Pichon, S. Vaubaillon, A. Dambricourt Malassé, R.L. Abel,
Checking collagen preservation in archaeological bone by non-destructive studies (Micro-CT and IBA), Nucl. Instrum. Methods B 273 (2012) 203–207,http://dx.doi. org/10.1016/j.nimb.2011.07.076.
[21] J.M. del Hoyo-Meléndez, M.F. Mecklenburg, A survey on the light-fastness proper-ties of organic-based Alaska Native artifacts, J. Cult. Herit. 11 (2010) 493–499,
http://dx.doi.org/10.1016/j.culher.2010.01.004.
[22] J.M. del Hoyo-Meléndez, M.F. Mecklenburg, An Investigation of the reciprocity prin-ciple of light exposures using microfading spectrometry, Spectrosc. Lett. 4 (2011) 52–62,http://dx.doi.org/10.1080/00387010903508572.
[23]B. Ford, J. Druzik, Microfading: the state of the art for natural history collections, Collect. Forum 27 (2013) 54–71.
[24] D. Cardon, G. du Châtenet, Guide des teintures naturelles. Plante Lichens -Champignons - Mollusques et Insectes, Delachaux et Niestle Paris, 1990.
[25] J.L. Campbell, N.I. Boyd, N. Grassi, P. Bonnick, J.A. Maxwell, The Guelph PIXE software package IV, Nucl. Instrum. Methods B 268 (2010) 3356–3363,http://dx.doi.org/10. 1016/j.nimb.2010.07.012.
[26] L. Pichon, L. Beck, Ph. Walter, B. Moignard, T. Guillou, A new mapping acquisition and processing system for simultaneous PIXE-RBS analysis with external beam, Nucl. Instrum. Methods B 268 (2010) 2028–2033,http://dx.doi.org/10.1016/j. nimb.2010.02.124.
[27] H. Zahn, F.J. Wortmann, G. Wortmann, K. Schäfer, R. Hoffmann, R. Finch, Wool, Ullmann's Encyclopaedia of Industrial Chemistry, vol. 39, Wiley-VCH Verlag GmbH & Co, 2012 548–576,http://dx.doi.org/10.1002/14356007.a28_395. [28] W. Eckstein, M. Mayer, Rutherford backscattering from layered structures beyond
the single scattering model, Nucl. Instrum. Methods B 153 (1999) 337–344,
http://dx.doi.org/10.1016/S0168-583X(98)01011-8.
[29]Commission on Illumination, Standard: colorimetry— Part 6: CIEDE2000 colour-difference formula, CIE ISO 11664-6:20142004.
[30] B. Busson, P. Engström, J. Doucet, Existence of various structural zones in keratinous tissues revealed by X-ray microdiffraction, J. Synchrotron Radiat. 6 (1999) 1021–1030.
[31]J.E. Fergusson, J. Holzbecher, D.E. Ryan, The sorption of copper(II), manganese(II), zinc(II) and arsenic(II) onto human hair and their desorption, Sci. Total Environ. 26 (1983) 121–135.
[32] K. Suyama, Y. Fukazawa, H. Suzumara, Biosorption of precious metal ions by chicken feather, Appl. Biochem. Biotechnol. 57 (58) (1996) 67–74.
[33] P. Kar, M. Misra, Use of keratinfibre for separation of heavy metals from water, J. Chem. Technol. Biotechnol. 79 (2004) 1313–1319.
[34]C.M. Carr, J.C. Evans, W. Roberts, An X-ray photoelectron and electron spin reso-nance study of wool treated with aqueous solutions of chromium and copper ions, Text. Res. J. 57 (1987) 109–113.
[35] J.H. Bradbury, G.V. Chapman, A.N. Hambly, N.L.R. King, Separation of chemically un-modified histological components of keratin fibres and analyses of cuticle, Nature 2010 (1966) 1333–1334,http://dx.doi.org/10.1038/2101333a0.
[36] D.A. Peggie, A.N. Hulme, H. McNab, A. Quye, Towards the identification of character-istic minor components from textiles dyed with weld (Reseda luteola L.) and those dyed with Mexican cochineal (Dactylopius coccus Costa), Microchim. Acta 162 (2008) 371–380,http://dx.doi.org/10.1007/s00604-007-0866-0.
[37]J. Wouters, A. Verhecken, The scale insect dyes (Homoptera: Coccoidea). Species recognition by HPLC diode array analysis of the dyestuffs, Annls. Soc. Ent. Fr. (N.S.), 251989 393–410.
[38]J. Wouters, A. Verhecken, The coccid insect dyes: HPLC and computerized diode-array analysis of dyed yarns, Stud. Conserv. 34 (1989) 189–200.
[39] A. Serrano, M.M. Sousa, J. Hallett, J.A. Lopes, M. Conceição Oliveira, Analysis of natu-ral red dyes (cochineal) in textiles of historical importance using HPLC and multi-variate data analysis, Anal. Bioanal. Chem. 401 (2011) 735–743,http://dx.doi.org/ 10.1007/s00216-011-5094-0.
[40] J. Cheng, K. Weijun, L. Yun, W. Jiabo, W. Haitao, L. Qingmiao, X. Xiaohe, Development and validation of UPLC method for quality control of Curcuma longa Linn.: fast simul-taneous quantitation of three curcuminoids, J. Pharm. Biomed. Anal. 53 (2010) 43–49,http://dx.doi.org/10.1016/j.jpba.2010.03.021.
[41] S. Li, W. Yuan, G. Deng, P. Wang, P. Yang, B.B. Aggarwal, Chemical composition and product quality control of turmeric (Curcuma longa L.), Pharm. Crops 2 (2011) 28–54.
[42]M. de Keijzer, M.R. van Bommel, R. Hofmann-de Keijzer, R. Knaller, E. Oberhumer, Indigo carmine: understanding a problematic blue dye, Stud. Conserv. 57 (2012) 87–95.
[43]G.K. Jayaprakasha, L. Jagan Mohan Rao, K.K. Sakariah, Improved HPLC method for the determination of curcumin, demethoxycurcumin, and bisdemethoxycurcumin, J. Agric. Food Chem. 50 (2002) 3668–3672.
[44] J.P. Biersack, L.G. Haggmark, A Monte Carlo computer program for the transport of energetic ions in amorphous targets, Nucl. Instrum. Methods B 174 (1980) 257–269,http://dx.doi.org/10.1016/0029-554X(80)90440-1.
[45] P. Masson, Density and structure of alpha-keratin, Nature 197 (1963) 179–180.
[46] I. Rezić, I. Steffan, ICP-OES determination of metals present in textile materials, Microchem. J. 85 (2007) 46–51,http://dx.doi.org/10.1016/j.microc.2006.06.010. [47] P.J. Sirois, G. Sansoucy, Analysis of museum objects for hazardous pesticide residues:
a guide to techniques, Collect. Forum 17 (2001) 49–66.
[48] F. Marte, A. Péquinot, D.W. von Endt, Arsenic in taxidermy collections: history, detection and management, Collect. Forum 21 (2006) 143–150.
[49]European Committee for Standardization, Technical specification: conservation of cultural heritage— guidelines and procedures for choosing appropriate lighting for indoor exhibitions, CEN/TS 161632014.
[50] International Commission on Illumination, Technical Report: Control of damage to museum objects by optical radiation, CIE 1572004.
[51]R.H. Whitehead, Micmac quillwork: Micmac Indian techniques of porcupine quill decoration, 1600–1950, Nova Scotia Museum, 1982.