HAL Id: hal-00513703
https://hal.archives-ouvertes.fr/hal-00513703
Submitted on 1 Sep 2010
HAL is a multi-disciplinary open access archive for the deposit and dissemination of sci-entific research documents, whether they are pub-lished or not. The documents may come from teaching and research institutions in France or abroad, or from public or private research centers.
L’archive ouverte pluridisciplinaire HAL, est destinée au dépôt et à la diffusion de documents scientifiques de niveau recherche, publiés ou non, émanant des établissements d’enseignement et de recherche français ou étrangers, des laboratoires publics ou privés.
Influence of ageing.
Sonia Raujol, Florence Pettinari-Sturmel, Joël Douin, Nicole Clément,
Armand Coujou, Didier Locq, Pierre Caron
To cite this version:
Sonia Raujol, Florence Pettinari-Sturmel, Joël Douin, Nicole Clément, Armand Coujou, et al.. A new TEM method for the caracterization of the tertiary γ’ nano-precipitates in a PM disk super-alloy. Influence of ageing.. Philosophical Magazine, Taylor & Francis, 2006, 86 (28), pp.4507-4518. �10.1080/14786430600740658�. �hal-00513703�
For Peer Review Only
A new TEM method for the caracterization of the tertiary γ' nano-precipitates in a PM disk superalloy. Influence of
ageing.
Journal: Philosophical Magazine & Philosophical Magazine Letters Manuscript ID: TPHM-05-Oct-0463.R2
Journal Selection: Philosophical Magazine Date Submitted by the
Author: 04-Apr-2006
Complete List of Authors: Raujol, Sonia; CEMES
Pettinari-Sturmel, Florence; CEMES / CNRS Douin, Joel; CEMES
Clément, Nicole; CEMES COUJOU, Armand; CEMES Locq, Didier; ONERA, DMMP CARON, Pierre; ONERA, DMMP Keywords: microstructural characterization, TEM Keywords (user supplied): disk superalloy
For Peer Review Only
A new TEM method for the characterization of the tertiary
γγγγ'
nano-precipitates in a PM disk superalloy. Influence of ageing
S. RAUJOL1, F. PETTINARI-STURMEL1∗, J. DOUIN1, N. CLÉMENT1, A. COUJOU1 D. LOCQ2, P. CARON2
1 CEMES-CNRS 29, rue Jeanne Marvig, 31055 Toulouse France
2 ONERA/DMMP, 29, avenue de la Division Leclerc, BP 72, 92322 Châtillon France
Abstract
An original method to characterize the γ'-phase tertiary precipitates in a Ni-based superalloy manufactured by powder metallurgy is described. This investigation is made using post mortem transmission electron microscopy (TEM). It is based on the analysis of sheared areas within crept specimens, which allows the precipitates seen by the dislocations in their glide plane to be observed. The characteristics of these nano-precipitates, i.e. their size, their volume fraction and the channel width between them, are determined for two different heat treatments (HT). The results show a wide distribution of the microstructural parameters for a
given HT, but only slight differences between the microstructures produced by the two
different HTs. This microstructural information allows a better understanding of the wide variety of the deformation micromechanisms observed during creep at high temperature. Keywords : TEM microstructural characterisation, bimodal precipitation, disk superalloy. 1. Introduction
The present work is part of recent research on materials for supersonic airplane aeroengines.
The nickel-based superalloy NR3 has been chosen as a candidate for gas turbine disk
application owing to its good tensile and creep strength at 700°C [1]. It is processed by
powder metallurgy and heat treatments which create a bimodal dispersion of γ’-Ni3(Al, Ti)
strengthening particles (L12 structure) imbedded in a f.c.c. γ Ni-based solid solution.
During long-term ageing or working conditions leading to creep deformation, the γ/γ' microstructure changes continuously. This microstructural instability is mainly characterised by the evolution of the smallest particles, called tertiary precipitates. Creep tests performed at 700°C on NR3 specimens with various initial γ/γ' microstructures thus reveal the key role of the tertiary γ' precipitates in the creep behaviour of this material [2]. For example, the complete dissolution of these small precipitates leads to an 80-fold increase of the average creep rate at 700°C and 650 MPa.
To establish accurate relationships between the microstructure, the microscopic deformation micro-mechanisms and the macroscopic creep behaviour, it is therefore important to use a method capable of quantifying precisely the microstructural changes.
The present study is focused on the characterisation of the tertiary precipitates. Three main microstructural parameters, closely correlated with the macroscopic mechanical properties of the alloy, are known to control the deformation micro-mechanisms: the diameter D of the tertiary precipitates, their volume fraction fv and the channel width L between them. They
∗ Corresponding author. Email : florence.pettinari@cemes.fr
3 4 5 6 7 8 9 10 11 12 13 14 15 16 17 18 19 20 21 22 23 24 25 26 27 28 29 30 31 32 33 34 35 36 37 38 39 40 41 42 43 44 45 46 47 48 49 50 51 52 53 54 55 56 57 58 59 60
For Peer Review Only
have to be evaluated with a sufficient accuracy to allow a precise description of their evolution during ageing. In this work, these three parameters were determined using TEM analysis. A new method is proposed and has been carried out for the determination of fv and
L.
2. Material and experimental details
The NR3 superalloy is a powder metallurgy polycrystalline alloy. It was developed by ONERA and produced by Tecphy and Snecma using the following industrial processing
route: i) vacuum induction melted ingot; ii) argon atomization; iii) powder sieving (-200 mesh); iv) hot extrusion; v) isothermal forging. Its chemical composition is given in Table 1.
Insert Table 1 here
To produce the desired initial microstructures, suitable heat treatments were applied on cylindrical rods extracted by spark machining from the as-forged pancake. Two different sequences, both preceded by a supersolvus solution treatment for 2 hours at 1210°C, followed by cooling at 100°C.min-1, were used:
- “standard”: 700°C/24h (Air Cooled) + 800°C/4h (Air Cooled). - “optimised”: 700°C/4h (Air Cooled),
These heat treatments lead to bimodal precipitate distributions with large secondary precipitates and small tertiary particles situated among the previous ones. Primary precipitates, mainly located at the grain boundaries, were dissolved during the supersolvus treatment. The grain size was in the range of 30-50 µm.
Tensile creep tests were performed in air on fully heat-treated cylindrical specimens with a gauge length of 17 mm and a gauge diameter of 3 mm. The creep conditions were 700°C and 650 MPa. Tests were interrupted after a creep strain of about 0.2 %. Finally samples were cut normally to the tensile axis of the creep specimens and thinned by electropolishing. The resulting thin foils were observed in a JEOL 2010 transmission electron microscope (TEM) operating at 200 kV.
3. Image analysis methodologies
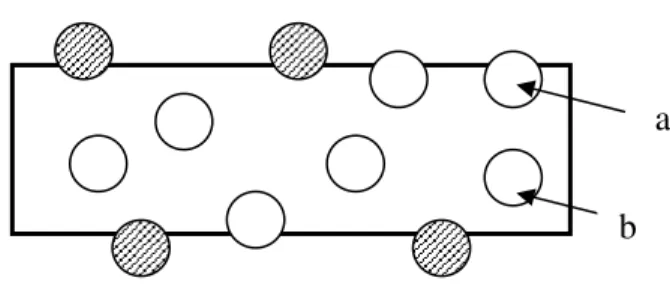
The determination of the microstructural parameters from a TEM image of a thin foil is not an easy task as it is impossible to deduce directly accurate data without any correction. Some corrections have to be made as described in the literature for spherical particles [3 - 9]. The reasons of these corrections are mentioned in the following and illustrated in figure 1:
[Insert figure 1 about here]
i) Some precipitates (shaded in figure 1), with a main diameter equal to D have their centre out of the foil and are projected in circles with an apparent diameter Dapp less than D; ii)
Overlapping of one precipitate by another can exist (the probability of this event increases with the foil thickness). For example, precipitates a and b in figure 1 illustrate this phenomenon); iii) Due to the observations conditions, and amongst them the microscope resolution, very small precipitates may not be visible.
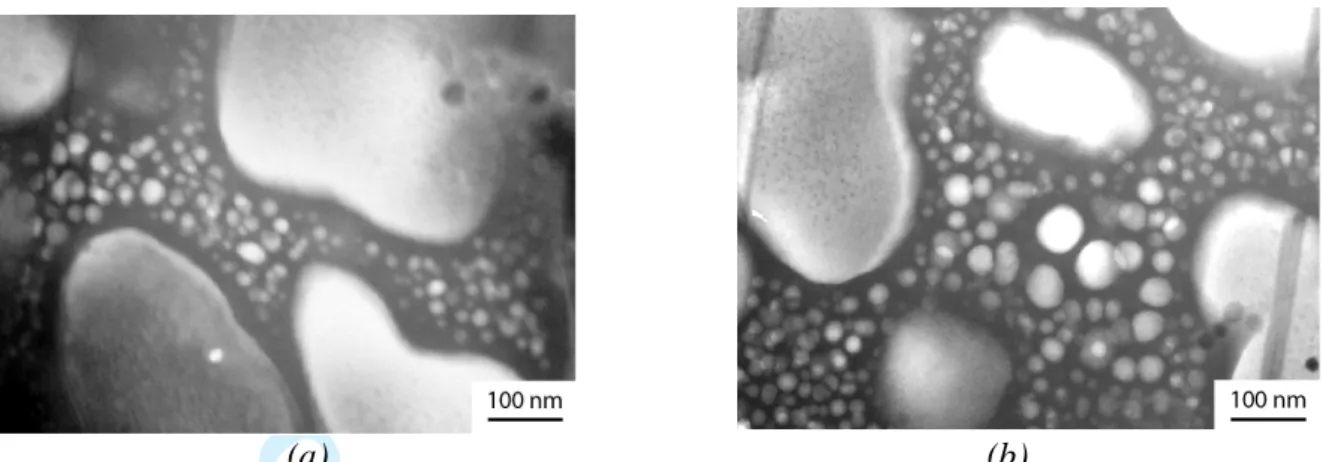
As an illustration of these possible artefacts, the bimodal precipitation after standard heat treatment is imaged in figure 2 for two different foil thicknesses: in (a) the thickness value is close to the mean diameter of the tertiary precipitates and in (b) it is larger. On the
3 4 5 6 7 8 9 10 11 12 13 14 15 16 17 18 19 20 21 22 23 24 25 26 27 28 29 30 31 32 33 34 35 36 37 38 39 40 41 42 43 44 45 46 47 48 49 50 51 52 53 54 55 56 57 58 59 60
For Peer Review Only
micrographs, the apparent diameters appear larger and the volume fraction higher when the thickness increases, as there are more precipitates being entirely contained within the foil.
[Insert figure 2 about here]
The distributions of tertiary γ' precipitate diameters were measured on dark field TEM images of foils slightly thicker than the mean diameter of the precipitates. The precipitates have been outlined and coloured in order to enhance their contrast ; when overlap occurs (easily observable due to the spherical shape of the precipitates), the corresponding particles
have been separated by hand. Then, the diameter of each tertiary γ' precipitate and their
projected area fraction have been obtained using the image analysis OPTIMAS software. Uncertainties in our measurements are due to three factors: i) the position and the thickness of
the hand-drawn line compared to the measured “object”, which is evaluated at 7 % ; ii) the
precision of the software itself, which is estimated at 2 %, and iii) for the precipitate size, the three corrections reported above (see §3 i), ii) and iii)) which amount to about 5 % [11]. The precipitate sizes are given with a resulting relative uncertainty of 14%.
To calculate the volume fraction fv of spherical particles with a diameter D, Cahn and
Nutting [3] have established the following equation to correct for the effect of the foil thickness: A f = fV 1
+
3e 2D (1)where fA is the projected area fraction of precipitates and e is the foil thickness. This
correction is less precise when the foil thickness increases due to the increasing frequency of precipitate overlapping events. The ideal case would be obviously for a thickness zero. In this case:
fA= fV (2)
Such a situation should be experimentally realised with scanning electron microscope
(SEM) or atomic force microscope (AFM) images of precipitates intercepting the surface. In practice, the resolution of SEM images is not high enough for accurate measurements of tertiary γ' precipitates characteristics. Also, both techniques SEM and AFM require particular preparation techniques of the samples. This implies chemical or electro-chemical etching of the sample surfaces and corrections must therefore also be applied to correct for image artefacts [10 – 13].
To avoid such complicated and imperfect correction methods, a new procedure using TEM is proposed here. It uses the images of faulted areas created in the crept material as illustrated in figure 3. These surfaces correspond to planar stacking faults left by the propagation of either a partial a/6<112> dislocation which goes through both the precipitates and the matrix [14] or a perfect a/2<110> dislocation which cuts only the precipitates [15]. The use of such images for the microstructural characterisation will be called in the following the “Faulted Glide Plane (FGP)" method.
[Insert figure 3 about here]
Measurement of the tertiary γ' precipitate area fraction can be carried out using the FGP method by using the OPTIMAS software, and the corresponding volume fraction can be precisely and simply deduced using relation (2). Other great advantages of the FGP method are to allow precise evaluation of the foil thickness and of the γ matrix channel widths. The
3 4 5 6 7 8 9 10 11 12 13 14 15 16 17 18 19 20 21 22 23 24 25 26 27 28 29 30 31 32 33 34 35 36 37 38 39 40 41 42 43 44 45 46 47 48 49 50 51 52 53 54 55 56 57 58 59 60
For Peer Review Only
relative uncertainty in our measurements of the tertiary precipitates volume fraction has been evaluated: it is about 14%.
Only a simple geometric relationship is necessary to deduce the real distance between tertiary γ' precipitates from the apparent width measured on the micrograph (see the appendix for more detail). The corresponding relative uncertainty is about 5% (see the appendix).
4. Experimental results
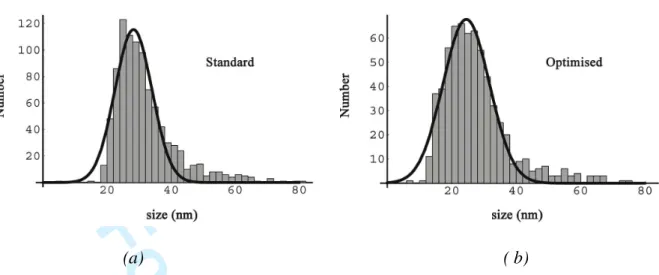
The size distributions of tertiary γ' precipitates are shown in figure 4 for the standard and optimised heat treatments. No correction was made for particles having their centre outside of the thin foil. The histograms are the results of about 1000 and 650 measurements respectively. They were fitted by Gaussian curves. The measurements are slightly underestimated for the small precipitates due to the difficulty of their observation, and subsequently overestimated for the larger ones. The precipitate size at the Gaussian peak is respectively Dst = 28 ± 4 nm
and Dopt = 25 ± 3 nm for the standard and optimised heat treatment procedures.
[Insert figure 4 about here]
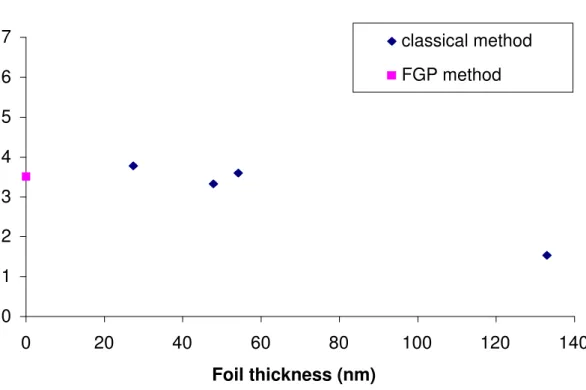
The tertiary γ' precipitate volume fraction determined after the optimised heat treatment by the FGP method is compared in figure 5 with those obtained by the classical method on foil areas with different thicknesses. Relation (1) was applied to correct for the effect of foil thickness. The volume faction of tertiary γ' precipitates was calculated using the precipitate diameter values Dst and Dopt determined previously and values of foil thicknesses determined
using the method described in the appendix. For foil thicknesses up to about 50 nm, the calculated precipitate volume fraction values are close to that determined by using the FGP method that validates the correction procedure proposed by Cahn and Nutting [3]. The smaller value obtained for a larger foil thickness results from the overlapping particle effect that was not corrected. The good agreement between the “classical” and the FGP methods confirm that this new method gives results which are as accurate as the classical one, while remaining
easier and faster.On average, the volume fraction of tertiary γ’ precipitates determined by the
FGP method is higher after the optimised heat treatment than after the standard one (fv,st =
2.9 ± 0.4 % against fv,opt = 3.5 ± 0.5 %).
[Insert figure 5 about here]
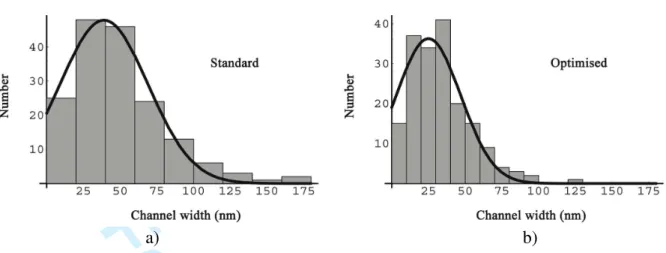
The mean channel widths after the two types of heat treatments were calculated from 150 to 200 direct measurements, also using the FGP method (see figure A1 for an example). Assuming a Gaussian distribution, the most probable values of the channels widths were found to be Lst = 39 ± 2 nm and Lopt = 25 ± 1 nm for the standard heat treatment and the
optimised one respectively (figure 6).
[Insert figure 6 about here] 5. Discussion
The FGP method allows the determination of not only the volume fraction of the small γ' tertiary precipitates but also the channel width between them which is the pertinent parameter as it characterizes the limited space where the dislocations propagate. It is based on the signature left by perfect or partial dislocations on their glide plane, after shearing of these
3 4 5 6 7 8 9 10 11 12 13 14 15 16 17 18 19 20 21 22 23 24 25 26 27 28 29 30 31 32 33 34 35 36 37 38 39 40 41 42 43 44 45 46 47 48 49 50 51 52 53 54 55 56 57 58 59 60
For Peer Review Only
precipitates. Compared to other methods at thickness zero (SEM and AFM), this method presents the advantage to be independent of polishing and etching procedures that could introduce artefacts. It eliminates several causes of uncertainties (foil thickness, visibility of precipitates, particle overlapping, particles cut by the foil edges) inherent to the usual TEM measurements.
The channel width distributions in the dislocation glide plane can therefore be obtained with good accuracy. The knowledge of this particular characteristic is crucial to understanding
the straining micro-mechanisms controlling the deformation in this type of alloy. It must however be pointed out that this method can only be used if stacking faults are created in the precipitates, which is only the case of deformed samples.
The comparison of the results obtained for the two heat treatments can be summarized as follows:
Dst ≈ 1.15 Dopt
fv,st ≈ 0.84 fv,opt
Lst ≈ 1.56 Lopt
They indicate that the optimised microstructure is slightly underaged as compared to the standard one. This is clearly due to the shortening of the first ageing at 700°C and to the elimination of the ageing treatment at 800°C.
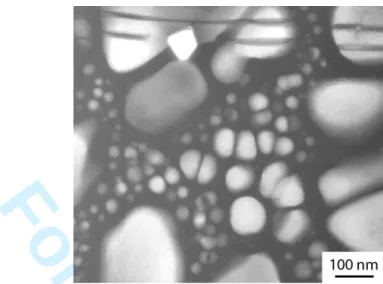
The wide distribution of the microstructural parameters reported here induces a variety of dislocation mechanisms operating during creep of the NR3 superalloy as described elsewhere [14, 15, 16, 17]. For instance, in a situation such as that illustrated in figure 7, dislocations can encounter depending on the area, close packed tertiary γ' precipitates or tertiary γ' precipitate-free zones. Therefore, a variety of γ' precipitate crossing mechanisms are induced. Indeed during a creep test, which implies long time spent under constant applied stress, each dislocation adopts the adequate configuration with respect to its local environment. In the NR3 superalloy, six different micro-mechanisms have been observed and analysed in detail [14, 15, 16, 17]. They appeared to be closely dependent on the local width of the channels and on the size of the encountered precipitates. Different types of dislocations (with different core structures from different natures: superdislocation, perfect dislocation or partial ones) can propagate depending on the phases crossed and on the local microstructure.
The stress level required to curve a dislocation in a γ-channel between precipitates, i.e. the Orowan stress τOR, is simply related to the width of the channel:
bL T 2
OR =
τ (3) where T is the line tension of the dislocation and b is its Burgers vector. τOR can be calculated
using DISDI software in the approximation of anisotropic elasticity [18]. The results are presented in Table 2 for different characters of a perfect dislocation. In these calculations we have assumed that the channels have the most probable width, that is 25 nm after the optimised heat treatment and 39 nm after the standard one (see figure 6).
[Insert Table 2 about here]
On average, channels are larger and the corresponding Orowan stress is 50 % lower for the standard heat treatment as compared to the optimised case.
These values must be compared with the maximum resolved applied stress, which is 325 MPa and which corresponds to a macroscopic creep stress equal to 650 MPa. As a consequence, during creep tests one may suppose that in larger channels, a perfect dislocation
mainly edge in character, is flexible enough to go through the channel and bypass precipitates,
whereas in narrow channels or with a more screw character, it cannot. In the late situation, as a partial dislocation is more flexible than a perfect one, the perfect may dissociate into partials
3 4 5 6 7 8 9 10 11 12 13 14 15 16 17 18 19 20 21 22 23 24 25 26 27 28 29 30 31 32 33 34 35 36 37 38 39 40 41 42 43 44 45 46 47 48 49 50 51 52 53 54 55 56 57 58 59 60
For Peer Review Only
and the leading partial will bypass the precipitate using the decorrelated motion mechanism as described by Raujol et al. [17]. This dissociation and decorrelated movement gives rise, at small strain rate, to a shearing process which creates stacking faults in both γ and γ’ phases as described by Décamps et al. [14]. This mechanism which is frequently observed in crept specimens with optimised microstructure, is the signature of the strong resistance of this microstructure to the propagation of the moving dislocation owing to the narrow γ matrix channels. This mechanism explains the better macroscopic creep strength of the optimised material in comparison with the standard one [2].
Conclusion
A new method using TEM has been developed to determine the volume fraction of the γ’ tertiary nano-precipitates and the channel widths between them in a recent superalloy for turbine disk applications. Measuring the microstructural parameters for two different heat treatments allows the effect of the ageing conditions on the microstructure to be quantified: the size of the tertiary γ' precipitates and the distance between them increase when their volume fraction decreases. The wide dispersion of the microstructural characteristic values is shown to be correlated with the variety of micro-mechanisms observed during creep of this material. This accurate microstructural analysis brings precious information to analyse the effect of the ageing heat treatments on the macroscopic creep behaviour of the superalloy. Such a study exemplifies the need to develop precise microstructural characterisation methods in order to interpret macroscopic mechanical behaviour.
Acknowledgments
We are grateful for financial support from le Ministère de la Recherche, le Ministère de l’Equipement, des Transports et du Logement (programme RRIT “Recherche aéronautique sur le supersonique”). 3 4 5 6 7 8 9 10 11 12 13 14 15 16 17 18 19 20 21 22 23 24 25 26 27 28 29 30 31 32 33 34 35 36 37 38 39 40 41 42 43 44 45 46 47 48 49 50 51 52 53 54 55 56 57 58 59 60
For Peer Review Only
Appendix
1. Measurement of channel widths between tertiary precipitates
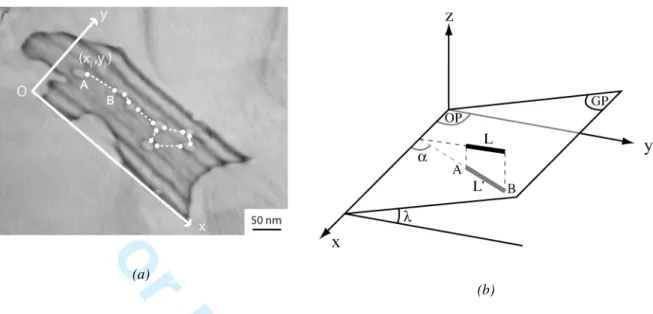
The channel widths seen by dislocations gliding in a {111} plane can be measured on images of areas where stacking faults have been created during the creep deformation. The principle is presented in figure A1. The apparent distances between tertiary γ' precipitates in the glide plane correspond to the dotted lines. If (xi, yi) and (xj, yj) are respectively the coordinates of
the A and B points which define the segment between two precipitates, the apparent channel width AB = L’ is given by:
(
) (
)
2 i j 2 i j x y y x ' L = − + − (A1)The real width L is the projection of L’ on the glide plane: λ
α +
= L' 1 sin2 tan2
L (A2)
where α is the angle between (Ox) and the channel direction and λ, the angle between the glide plane (GP) and the observation plane (OP).
For evaluating the uncertainty on the determination of L, we have considered that: ∆xi = ∆xj =
∆yi = ∆yj = ∆x, so that, neglecting the uncertainty on the tilt angle, we have obtained:
(
)
(
)
(
)
2(
)
2 max max 2 y y x x y y x x x L L j i j i j i j i − + − − + − ∆ = ∆ (A3)We have found a numerical value of 5%.
[Insert Figure A1 about here] 2. Determination of the foil thickness
As for the channel width measurement, the local thin foil thickness can be precisely determined from an image with a stacking fault. The principle is illustrated in figure A2. Measuring the apparent width dapp of the stacking fault,the foil thickness e is given by:
β α cos sin app d e= (A4)
where α is the angle between the staking fault plane and the thin foil plane and β is the angle between the staking fault plane and the projection plane.
Assuming a possible error of 2° on the angles, we have found an uncertainty close to 1%.
[Insert Figure A2 about here]
3 4 5 6 7 8 9 10 11 12 13 14 15 16 17 18 19 20 21 22 23 24 25 26 27 28 29 30 31 32 33 34 35 36 37 38 39 40 41 42 43 44 45 46 47 48 49 50 51 52 53 54 55 56 57 58 59 60
For Peer Review Only
References
[1] D. Locq, M. Marty, A. Walder, P. Caron, 1999, Intermetallic and Superalloys, Euromat 99, Vol. 10, edited by D.G. Morris, S. Naka and P. Caron (Weinheim: Wiley-VCH Verlag Gmbh), pp. 52-57.
[2] D. Locq, P. Caron, S. Raujol, F. Pettinari-Sturmel, A. Coujou and N. Clément, 2004, Superalloys 2004, edited by K. A. Green, H. Harada, T. E. Howson, T. M. Pollock, R. C. Reed, J. J. Schirra, S. Walston, (Warrendale, Pennsylvania: TMS), pp.179-187.
[3] J.W. Cahn and J. Nutting, 1959, T.M.S. AIME, 215, 526. [4] J. E Hilliard, 1962, T.M.S. AIME, 224, 906.
[5] J.M.G. Crompton, R.M. Waghorne and G.B. Brook. Brit. J. Appl. Phys. 17 1301 (1966). [6] B. Reppich and G. Schumann G., Mat. Sci. Eng. A, 101, 171 (1988).
[7] C. Schlesier and E. Nembach, Mat. Sci. Eng. A, 119 199 (1989).
[8] E. Nembach in : Particle strengthening of metals and alloys (New York: Wiley) (1996). [9] J. Wosik, B. Dubiel, A. Kruk, H-J. Penkalla, F. Schubert, A. Czyrska-Filemonowicz,
Materials characterization 46 119 (2001).
[10] U. Lagerpusch U., B. Anczykowski and E. Nembach, Phil. Mag. A, 81, 2613 (2001). [11] B. Fruhstorfer, V. Mohles, R. Reichelt and E. Nembach, Phil. Mag. A.82 2575 (2002). [12] A. Bourhettar, A. Hazotte and M. Troyon, Materials characterization 34 265 (1995). [13] M. Göken and M. Kempf, Acta mater. 47 1043 (1999).
[14] B. Décamps, S. Raujol, A.Coujou, F. Pettinari-Sturmel, N. Clément, D. Locq, P. Caron, Phil. Mag. 84 91 (2004).
[15] M. Condat and B. Décamps, Scripta metall. 21 607 (1987).
[16] S. Raujol, F. Pettinari, D. Locq, P. Caron, A. Coujou, N. Clément, Mat. Sci. Eng. A 387-389 678 (2004).
[17] S. Raujol, M. Benyoucef, D. Locq, P. Caron, F. Pettinari, N. Clément and A. Coujou, Phil. Mag. 86 1189-1200 (2006).
[18] J. Douin, P. Veyssière, P. Beauchamp, Phil. Mag. A, 54 375-393 (1986).
3 4 5 6 7 8 9 10 11 12 13 14 15 16 17 18 19 20 21 22 23 24 25 26 27 28 29 30 31 32 33 34 35 36 37 38 39 40 41 42 43 44 45 46 47 48 49 50 51 52 53 54 55 56 57 58 59 60
For Peer Review Only
Table 1. Weight and atomic compositions of the NR3 alloy.
Ni Co Cr Ti Al Mo Hf Zr C B
Weight % 60.69 14.64 11.82 5.5 3.65 3.28 0.33 0.052 0.024 0.013 Atomic % 57.45 13.81 12.63 6.38 7.52 1.90 0.10 0.032 0.111 0.067
Table 2. Values of the Orowan stress for screw and edge perfect dislocations as a function of the heat treatment
Heat treatment Channel width (nm) τOR screw (MPa) τOR edge (MPa) Standard 39 1044 213 Optimized 25 1629 334 3 4 5 6 7 8 9 10 11 12 13 14 15 16 17 18 19 20 21 22 23 24 25 26 27 28 29 30 31 32 33 34 35 36 37 38 39 40 41 42 43 44 45 46 47 48 49 50 51 52 53 54 55 56 57 58 59 60
For Peer Review Only
Figure 1. Schematic representation of spherical precipitates in a thin foil. a b 3 4 5 6 7 8 9 10 11 12 13 14 15 16 17 18 19 20 21 22 23 24 25 26 27 28 29 30 31 32 33 34 35 36 37 38 39 40 41 42 43 44 45 46 47 48 49 50 51 52 53 54 55 56 57 58 59 60
For Peer Review Only
(a) (b)
Figure 2. Dark field TEM images of the microstructure corresponding to the standard heat treatment for two different foil thicknesses a) 28 and b) 54 nm.
3 4 5 6 7 8 9 10 11 12 13 14 15 16 17 18 19 20 21 22 23 24 25 26 27 28 29 30 31 32 33 34 35 36 37 38 39 40 41 42 43 44 45 46 47 48 49 50 51 52 53 54 55 56 57 58 59 60
For Peer Review Only
Figure 3. TEM post mortem observation in a crept sample (optimised heat treatment). Tertiary precipitates are revealed by the shearing of the matrix and by a Shockley dislocation left around them due to the shearing process described in [14].
3 4 5 6 7 8 9 10 11 12 13 14 15 16 17 18 19 20 21 22 23 24 25 26 27 28 29 30 31 32 33 34 35 36 37 38 39 40 41 42 43 44 45 46 47 48 49 50 51 52 53 54 55 56 57 58 59 60
For Peer Review Only
(a) ( b)
Figure 4. Diameter distribution of the tertiary precipitates produced during the (a) standard and (b) optimised heat treatments.
3 4 5 6 7 8 9 10 11 12 13 14 15 16 17 18 19 20 21 22 23 24 25 26 27 28 29 30 31 32 33 34 35 36 37 38 39 40 41 42 43 44 45 46 47 48 49 50 51 52 53 54 55 56 57 58 59 60
For Peer Review Only
0 1 2 3 4 5 6 7 0 20 40 60 80 100 120 140 Foil thickness (nm) classical method FGP methodFigure 5: Influence of the foil thickness on the determination of the volume fraction using a classical method. Comparison with the FGP method. This data have been obtained for the optimised heat treatment.
3 4 5 6 7 8 9 10 11 12 13 14 15 16 17 18 19 20 21 22 23 24 25 26 27 28 29 30 31 32 33 34 35 36 37 38 39 40 41 42 43 44 45 46 47 48 49 50 51 52 53 54 55 56 57 58 59 60
For Peer Review Only
a) b)Figure 6: Channel width distributions for a) the standard heat treatment and b) the optimised one. The determinations are made using the FGP method. The estimated most probable values for channel widths are 39 nm and 25 nm, respectively.
3 4 5 6 7 8 9 10 11 12 13 14 15 16 17 18 19 20 21 22 23 24 25 26 27 28 29 30 31 32 33 34 35 36 37 38 39 40 41 42 43 44 45 46 47 48 49 50 51 52 53 54 55 56 57 58 59 60
For Peer Review Only
Figure 7. Dark field TEM image of the optimised microstructure. An inhomogeneous distribution of the tertiary precipitates is clearly evidenced.
3 4 5 6 7 8 9 10 11 12 13 14 15 16 17 18 19 20 21 22 23 24 25 26 27 28 29 30 31 32 33 34 35 36 37 38 39 40 41 42 43 44 45 46 47 48 49 50 51 52 53 54 55 56 57 58 59 60
For Peer Review Only
(a)
(b)
Figure A1. Principle of measurement of the real channel width between tertiary γ' precipitates in a {111} plane: (a) TEM image showing the apparent channels; (b) schema illustrating the corrections necessary to achieve real widths.
Figure A2. Schematic view of the apparent foil thickness observed on a TEM image.
3 4 5 6 7 8 9 10 11 12 13 14 15 16 17 18 19 20 21 22 23 24 25 26 27 28 29 30 31 32 33 34 35 36 37 38 39 40 41 42 43 44 45 46 47 48 49 50 51 52 53 54 55 56 57 58 59 60

![Figure 3. TEM post mortem observation in a crept sample (optimised heat treatment). Tertiary precipitates are revealed by the shearing of the matrix and by a Shockley dislocation left around them due to the shearing process described in [14]](https://thumb-eu.123doks.com/thumbv2/123doknet/13684260.431853/14.892.218.603.142.382/observation-optimised-treatment-tertiary-precipitates-shockley-dislocation-described.webp)