HAL Id: hal-00768832
https://hal.archives-ouvertes.fr/hal-00768832
Submitted on 17 Oct 2014
HAL is a multi-disciplinary open access
archive for the deposit and dissemination of
sci-entific research documents, whether they are
pub-lished or not. The documents may come from
teaching and research institutions in France or
abroad, or from public or private research centers.
L’archive ouverte pluridisciplinaire HAL, est
destinée au dépôt et à la diffusion de documents
scientifiques de niveau recherche, publiés ou non,
émanant des établissements d’enseignement et de
recherche français ou étrangers, des laboratoires
publics ou privés.
Observation of the seasonal thermal wave on Iapetus
Alice Le Gall, S. Keihm, M. A. Janssen, Cédric Leyrat, L. C. Wye, R. West
To cite this version:
Alice Le Gall, S. Keihm, M. A. Janssen, Cédric Leyrat, L. C. Wye, et al.. Observation of the seasonal
thermal wave on Iapetus. EPSC 2012 (European Planetary Science Congress), Sep 2012, Madrid,
Spain. �hal-00768832�
Observation of the seasonal thermal wave on Iapetus
A. Le Gall (1), S. Keihm (2), M.A. Janssen (2) C. Leyrat (3), L.C. Wye (4), R. West (2) and the Cassini Radar Team
(1) Laboratoire Atmosphères, Milieux, Observations Spatiales (LATMOS), Université de Versailles Saint-Quentin (UVSQ) Paris, France (alice.legall@latmos.ipsl.fr), (2) Jet Propulsion Laboratory, California Institute of Technology, CA, USA, (3) Laboratoire d'Etudes Spatiales et d'Instrumentation en Astrophysique (LESIA), Observatoire de Paris-Meudon, Meudon, France, (4) Stanford University, CA, USA
Abstract
On Sept. 10, 2007, the Cassini spacecraft encountered Saturn’s third largest moon, Iapetus, during the closest encounter with the two-toned moon to date. During this experiment (called the IA49-3 experiment), the Cassini radar/radiometer observed the leading hemisphere of the moon, collecting a unique passive (radiometry) and active (radar) data set at the wavelength of 2.2-cm. At such a wavelength, the radiometer probes several tens of cm up to a few meters below the surface, depending on the absorbing properties of the regolith. In this paper, we show that the seasonal contrast between the high latitude terrains of Iapetus was captured during IA49-3 thus providing new constrains on the electrical and thermal properties of the moon’s surface.
1. The IA49-3 experiment
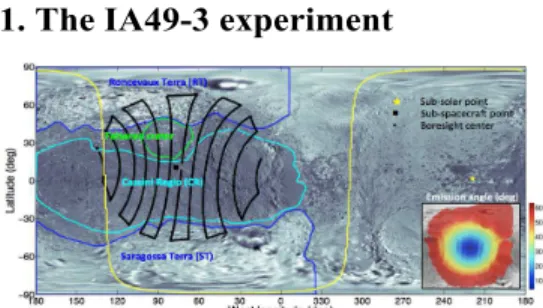
Fig. 1: Raster scan pattern (black dots) of the Cassini radiometer during IA49-3 overlaid upon the near-IR ISS base map. The observed region includes the dark terrains of Cassini Regio (CR) and the bright terrains of RT (North) and ST (South). The inset shows the emission angles of observation.
Geometry of observation During the IA49-3
experiment, the Cassini radar/radiometer scanned the antenna beam over the leading side of Iapetus in a north-south raster pattern with a footprint size of
~120 km (~15% of Iapetus’ diameter) (see Fig. 1). Almost all of the equatorial dark terrains (Cassini Regio (CR)) was observed at emission angles ranging from 0° to 63° while the bright terrains (Ronceveaux Terra (RT) in the North and Saragossa Terra (ST) in the South) were scanned at viewing angles higher than 40° and in less extent. At the time of IA49-3, the southern hemisphere was coming out of summer while winter was ending in the North. Furthermore, Cassini spacecraft approached Iapetus from its night side.
Radiometry observations Most of the visible
variation in the antenna temperature measured by the Cassini radiometer is limb darkening. Comparing it to a surface model allow us to show evidence of (see residuals in Fig. 2): (i) decreasing brightness temperatures from West to East i.e. as night progresses likely due to a diurnal effect, (ii) a significant brightness temperature difference between the optically and radar-bright northern and southern terrains most probably due to a seasonal effect.
Fig. 2: Residuals i.e. differences between the measured and modeled antenna temperatures. The best-fit brightness temperature model assumes an uniform surface with a dielectric constant of 2, a mean surface temperature at the Equator of 90 K and a equator-to-pole temperature difference of 10 K.
EPSC Abstracts
Vol. 7 EPSC2012-269 2012
European Planetary Science Congress 2012
c
Author(s) 2012
EPSC
2. Thermal modeling
In order to analyse the IA49-3 radiometry data, we have developed a thermal model able to account for the effects of both the diurnal and seasonal variations of the solar insolation on the temperature profile below Iapetus’ surface. The depth down to which the subsurface temperature is influenced by these variations is δth= I Cpρ τ π
where I is the thermal inertia of the surface regolith,
Cp its heat capacity, ρ its density andτ is the diurnal
or annual period of the temperature cycle on Iapetus. Typically, for I=30 Jm-2K-1s-1/2, C=0.5 Jg-1K-1, ρ=106 gm-3 the thermal skin depths are : δth
day~9 cm for the
diurnal variations and ~1 δth season
m for the seasonal variations. The more inert is the subsurface, the deeper the thermal waves penetrate it.
The temperature profile resulting from the model has the following distributions:
• At the surface ( z = 0 ), the temperature is the instantaneous radiative equilibrium temperature; it varies only with the angular distance from the sub-solar point.
• Just beneath the surface and above the diurnal thermal skin depth ( 0< z ≤ δ
th
day ), the
temperature is still mainly controlled by the angular distance from the sub-solar point; the amplitude of the temperature fluctuations in response to diurnal heating decreases with depth.
• Between the diurnal and the seasonal thermal depth ( δth
day
≤ z ≤δth
season ), the temperature
distribution reflects the diurnally averaged insolation; the peak temperatures are at the sub-solar latitude and fall off north and south. • Below the seasonal skin depth (
z
>δ
thseason
), the temperatures reflect the annually averaged insolation being symmetric about the Equator. The Cassini radiometer senses a weighted combination of the temperature distributions described above. If the electrical skin depth at 2.2 cm is short, the instrument will be only sensitive to the near-surface diurnal fluctuations while if the subsurface is low-loss at this wavelength, it may capture the seasonal effect.
3. Analysis and conclusions
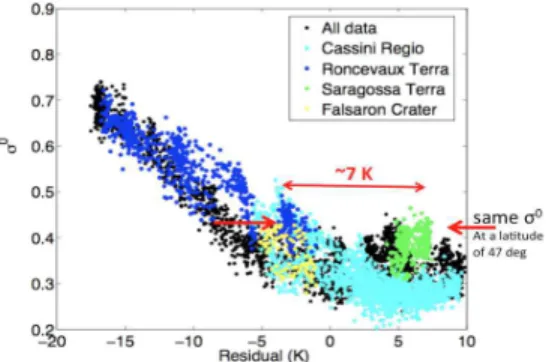
Analysis of the IA49-3 radiometry data has shown that: (i) The thermal inertias sensed by the Cassini radiometer, in particular over CR, must significantly exceed that measured by the Cassini’s Composite IR Spectrometer (I=11-15, [1]) to explain the absolute level of the measured antenna temperature. This suggests a gradient in density with depth. (ii) Despite a probable general decrease in emissivity from West to East (suggested by the increase in the coincident measured radar cross-section σ0), the differences in local solar time are probably responsible for a variation of ~5 K in the recorded antenna temperature, (iii) The radiometer captured the temperature asymmetry around the Equator due to heat buried in ground on seasonal timescales. In particular, there is ~7 K difference between the equally radar-bright terrains of 47°N and 47°S latitude (see Fig. 3). If the Cassini radiometer both observed seasonal and diurnal effects, it implies that the electrical skin depth is between the diurnal and seasonal thermal wavelengths i.e. of the order of a few tens of cm, consistent with radar results [2,3]. This would also support the idea CR is coated by non-ice and possibly carbon-rich materials (e.g. [4]).
Fig. 3: Scatterplot of the residuals and the coincident radar
cross-sections σ0 measured in the scatterometry mode.
References
[1] Rivera-Valentin et al. (2011), Icarus 216, 347-358. [2] Ostro et al. (2006), Icarus 183, 479-490. [3] Ostro et al. (2010), Icarus 206, 498-506. [4] Buratti et al. (2005), Icarus 175, 490-495.