HAL Id: hal-02189988
https://hal.archives-ouvertes.fr/hal-02189988
Submitted on 20 Jul 2019HAL is a multi-disciplinary open access archive for the deposit and dissemination of sci-entific research documents, whether they are pub-lished or not. The documents may come from teaching and research institutions in France or abroad, or from public or private research centers.
L’archive ouverte pluridisciplinaire HAL, est destinée au dépôt et à la diffusion de documents scientifiques de niveau recherche, publiés ou non, émanant des établissements d’enseignement et de recherche français ou étrangers, des laboratoires publics ou privés.
Amperometric detection of diclofenac at a
nano-structured multi-wall carbon nanotubes sensing
films
Cyrine Slim, Nisrine Tlili, Cyrille Richard, Sophie Griveau, Fethi Bedioui
To cite this version:
Cyrine Slim, Nisrine Tlili, Cyrille Richard, Sophie Griveau, Fethi Bedioui. Amperometric detection of diclofenac at a nano-structured multi-wall carbon nanotubes sensing films. Inorganic Chemistry Communications, Elsevier, 2019, 107, pp.107454. �10.1016/j.inoche.2019.107454�. �hal-02189988�
Amperometric detection of diclofenac at a nano-structured
multi-wall carbon nanotubes sensing films
Cyrine Slim1*, Nisrine Tlili1, Cyrille Richard2, Sophie Griveau1 and Fethi Bedioui1
1
Chimie ParisTech, PSL Research University, Institute of Chemistry for Life and Health sciences (i-CLeHS), CNRS 2027, Paris, France
2
Unité de Technologies Chimiques et Biologiques pour la Santé, Université Paris Descartes, CNRS 8258, INSERM 1267, Paris, France
1
Abstract
COOH-functionalized multi-walled carbon nanotubes (f-MWCNTs) film coated on glassy carbon electrode (GCE) were prepared, and the detection of diclofenac (DCF) was investigated on by cyclic voltammetry and amperometry. The results showed that the nano-structured electrodes exhibit good analytical performances towards the electrochemical oxidation of DCF with a detection limit of 0.1 µM and a sensitivity of 0.06 µA . µM-1 within a dynamic concentration range varying from 2 μM to 15 µM.
Keywords: diclofenac; multi-walled carbon nanotubes; amperometry, detection
Water is an essential element for all forms of life, whether vegetable or animal. It is also essential for the development of human activities, whether agricultural, mining, industrial or simply domestic. Unfortunately, these activities are at the origin of a deterioration of the quality water caused by the accumulation of pollutants and their derivatives, in large quantity or in the state of traces (micropollutants). The presence of these species in ecosystems directly affects the health of living organisms, even if they are present at trace levels because their toxicity results from their accumulation. The detection of drug residues in water is of great importance in the fields of environment and human health. One of the common drugs that have been used over the years is diclofenac (noted as DCF). This nonsteroidal anti-inflammatory drug possesses analgesic, anti-inflammatory, and antipyretic properties.1 However, its environmental effects are harmful.2,3 To date, many means have been employed for the determination of diclofenac, its detection mostly relied on conventional techniques such as high performance liquid chromatography (HPLC)4,5, capillary zone electrophoresis (CZE) 6, high-performance liquid chromatography-mass spectrometry (HPLC-MS)7, spectrophotometric 8, spectrofluorometric9, thin-layer chromatography 10,11 and gas chromatography 12,13. Though highly sensitive, these analytical techniques are time-consuming, expensive, require a lot of expertise to be operated and are not easy to be deployed in the field. Overcoming these limitations, electrochemical methods have attracted attention in recent years due to their fast response, sensitivity, accuracy, lower cost, high dynamic range and simplicity.14-16 Among the electrochemical methods, various amperometric 17-20 and potentiometric techniques 21 have been reported. In this work a COOH
2
functionalized multi-walled carbon nanotubes (f-MWCNT) film coated glassy carbon electrode (GCE) for the determination of DCF sodium was structured. The enhanced electrooxidation of DCF at the surface of f-MWCNT film coated GCE in phosphate buffer solution (pH 7) was attributed to the unique properties of MWCNTs such as large specific surface area and strong adsorptive properties providing more reaction sites. The search for absolute selectivity of this developed sensor with respect to potential interfering species with electroactivity similar to that of DCL will not be addressed in this study because the long-term application of this tool will be done by implementing it in an analytical microsystem coupling a separative step.
The synthesis of f-MWCNT from pristine MWCNT was performed as describes elsewhere.22 The pristine MWCNT was dispersed in a mixture of nitric acid and sulfuric acid (1:3 ratio) and refluxed for 24h. After this, the COOH-pristine MWCNT dispersion was diluted. Then the dispersion was filtered through a filter paper and the residue was washed several times with ultrapure water until pH 7. Finally, the obtained f-MWCNT was dried at 80 °C for 24h. The suspensions of f-MWCNT were prepared by mixing the desired quantity of nanotubes in water under sonication for almost 30 minutes.
Before modification, the surface of GCE was polished carefully on grit sandpaper with different grain size (1200 – 2400 and finally 4000) and washed with ultrapure water to reach a mirror-like surface. 1 mg of f-MWCNT was dispersed by sonication in 1 mL ultrapure water for 30 minutes. A 2 µL of the f-MWCNT suspension was then drop-casted onto the GC electrode and left to dry at ambient temperature. Different concentrations of f-MWCNT suspension were used (1, 0.5, 0.1, 0.05 and 0.01 mg mL-1) and tested in order to optimize the electrode performance.
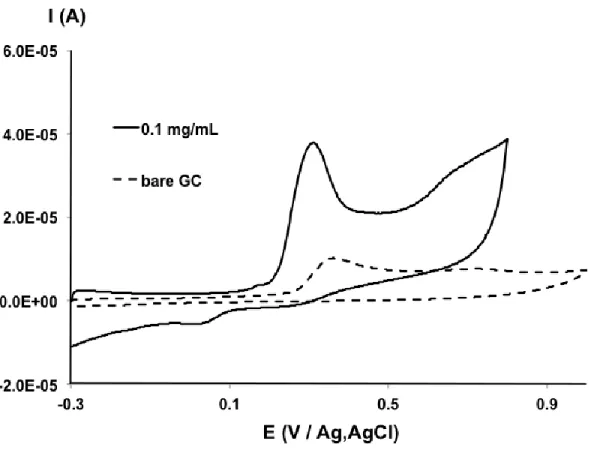
Cyclic voltammograms of bare GCE and 0.1 mg mL-1 f-MWCNT modified electrode were investigated in 0.1 mol L-1 PBS at pH 7 containing 500 µM of DCF. As shown in Fig. 1 the bare GCE displays a small oxidation peak for DCF, while with f-MWCNT an increase of the intensity is clearly observed. This result is due to the special electronic properties of the f-MWCNT material that accelerate the electron transfer rate via the large specific surface area, high conductivity and enhanced porosity of the deposited film making the modified electrode.
3
Figure 1. Cyclic voltammograms of 500 µM DCF on bare GCE (dotted line) and 0.1 mg mL-1 f-MWCNT modified electrode (solid line) in 0.1 mol L-1 PBS at pH 7, at a scan rate of 50 mV s-1.
The study of the DCF oxidation with increasing concentrations (from 250 to 1000 µM) on bare GCE in 0.1 M PBS at pH 7 shows an increase of the anodic peak current with the concentration of DCF (data not shown). However, the surface of GCE should be freshly polished to get well-defined and reproducible anodic peak. Indeed, performing successive voltammograms at the bare GCE led to electrode surface passivation after only one voltammetric cycle, while this was not observed with the f-MWCNT modified electrode.
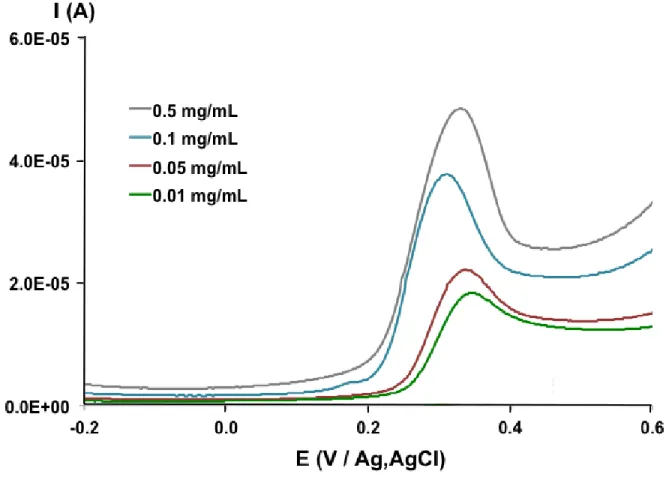
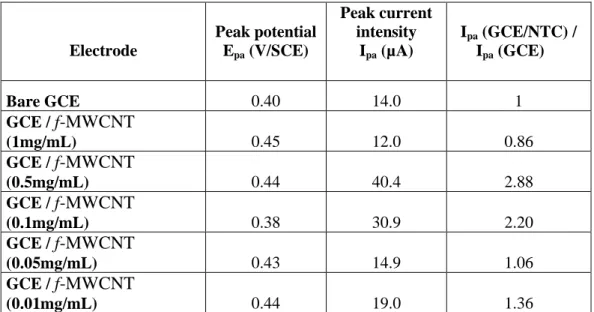
The influence of the nanocomposite concentration of the deposited f-MWCNT film on the electrode performance was investigated. To this end, different suspensions of nanotubes (0.01– 0.5 mg of f-MWCNT /mL) were prepared and a drop of these suspensions was deposited on GCE surface, as previously described. The effect on the potential Epa and the intensity Ipa of the
anodic peak current of DCF was evaluated. As it can be seen in Fig. 2, by increasing the nanocomposite concentration, the current peak increased too. This is due, certainly due to the
4
increase of the surface area of the electrode. However, the Ipa decreased for 1mg/mL (Table 1),
as the negative impact of the increase of the thickness of the deposited f-MWCNT film with larger f-MWCNT amount making difficult its impregnation by the analyte. It can also be noticed that the increase of Ipa is not proportional to the amount of deposited f-MWCNT on the electrode
surface. This may be attributed to an inhomogeneous distribution of the f-MWCNT on the electrode surface at low (0.01-0.05 mg/mL) concentration of f-MWCNT. There is thus an optimal concentration of f-MWCNT in the aqueous suspension for GCE surface modification. Therefore, according to results summarized in Table 1, the amount of 0.1 mg/mL was suitable for the structuration of f-MWNTs /GC electrode.
Figure 2. Influence of f-MWCNT nanocomposite concentration on the anodic oxidation of DCF (500 M) in 0.1 M PBS (pH 7) evaluated by cyclic voltammetry at a scan rate of 50 mV s-1 (only the onward scans are shown)
5
Table 1. Comparison of peak potential (Epa) and intensity (Ipa) values for the oxidation of DCF
(500 M) evaluated by cyclic voltammetry at scan rate 50 mV/s.
Electrode Peak potential Epa (V/SCE) Peak current intensity Ipa (µA) Ipa (GCE/NTC) / Ipa (GCE) Bare GCE 0.40 14.0 1 GCE / f-MWCNT (1mg/mL) 0.45 12.0 0.86 GCE / f-MWCNT (0.5mg/mL) 0.44 40.4 2.88 GCE / f-MWCNT (0.1mg/mL) 0.38 30.9 2.20 GCE / f-MWCNT (0.05mg/mL) 0.43 14.9 1.06 GCE / f-MWCNT (0.01mg/mL) 0.44 19.0 1.36
Amperometry was used to investigate the sensitivity and the dynamic linear range towards DCF detection (2 to 30 µM) at pH 7, as illustrated on Fig. 3 (lower curve). The amperometric detection was performed at +0.4 V/SCE, using rotating modified electrode (1000 rpm). As shown on Fig. 3, after each addition of DCF in the micromolar range, a stepwise current response is observed on bare GCE. The peak current increases linearly with the concentration of DCF ranging from 2 to 10 µM. It should be pointed out that beyond 10 μM the current response is no longer linear with DCF concentration. This is due to the passivation of the bare GCE. The amperometric study carried out at +0.4 V with different f-MWCNT concentrations shows that the currents related to DCF oxidation are larger than that at bare GCE, which agrees the cyclic voltammetry data. As shown in Fig.3B, the current response increases linearly with DCF concentration from 2 μM to 15 µM when using 0.1 mg mL-1 f-MWCNTs to form the sensitive film. The best limit of detection is found to be 0.1 µM using this modified electrode and the sensitivity (0.06 µA.µM-1) is ten times larger than at bare GCE.
6
Figure 3. (A) Amperometric response at bare GCE and f-MWCNT/GC electrodes at +0.40 V vs Ag/AgCl with different f-MWCNT concentrations and upon successive additions of DCF (2 µM each injection); (B) Corresponding calibration curve in the dynamic domain obtained on bare GCE and for each f-MWCNT concentration (mg mL-1).
Several electroanalytical methods have been reported for the determination of DCL based on potentiometry, differential pulse voltammetry and square wave voltammetry. The figure of
0 0.0000005 0.000001 0.0000015 0.000002 900 1000 1100 1200 1300 1400 1500 1600 I (A) Temps (s) Chronoampérogramme obtenue dans une solu8on de DCF 10-3 M sur une electrode tournante de
carbone modifiée avec des NP de carbone dissoutes dans l'eau. (E=0,4V)
0.1 mg ( essai 4) 0.05 mg (essai 2) carbone nu 0.01 mg (essai 2) 0.5 µA 0.1 mg/mL 0.05 mg/mL Bare electrode 0.01 mg/mL 100 s 0,00E+00 4,00E-07 8,00E-07 1,20E-06
0,0E+00 5,0E-06 1,0E-05 1,5E-05 2,0E-05 2,5E-05 3,0E-05
I(A) Concentration (M) 0.1 mg 0.05 mg 0.01 mg Bare electrode y = 0.060x + 2.10-7 ; R2= 0.98 y = 0.050x + 5.10-8 ; R2= 0.99 y = 0.035x + 10-7 ; R2= 0.98 A
7
merits of different electrochemical methods for detection of DCL are summarized in Table 1. The reported method here offers good limit of detection and sensitivity for DCL analysis . It is also a simple approach without complex multi-modification procedures and does not imply the use of differential or transient techniques.
Table1: Comparison between analytical performances of reported techniques for DCF detection.
Detection method Electrode Linear range (µM) LOD (µM) Ref
Square wave voltammetry Vinylferrocene/MWCNTs paste electrode 5 - 600 2
23 Differential Pulse Voltammetry MWCNTs/Cu(OH)2 nanoparticles/IL-GC electrode 0.18 - 119 0.04 24 Differential Pulse Voltammetry
MWCNTs and IL-modified carbon ceramic
electrode 0.05 - 50 0.02
25
Square wave voltammetry Ionic Liquid / MWCNTs paste electrode 0.30 - 750 0.09
26
Square wave voltammetry AuNPs/MWCNT/GCE 0.30 - 200 0.02
27
Differential Pulse
Voltammetry MWCNTs/Pencil Graphite Electrode 0.047 – 12.95 0.017
28
Square wave voltammetry Cu/CTS/MWCNTs/GCE 0.30 - 200 0.02
29 Differential Pulse Voltammetry f-MWCNTs/NC/GCE 0.05 - 250 0.02 19 Differential Pulse
Voltammetry Au-Pt NPs – MWCNTs / Gold 0.5 - 1000 0.3
30
Amperometry f-MWCNTs / GCE 2 - 15 0.1
This work
In this work, we fabricated f-MWCNTs/GCE electrode in an easy and rapid way and showed its reasonableness as an electrochemical sensor for the determination of DCF. Upon modification of
8
GC surface with f-MWCNTs, the electrochemical peak current of DCF enhanced owing to the increase in conductivity, porosity and surface area of the modified electrode. The stability of the proposed sensor was examined for 10 days with acceptable RSD values.
References
1
D.H. Solomon, J. Avorn, T. Stürmer, R.J. Glynn, H. Mogun, S. Schneeweiss, Arthritis Rheum., 54 (2006) 1378–1389.
2
C.B. Joeng, J.H. Niazi, S.J. Lee, M.B. Gu, Bioorg, Med. Chem., 17 (2009) 5380–5387.
3
M. Cleuvers, Ecotoxicol. Environ. Saf., 59 (2004) 309–315.
4
C. Arcelloni, R. Lanzi, S. Pedercini, G. Molteni, I. Fermo, A. Pontiroli, R. Paroni, J. Chromatogr. B. Biomed. Sci. App., 763 (2001) 195–200.
5
B. Yilmaz, A. Asci, S.S. Palabiyik, J. Chromatogr. Sci., 49 (2011) 422–427.
6
W. Jin, J. Zhang, J. Chromatogr., A 868 (2000) 101-107.
7
M.E. Abdel-Hamid, L. Novotny, H. Hamza, J. Pharm. Biomed. Anal. 24(2001) 587.
8
J.C. Botello, G. Pérez-Caballero, Talanta 42 (1995) 105-158.
9
L.A. Carreira, M. Rizk, Y. EI-Shabrawy, N.A. Zakhari, S.S. Toubar, J. Pharm. Biomed. Anal. 13 (1995) 1331-1337.
10
S.W. Sun, H. Fabre, J. Liq. Chromatogr. 17 (1994) 433-445.
11
S.W. Sun, H. Maillols, J. Liq. Chromatogr. 17 (1994) 2495-2509.
12
A. Siou, F. Pommier, J. Godbillon, J. Chromatogr. 571 (1991) 87-100.
13
D. Lansdorp, T.J. Janssen, P.J.M. Gurlen, T.B. Vree, J. Chromatogr. 528(1990) 487-494.
14
M. Mostafavi, M.R. Yaftian, F. Piri, H. Shayani-Jam, Biosens. Bioelectron., 122 (2018) 160– 167.
15
J. Lenik, Mater. Sci. Eng. C, 45 (2014) 109–116.
16
C. Wang, T. Jiang, K. Zhao, A. Deng, J. Li, Talanta, 193 (2019) 184–191.
17
X. Yang, F. Wang, S. Hu, Mater. Sci. Eng. C, 28 (2008) 188–194.
18
9
19
M. D. Shalauddin, S. Akhter, W. J. Basirun, S. Bagheri, N. S. Anuar, M. R. Johan, Electrochimica acta 304 (2019) 323-333.
20
M. Mostafavi, M. Reza, Y. Farideh, P. Hassan, Shayani-Jam, Biosensors and Bioelectronics 122 (2018) 160-167.
21
D. Vlascici, S. Pruneanu, L. Olenic, F. Pogacean, V. Ostafe, V. Chiriac, F. M. Pica, L. C. Bolundut, L. Nica, E. Fagadar-Cosma, Sensors 10 (2010) 8850-8864.
22
R. Karthik, R. Sasikumar, S.M. Chen, J.V. Kumar, A. Elangovan, V. Muthuraj et al., J. Colloid Interface Sci., 487 (2017) 289-296.
23
A. Mokhtari, H. Karimi-Maleh, A.A. Ensafi, H. Beitollahi, Sens. Actuators, B 169 (2012) 96-105.
24
M. Arvand, T.M. Gholizadeh, M.A. Zanjanchi, Mater. Sci. Eng. C 32 (2012) 1682-1689.
25
K. Sarhangzadeh, A.A. Khatami, M. Jabbari, S. Bahari, J. Appl. Electrochem. 43 (2013) 1217-1224.
26
M. Goodarzian, M.A. Khalilzade, F. Karimi, V.K. Gupta, M. Keyvanfard, H.Bagheri, et al., J. Mol. Liq. 197 (2014) 114-119.
27
A. Afkhami, A. Bahiraei, T. Madrakian, Mater. Sci. Eng. C 59 (2016) 168-176.
28
G Parvizi Fard, E Alipour, R. E. A. Sabzib, Analytical Methods, 2016, 8, 3966-3974.
29
M. Shalauddin, S. Akhter, S. Bagheri, M.S.A. Karim, N.A. Kadri, W.J. Basirun, Int. J. Hydrog. Energy 42 (2017) 19951-19960.
30