HAL Id: hal-02114256
https://hal.archives-ouvertes.fr/hal-02114256
Submitted on 29 Apr 2019HAL is a multi-disciplinary open access archive for the deposit and dissemination of sci-entific research documents, whether they are pub-lished or not. The documents may come from teaching and research institutions in France or abroad, or from public or private research centers.
L’archive ouverte pluridisciplinaire HAL, est destinée au dépôt et à la diffusion de documents scientifiques de niveau recherche, publiés ou non, émanant des établissements d’enseignement et de recherche français ou étrangers, des laboratoires publics ou privés.
Quantitative cardiac output assessment using 4D
ultrafast Doppler imaging: an in vitro study
Clement Papadacci, Camille Zordan, Mickaël Tanter, Mathieu Pernot
To cite this version:
Clement Papadacci, Camille Zordan, Mickaël Tanter, Mathieu Pernot. Quantitative cardiac output assessment using 4D ultrafast Doppler imaging: an in vitro study. 2018 IEEE International Ultrasonics Symposium (IUS), Oct 2018, Kobe, France. pp.1-4. �hal-02114256�
Quantitative cardiac output assessment using 4D
ultrafast Doppler imaging: an in vitro study
Clement Papadacci, Camille Zordan, Mickael Tanter, Mathieu Pernot
INSERM U979 “Physics for medicine”, ESPCI Paris, PSL Research University, CNRS UMR 7587, Institut Langevin
Corresponding author: [email protected]
Abstract
Background, Motivation and Objective
Echocardiography is routinely used in the clinic to evaluate the cardiac function. Anatomical indexes such as ventricular volume measurements or functional indexes such Cardiac Output are performed using standard echocardiography. However, 2D dimensional measurements induce inter-operator variability and standard 3D measurements do not have the sufficient volume rate to evaluate functional indexes. Moreover, the accuracy of flow velocity estimates is strongly reduced by the angular dependence of Doppler measurements. In this study, we propose to use 4D ultrafast Doppler to evaluate flow rates in a pipe to demonstrate the potentiality of performing Cardiac Output measurements without assumptions on the valve geometry and without angular dependence.
Statement of Contribution/Methods
An ultrasonic matrix array probe (central frequency 2.5MHz, 1024 elements, pitch 0.3 mm, bandwith 60%, Vermon, France) connected to a 1024 channels ultrasound scanner prototype was used to image the pipe output in three dimensions. 500 diverging waves (angular aperture 80°) were emitted at a volume rate of 2000 volumes/s during 250 ms. Color Doppler volumes (quantitative flow speed volumes) were computed by calculating the first moment of the Doppler spectrums in each voxel. The pipe flow rates (N=7) were calculated by integrating directly the flow speed over the cross section of the pipe.
Results/Discussion
The measured flow rates were found to be in a good agreement with the flowmeter values used as a gold standard ( = 0.96). The four dimensional nature of the acquisition has the potential to enable the calculation of the Cardiac Output in vivo in patients without the need of making any assumption on the valve geometry or the direction of the ultrasonic beam usually responsible for errors.
I. INTRODUCTION
Echocardiography has the advantages of being fast, low-cost, and to enable real-time measurements on patients’ beating heart. It is routinely used in the
clinic to evaluate the cardiac function by assessing various cardiac indexes. Anatomical indexes such as ventricular volume measurements or functional indexes such as Cardiac Output are performed using standard two dimensional (2D) echocardiography. However, some limitations are inherent to 2D echocardiography measurements. Probe positioning between the ribs of the patient can be challenging and finding the standard cross-sectional view of the heart requires an important training of the cardiologists or radiologists. The positioning induces inter-operator variability which is often responsible for low result reproducibility [1]. In addition, some approximations are necessary to quantify three dimensional (3D) volumes from 2D cross-sectional images. For instance, Cardiac Output is calculated from Left ventricular outflow tract velocity time integral (LVOT VTI) which requires the measurement of the aorta cross section and the assumption of a cylindrical geometry. This approximation is responsible for an error of more than 10% on the value of the Cardiac Output [2]. 3D echocardiography could be the answer to increase repeatability and reduce inter-operator dependency [3]. It is actually used in the clinic to perform anatomical measurements such as the ejection fraction [3]. However, due to its low volume rate, standard 3D echocardiography is not able to map flow velocity over 3D volumes due to low frame-rate of the line-by-line ultrasonic wave transmit scheme used in current clinical 3D ultrasound systems.
In research, ultrafast imaging has been studied for more than two decades [4]. It enables to increase the frame rate in 2D to reach few kilo images per second. The method relies on the emission of unfocused wave to insonifiate the entire medium in few transmits. Recently, ultrafast imaging was extended to 4D ultrasound imaging [5] for different applications: to image blood flow in small vessels [6], shear waves [7], pulse wave [8], quasi-static [9] and dynamic strain [10]. In the heart, 4D ultrasound ultrafast imaging was performed to image blood flow [5] and fibers [11] in the left ventricle of a human
volunteer and tissue displacement in canine’s hearts [10]. One very interesting property of ultrafast imaging is that it enables quantification. In the case of Doppler blood flow, one spectrogram can be retrieved from each voxel which allows quantification as if pulsed Doppler was performed at each location of the volume. Another advantage of 4D ultrafast Doppler is that, flow rate evaluation can become independent from the hypothesis on the geometry and the angle of insonification. Indeed, the flow speed can be evaluated over an entire cross-section and the normal to the cross-section can be chosen to be collinear to the ultrasonic beam axis. In this study, we developed this flow rate evaluation method based on 4D ultrafast Doppler independent of assumptions and beam angle. The method was evaluated in vitro on a pipe with a controlled flow rate (N=7).
II. MATERIAL AND METHODS A. Experimentation
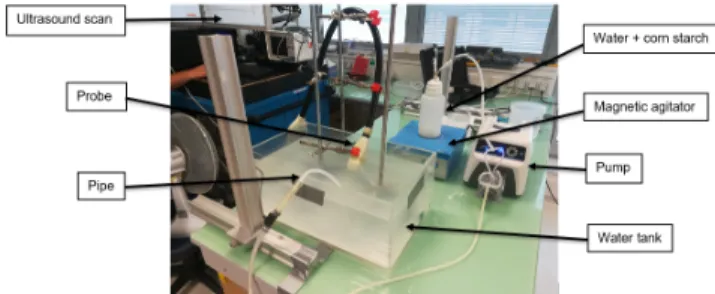
A soft plastic pipe (internal/external diameter 1.8/2.7 cm) was connected to a peristatic pump. The pipe was maintained vertically in a water tank with small nylon thread attached to the side of the tank. The ultrasonic probe was placed on top of the pipe’s end to mimic the in vivo aortic flow measurement in apical view condition. A solution of water with corn starch (6%) was infused through the pipe. Ultrasonic measurements were performed for N=7 different flow rates. The flow was monitored with a flowmeter. A scheme of the experiment is displayed in figure 1.
Figure 1 : Scheme of the experiment. A pipe filled with water and corn starch, connected to a peristatic pump, is immerged in a water tank. A matrix array probe connected to a 3D ultrafast scanner is set vertically on top of the pipe to image the outgoing flow.
B. Ultrasonic acquisition
An ultrasonic matrix array probe (central frequency 2.5MHz, 1024 elements, pitch 0.3 mm, bandwith 60%, Vermon, France) connected to a 1024 channels ultrasound scanner prototype was used to image the pipe in three dimensions. 2000 diverging waves (angular aperture 80° [11]) were emitted at a volume rate of 2000 volumes/s during 1s. Radio Frequency data were received from each transmitted
wave at a sampling frequency of 10MHz and stored in memory.
C. Post processing a. Beamforming
The 500 volumes (dimensions 80°x80°x50mm, sampling 2°x2°x0.3mm) were reconstructed. A conventional delay and sum algorithm was implemented on GPU (Titan Xp, nvidia) using cuda language. High pass filter (cut-off frequence 20Hz) was applied to remove low frequency motion and keep only the signal from the flow. Power Doppler image was computed by summing the 500 filtered images over time. In each voxel, Doppler spectrums were computed by performing the Fourier transform over time. Color Doppler volumes (quantitative flow speed volumes) were computed by calculating the first moment of the Doppler spectrums in each voxel. The Color Doppler volumes were averaged over time to decrease noise. Power velocity integral (PVI) was calculated by multiplying the power Doppler and the Color Doppler volumes. The flow volume was obtained by thresholding the PVI while keeping the same surface S for each flow rate acquisition.
b. Flow rate
The pipe flow rate (Q) at a depth z is given by the following expression:
= . → ( )
is the flow speed (m/s). Here we chose an arbitrary surface S perpendicular to the ultrasonic beam axis, we obtain the integration of the axial velocity over S. In other word, the flow rate is the integral of the Doppler velocity estimates over the cross section of the flow. and are collinear as the normal to the surface is always along the beam axis before scan conversion process.
c. Data representations
3D volumes were then scan-converted and represented using Amira Software. Calculation was performed using Matlab. Beamforming was performed on a TITAN XP from Nvidia Corporation.
III. RESULTS A. Power Doppler
The power Doppler volume was successfully observed allowing 3D representations in top view (figure 2 A) and side view (figure 2 B). In each voxel of the volume, a Doppler spectrum was assessed (i.e. figure 2 C). The first momentum was associated to the flow speed. In other word, in each voxel of the volume the flow speed was assessed.
Figure 2 : 3D representation of Power Doppler in the pipe with a Doppler spectrum associated with one voxel of the volume. Cross section of the Power Doppler in top view (A) and side view (B) are presented. A Doppler spectrum can be derived for each voxel of the volume (C).
B. Color Doppler
Color Doppler volume was successfully observed in side view (figure 3 A) and top view (figure 3 B). The 3D visualization enabled to visualize flow going in two different directions: blue color going towards the probe, red color going away from the probe (see white arrows). The flow going towards the probe was associated to the outgoing flow while the flow going away from the probe was interpreted as the fallout of the flow along the pipe. Power velocity integral method allowed us to obtain a composite image between the power Doppler and the Color Doppler (figure 3 C D). A threshold was applied on the PVI to obtain the volume of outgoing flow. (figure 4 A B).
Figure 3 : 3D representation of Color Doppler flow and Power velocity integral in the pipe. Cross section of the Power Doppler in top view (A) and side view (B) are presented and displays flows in two directions. Cross section of the Power velocity integral in top view (A) and side view (B) are displayed and lobes from Color Doppler flow are reduced.
Figure 4 : 3D mask associated with the flow in the pipe in side view (A) and top view (B). It was computed by thresholding the Power velocity integral.
C. Evaluation of flow rates in the pipe
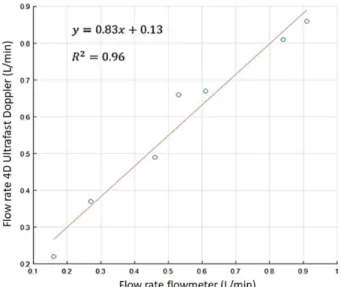
The pipe output was calculated after application of the mask and flow speed integration at the output of the pipe. The comparison between output assessed with the flowmeter and the output calculated from the 4D ultrafast method is presented in figure 5. A linear regression was performed and gave an excellent correlation between the measured ouputs ( = 0.96).
Figure 5 : Flow rate measured with 4D ultrafast Doppler against flow rate measured with the flowmeter is presented. A linear regression was applied to the data. A high correlation was found
( = 0.96)
IV. CONCLUSION
In study, we developed a new method to evaluate the flow rates in a pipe based on 4D ultrafast Doppler imaging. The measured flow rates were found to be in a good agreement with the flowmeter values used as a gold standard ( = 0.96). The 4D approach enabled to evaluate a spectrogram at each voxel of the volume from which a blood flow speed was assessed. Flow rates were assessed on a cross section of the tube using the estimated blood flow speed at each voxel of the cross section. This method presents the advantage of being independent of the direction of the ultrasonic
beam. No assumptions were made on the pipe geometry. Limitation includes the incapability for the pump to deliver higher flow rate (1L/min max). However, it would still be possible to perform the method at higher flow rate as long as no aliasing is present in the Spectral Doppler signal. In case of aliasing the method could be coupled to dealiasing scheme [12]. The method would be extremely valuable to estimate Cardiac Output in acute heart failure for therapeutic optimization for instance. The four dimensional nature of the acquisition has the potential to enable the evaluation of the Cardiac Output in vivo in patients without the need of making any assumptions on the valve geometry or the direction of the ultrasonic beam usually responsible for errors.
V. ACKNOWLEDGEMENTS
This study was supported by the European Research Council under the European Union’s Seventh Framework Programme (FP/2007-2013) / ERC Grant Agreement n° 311025 and the ANR-10-IDEX-0001-02 PSL* Research University. We acknowledge the ART (Technological Research Accelerator) biomedical ultrasound program of INSERM. The Titan X Pascal used for this research was donated by the NVIDIA Corporation.
VI. BIBLIOGRAPHY
[1] D. J. Sahn, A. DeMaria, J. Kisslo, and A. F. Weyman, “Recommendations regarding quantitation in M-mode echocardiography: results of a survey of echocardiographic measurements,” Circulation, vol. 58, no. 6, pp. 1072–1083, 1978. [2] L. L. Huntsman, D. K. Stewart, S. R. Barnes, S. B.
Franklin, J. S. Colocousis, and E. A. Hessel, “Noninvasive Doppler determination of cardiac output in man. Clinical validation.,” Circulation, vol. 67, no. 3, pp. 593–602, 1983.
[3] J. L. Dorosz, D. C. Lezotte, D. A. Weitzenkamp, L. A. Allen, and E. E. Salcedo, “Performance of 3-Dimensional Echocardiography in Measuring Left Ventricular Volumes and Ejection Fraction: A Systematic Review and Meta-Analysis,” J. Am.
Coll. Cardiol., vol. 59, no. 20, pp. 1799–1808, May 2012.
[4] M. Tanter and M. Fink, “Ultrafast imaging in biomedical ultrasound,” IEEE Trans. Ultrason. Ferroelectr. Freq. Control, in press, Jan. 2014. [5] J. Provost et al., “3D ultrafast ultrasound imaging
in vivo,” Phys. Med. Biol., vol. 59, no. 19, p. L1, Oct. 2014.
[6] J. Provost, C. Papadacci, C. Demene, J.-L. Gennisson, M. Tanter, and M. Pernot, “3-D ultrafast doppler imaging applied to the noninvasive mapping of blood vessels in Vivo,” IEEE Trans. Ultrason. Ferroelectr. Freq. Control, vol. 62, no. 8, pp. 1467–1472, Aug. 2015.
[7] J.-L. Gennisson et al., “4-D ultrafast shear-wave imaging,” IEEE Trans. Ultrason. Ferroelectr. Freq. Control, vol. 62, no. 6, pp. 1059–1065, Jun. 2015.
[8] I.-Z. Apostolakis, P. Nauleau, C. Papadacci, M. D. McGarry, and E. E. Konofagou, “Feasibility and Validation of 4-D Pulse Wave Imaging in Phantoms and In Vivo,” IEEE Trans. Ultrason. Ferroelectr. Freq. Control, vol. 64, no. 9, pp. 1305–1317, Sep. 2017.
[9] C. Papadacci, E. A. Bunting, and E. E. Konofagou, “3D Quasi-Static Ultrasound Elastography With Plane Wave In Vivo,” IEEE Trans. Med. Imaging, vol. 36, no. 2, pp. 357–365, Feb. 2017.
[10] C. Papadacci, E. A. Bunting, E. Y. Wan, P. Nauleau, and E. E. Konofagou, “3D Myocardial Elastography In Vivo,” IEEE Trans. Med. Imaging, vol. 36, no. 2, pp. 618–627, Feb. 2017. [11] C. Papadacci, M. Pernot, M. Couade, M. Fink, and
M. Tanter, “High-contrast ultrafast imaging of the heart,” IEEE Trans. Ultrason. Ferroelectr. Freq. Control, vol. 61, no. 2, pp. 288–301, Feb. 2014. [12] Posada D., Poree J., Pellissier A., et al.Staggered
multiple-PRF Ultrafast Color Doppler. IEEE Trans Med Imaging 2016;35(6):1510–21. Doi: 10.1109/TMI.2016.2518638