HAL Id: hal-00323129
https://hal.archives-ouvertes.fr/hal-00323129
Preprint submitted on 19 Sep 2008
HAL is a multi-disciplinary open access
archive for the deposit and dissemination of
sci-entific research documents, whether they are
pub-lished or not. The documents may come from
teaching and research institutions in France or
abroad, or from public or private research centers.
L’archive ouverte pluridisciplinaire HAL, est
destinée au dépôt et à la diffusion de documents
scientifiques de niveau recherche, publiés ou non,
émanant des établissements d’enseignement et de
recherche français ou étrangers, des laboratoires
publics ou privés.
Radial velocities, dynamics of stars and nebulosities
with GAIA and VLT-GIRAFFE
Christophe Martayan, Yves Fremat, Ronny Blomme, Anthony Jonckheere,
Celine Delle-Luche, Paola Sartoretti, David Katz, Yves Viala, Michele
Floquet, Anne-Marie Hubert, et al.
To cite this version:
Christophe Martayan, Yves Fremat, Ronny Blomme, Anthony Jonckheere, Celine Delle-Luche, et al..
Radial velocities, dynamics of stars and nebulosities with GAIA and VLT-GIRAFFE. 2008.
�hal-00323129�
Radial velocities, dynamics of stars and nebulosities with GAIA and
VLT-GIRAFFE
C. Martayan1,2,⋆, Y. Fr´emat1, R. Blomme1, A. Jonckheere1, C. Delle-Luche2, P. Sartoretti2, D. Katz2,
Y. Viala2, M. Floquet2, A.-M. Hubert2, and C. Neiner2
1 Royal Observatory of Belgium, 3 avenue circulaire, 1180 Brussels, Belgium
2 GEPI, Observatoire de Paris, CNRS, Universit´e Paris Diderot; place Jules Janssen 92195 Meudon Cedex, France
The dates of receipt and acceptance should be inserted later
Key words Magellanic Clouds – Galaxy: kinematics and dynamics – ISM: bubbles – stars: kinematics – methods: data analysis
This document is divided in two parts. The first part deals with the radial velocities (RV) distributions for B-type stars and nebulosities observed with the VLT-GIRAFFE in the Large and Small Magellanic Clouds towards the open clusters NGC2004 and NGC330. Thanks to the resolution of GIRAFFE spectra, we found that the RV distribution for the nebu-losities in the LMC is bi-modal. This bi-modality can be interpreted, in term of dynamics, by the expansion of the LMC4 superbubble. The second part deals with the GAIA space mission and the determination of the radial velocities by us-ing Radial Velocity Spectrometer (RVS) spectra. The methods to determine the radial velocities are presented as well as preliminary results on simulated RVS spectra.
c
2008 WILEY-VCH Verlag GmbH & Co. KGaA, Weinheim
1 Radial velocity distributions of stars and
nebulosities with the VLT-GIRAFFE
We observed large samples of B-type stars in the Large and Small Magellanic Clouds towards the open clusters NGC2004 in the LMC and NGC330 in the SMC.
Thanks to the resolution of GIRAFFE spectra
(R= 6400 for LR02 spectra 396.4 – 456.7nm, R= 8600 for LR06 spectra 643.8 – 718.4nm), we were able to distinguish the Halpha emission lines, which come from the circum-stellar disks of Be stars (broad emission), from the nebular emission lines (narrow emission). Moreover, we were able to see the other nebular lines of [NII] 654.8-658.3 nm and [SII] 671.7-673.1nm. We determined the radial velocities of the nebulosities from these lines.
For the stars, we measured the radial velocities by fitting the LR02 observations with theoretical spectra by using the GIRFIT code (Fr´emat et al. 2006). This code provides the fundamental parameters of the stars (Teff, logg, Vsini, and the radial velocity). The accuracy of the determination of the radial velocities is better than 10 km/s.
We then compared the distributions of radial velocities of the stars with the distributions of radial velocities for the nebular lines. In the SMC, the 2 distributions are gaussian and peak at the same value: ∼160 km/s indicating a possible link between the stars and the nebulosities. However, in the LMC, the RV distribution for the stars is gaussian, mono-modal, and peaks at 300 km/s; while the RV distribution for the nebular lines is clearly bi-modal and peaks at 305 and
⋆ Corresponding author: e-mail: martayan@oma.be
335 km/s. No clear link is found between the stellar object and the nebular emission in the spectrum.
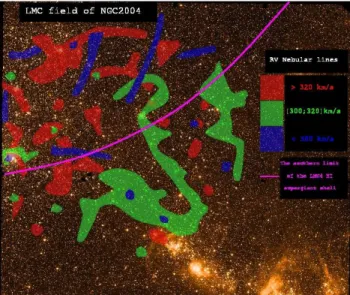
The high and low nebular RVs are not randomly dis-tributed over the field but seem to be organized in struc-tures that look like filaments. The higher velocities cen-tred around 335 km/s are observed in the eastern and north-western parts of the field, while the lower velocities centred around 305 km/s, are observed in the south-western part. Higher intensity is generally found in nebulosities with the lowest Hα radial velocities. However, stars with no nebular Hα line are found in isolated regions of the observed field, reflecting the patchy nature of nebulosities in this part of the LMC.
The mean value of [SII] 6717/6731 is 1.4 typical of LMC bubbles (Skelton et al. 1999). The [NII]/Hα is lower than 0.1, the [SII]/Hα ranges from 0.1 to 0.3. These values are close to those found for the HII regions in the LMC. The analysis of nebular lines agrees well with the HI distri-bution survey of Staveley-Smith et al. (2003). The HI dis-tribution revealed that the body of the LMC is punctuated by “large holes”. One of the main HI gaps in the LMC cor-responds to LMC4. The southern inner limit of the LMC4 supergiant shell crosses the field observed with the VLT-GIRAFFE spectrograph. The LMC4 HI supergiant shell is centred at 05h31mn33s -66o40’28” with a radius of 38.7’ and a systemic heliocentric velocity of 306 km/s.
Thus our study of nebular lines shows that:
– higher velocity nebulosities (335 km/s) appear to
coin-cide with the southern inner HI gas in LMC4.
– lower velocity nebulosities (305 km/s) are preferentially
detected at the rim of LMC4 and have the same RV as the systemic RV of the bubble.
790 C. Martayan et al.: Radial velocities with GAIA and VLT-GIRAFFE
Fig. 1 Regions of similar radial velocities of the nebu-lar lines. Red and blue regions are associated to the LMC4 bubble (respectively with RVs >320 km/s and <300 km/s, which correspond to the expansion of the bubble). The pink curve corresponds to the southern limit of the LMC4 bub-ble. The green regions are associated to the mean RV of the LMC (300–320 km/s). This figure shows the patchy and fil-amentary nature of the nebulosity. North is at the top, East on the left.
– The separation between lower and higher velocities
cor-responds to the inner limit of the LMC4 HI supergiant shell.
– The strong intensity of nebular lines observed in the
south-western part of the field is easily explained by the vicinity of the HII region LHA 120-N 15A.
Fig. 1 shows the links between the different regions of the same radial velocities for nebular lines. All the details about this study can be retrieved from Martayan et al. (2006).
2 The GAIA space mission and the radial
velocity determinations
GAIA will observe 1 billion of stars both in the Milky Way and close galaxies of the Local Group (e.g. LMC, SMC for example). It has 3 instruments on-board:
– ASTRO for the determination of the astrometry, proper
motions, and parallaxes of the stars.
– Blue and red spectrophotometers (Bp/Rp) are 2
spec-trophotometers, which will provide very low resolution spectra (R∼100,320-680nm and 640-1000nm).
– The Radial Velocity Spectrometer (RVS) is the
spectro-graph of GAIA. It will provide spectra at high resolution (R=11500) for stars till V∼11, and low resolution spec-tra (R=5000) for stars till V∼17. The specspec-tra will be used to determine the radial velocities of the stars. Over 5 years, all the objects will be observed 40 times in average by the GAIA-RVS. The radial velocities will be
es-timated from the single transit and from the combined tran-sits. We present here the methods we currently implement in java for the automatic determination of the radial veloc-ities of the stars. We show the first tests and results of the different methods on simulated data in Fig. 2.
2.1 Methods used for the determination of the stellar radial velocities
For more details about the methods and the codes used, we refer the reader to the technical notes from Viala et al. (2007, 2008) available via the GAIA website or on demand.
2.1.1 Determination of radial velocity through cross-correlation of an object spectrum with a template spectrum (or a mask) in direct space (CC-Dir)
The objective of this scientific module is, by cross- corre-lation between the calibrated object spectrum and an ap-propriate template spectrum, to determine simultaneously the radial velocity and the projected rotational velocity of the object during a single transit. It gets the appropriate template spectrum from the workpackage “selection of syn-thetic spectra”. It shifts the template spectrum by applying a radial velocity and computes the cross-correlation coef-ficient, in data space, between the object spectrum and the shifted template. The radial velocity is determined from the maximum of the cross-correlation function, maximum ob-tained by fitting a parabola in the top of the correlation peak.
2.1.2 Radial velocity determination through
cross-correlation in Fourier space (CC-FOU and Chelli)
The aim of this module is to compute the Cross-Correlation function of an object spectrum by a template in Fourier Space. For this method, we considered therefore two pos-sibilities to estimate the radial velocities: first, we compute the Fourier inverse of the Fourier Cross-Spectrum in order to locate the peak value of the function (like in the CC-Dir approach) by accounting for pixel-discretisation; and sec-ond, we directly derive the radial velocity in Fourier space by adopting the approach described by Chelli (2000).
2.1.3 Determination of radial velocity by the minimum distance method (MD)
Another method of determining the radial velocity is by minimum distance. This method consists of trying many radial velocity shifts of a template with respect to the ob-served spectrum and determining what velocity shift gives the best fit. Goodness of fit can be evaluated with a classical least-squares, but Poisson and Cash statistics are also being explored. The resulting radial velocity thus obtained is re-fined using a parabola through the points around the best fit. The 1-sigma error bars on the radial velocity are also determined.
c
2.2 Accuracies of the RV determinations
The simulations with the last design of the RVS provides intrinsic accuracies of the radial velocity determinations for stars of spectral types from K1 to B0, and magnitudes from 8.5 to 17.5. The errors range from <1 km/s (for bright cool stars) to 35 km/s (for faint hot stars,V=13) with 1 single transit. At the end of mission, the errors range from <1km/s (for bright cool stars) to 30 km/s (for faint hot stars, V=16) with 40 transits and 3 CCDs combined. For more details about the accuracies, we refer the reader to the technical note from Sartoretti et al. (2007) available via the GAIA website or on demand.
Acknowledgements. C.M. gratefully acknowledges the SOC/LOC
of the GSD2008 conference for the financial assistance. C.M. ac-knowledges funding from the ESA/Belgian Federal Science Policy in the framework of the PRODEX program (C90290).
References
Chelli, A.: 2000, A&A 358, 59
Fr´emat Y., Neiner C., Hubert A.-M., et al.: 2006, A&A 451, 1053 Martayan C. , Hubert A.-M. , Floquet M., et al.: 2006, A&A 445,
931
Sartoretti, P.; Katz, D.; Gomboc, A.: 2007, GAIA-C6-TN-OPM-PS-006-1
Skelton B.P., Waller W.H., Gelderman R.F. et al.: 1999, PASP 111, 465
Staveley-Smith L., Kim S., Calabretta M.R., et al.: 2003, MNRAS 339, 87
Viala, Y.; Blomme, R.; David, M.; Delle-Luche, C.; Desert, J.-M.; Fr´emat, Y.; Gosset, E.; Martayan, C.: 2007, GAIA-C6-SP-OPM-YV-001-3
Viala, Y.; Blomme, R.; Dammerdji, Y.; Delle-Luche, C.; Fr´emat, Y.; Gosset, E.; Jonckheere, A.; Martayan, C.: 2008, GAIA-C6-SP-OPM-YV-004-1
792 C. Martayan et al.: Radial velocities with GAIA and VLT-GIRAFFE
Fig. 2 Histograms of the radial velocity distributions for a G5V star (Teff: 5500 K, logg=4.0, [Fe/H]=0.0, Vsini=0 km/s ) Left: magnitudeV=9.5 (500 high resolution spectra, RV=20 km/s), middle: V= 11.5 (1000 low resolution spectra, RV=30 km/s), right: V=13.5 (1000 low resolution spectra, RV=30 km/s). From top to bottom: In red: with the method of cross-correlation in direct space (CC-Dir), in blue: with the cross-correlation in Fourier space (CC-Fou), in purple: with the Chelli’s method in Fourier space (Chelli), in green: with the minimum distance method (MD). X-axis corresponds to the RV (unit km/s), Y-axis to the number of spectra. In each histogram, the average of the RV determination is indicated.
c
![Fig. 2 Histograms of the radial velocity distributions for a G5V star (Teff: 5500 K, logg=4.0, [Fe/H]=0.0, Vsini=0 km/s ) Left: magnitudeV=9.5 (500 high resolution spectra, RV=20 km/s), middle: V= 11.5 (1000 low resolution spectra, RV=30 km/s), right: V=13](https://thumb-eu.123doks.com/thumbv2/123doknet/14609430.545239/5.892.81.783.304.784/histograms-velocity-distributions-magnitudev-resolution-spectra-resolution-spectra.webp)
