HAL Id: insu-01120576
https://hal-insu.archives-ouvertes.fr/insu-01120576
Submitted on 2 Mar 2015
HAL is a multi-disciplinary open access
archive for the deposit and dissemination of
sci-entific research documents, whether they are
pub-lished or not. The documents may come from
teaching and research institutions in France or
abroad, or from public or private research centers.
L’archive ouverte pluridisciplinaire HAL, est
destinée au dépôt et à la diffusion de documents
scientifiques de niveau recherche, publiés ou non,
émanant des établissements d’enseignement et de
recherche français ou étrangers, des laboratoires
publics ou privés.
remagnetized Eocence volcanic rocks in the Nanmulin
Basin (southern Tibet) to date the India-Asia collision?
Wentao Huang, Guillaume Dupont-Nivet, Peter Lippert, Douwe J.J. van
Hinsbergen, Mark Dekkers, Zhaojie Guo, Ross Waldrip, Xiaochun Li, Xiaoran
Zhang, Dongdong Liu, et al.
To cite this version:
Wentao Huang, Guillaume Dupont-Nivet, Peter Lippert, Douwe J.J. van Hinsbergen, Mark Dekkers,
et al.. Can a primary remanence be retrieved from partially remagnetized Eocence volcanic rocks in the
Nanmulin Basin (southern Tibet) to date the India-Asia collision?. Journal of Geophysical Research,
American Geophysical Union, 2015, 120 (1), pp.42-66. �10.1002/2014JB011599�. �insu-01120576�
Can a primary remanence be retrieved from partially
remagnetized Eocence volcanic rocks in the Nanmulin
Basin (southern Tibet) to date the India-Asia collision?
Wentao Huang1,2, Guillaume Dupont-Nivet1,2,3,4, Peter C. Lippert5,6, Douwe J. J. van Hinsbergen2, Mark J. Dekkers2, Zhaojie Guo1, Ross Waldrip5, Xiaochun Li7, Xiaoran Zhang7, Dongdong Liu1, and Paul Kapp5
1
Key Laboratory of Orogenic Belts and Crustal Evolution, Ministry of Education, School of Earth and Space Sciences, Peking University, Beijing, China,2Department of Earth Sciences, Utrecht University, Utrecht, Netherlands,3Géosciences Rennes,
Université de Rennes 1, Campus de Beaulieu, Rennes CEDEX, France,4Institute of Earth and Environmental Science, University of Potsdam, Potsdam-Golm, Germany,5Department of Geosciences, University of Arizona, Tucson, Arizona, USA, 6
Department of Geology and Geophysics, University of Utah, Salt Lake City, Utah, USA,7Department of Earth Sciences, University of Hong Kong, Hong Kong, China
Abstract
Paleomagnetic dating of the India-Asia collision hinges on determining the Paleogene latitude of the Lhasa terrane (southern Tibet). Reported latitudes range from 5°N to 30°N, however, leading to contrasting paleogeographic interpretations. Here we report new data from the Eocene Linzizong volcanic rocks in the Nanmulin Basin, which previously yielded data suggesting a low paleolatitude (~10°N). New zircon U-Pb dates indicate an age of ~52 Ma. Negative fold tests, however, demonstrate that the isolated characteristic remanent magnetizations, with notably varying inclinations, are not primary. Rock magnetic analyses, end-member modeling of isothermal remanent magnetization acquisition curves, and petrographic observations are consistent with variable degrees of posttilting remagnetization due to low-temperature alteration of primary magmatic titanomagnetite and the formation of secondary pigmentary hematite that unblock simultaneously. Previously reported paleomagnetic data from the Nanmulin Basin implying low paleolatitude should thus not be used to estimate the time and latitude of the India-Asia collision. We show that the paleomagnetic inclinations vary linearly with the contribution of secondary hematite to saturation isothermal remanent magnetization. We tentatively propose a new method to recover a primary remanence with inclination of 38.1° (35.7°, 40.5°) (95% significance) and a secondary remanence with inclination of 42.9° (41.5°,44.4°) (95% significance). The paleolatitude defined by the modeled primary remanence—21°N (19.8°N, 23.1°N)—is consistent with the regional compilation of published results from pristine volcanic rocks and sedimentary rocks of the upper Linzizong Group corrected for inclination shallowing. The start of the Tibetan Himalaya-Asia collision was situated at ~20°N and took place by ~50 Ma.1. Introduction
One of the principal techniques to quantify the timing of collision between India and Asia is to define when the paleomagnetically determined paleolatitudes from terranes on either side of the Neotethyan suture zone in southern Tibet started to overlap. Paleomagnetic results to address this problem in the 1980s and early 1990s [Zhu et al., 1981; Pozzi et al., 1982; Westphal and Pozzi, 1983; Achache et al., 1984; Lin and Watts, 1988; Chen et al., 1993] were partly inconclusive. Recently, this research question has been taken up again by several groups [Chen et al., 2010; Dupont-Nivet et al., 2010; Liebke et al., 2010; Sun et al., 2010; Tan et al., 2010; Chen et al., 2012; Liebke et al., 2012; Sun et al., 2012; van Hinsbergen et al., 2012; Huang et al., 2013; Lippert et al., 2014; Yang et al., 2014]. Surprisingly, and rather paradoxically, the paleolatitude estimates in these recent studies vary from 5°N to 30°N despite the fact that the underlying data are all from the same rock sequences —the regionally extensive Linzizong Group of the Lhasa terrane, which ranges in age from ~69 to ~48 Ma. This spread of paleolatitude estimates correspond to locations of the southern Tibetan margin that are >2500 km apart and result in collision age estimates that range from as young as 35 Ma to as old as 65 Ma. What is the explanation for these differences? Why do different groups of paleomagnetic investigators who study the very same rock sequences report such disparate results? These discrepancies are worrisome because they question the usefulness of paleomagnetism as a primary means for estimating the age and
Journal of Geophysical Research: Solid Earth
RESEARCH ARTICLE
10.1002/2014JB011599
Key Points:
• Linzizong Group volcanic rocks in Nanmulin (Tibet) are variably remagnetized • Remagnetization was induced by
secondary hematite precipitation • We successfully retrieve the
primary NRM direction carried by titanomagnetite Supporting Information: • Readme • Figure S1 • Figure S2 • Figure S3 • Figure S4 • Figure S5 • Figure S6 • Figure S7 • Figure S8 • Text S1 • Text S2 • Text S3 • Text S4 • Text S5 • Table S1 • Table S2 • Table S3 • Table S4 • Table S5 • Table S6 • Table S7 • Table S8 Correspondence to: W. Huang, W.Huang@uu.nl Citation:
Huang, W., et al. (2015), Can a primary remanence be retrieved from partially remagnetized Eocence volcanic rocks in the Nanmulin Basin (southern Tibet) to date the India-Asia collision?, J. Geophys. Res. Solid Earth, 120, doi:10.1002/ 2014JB011599.
Received 10 SEP 2014 Accepted 31 DEC 2014
paleolatitude of the India-Asia collision. Are there uncharacterized geologic and/or paleo- and rock-magnetic processes that result in this wide range in estimates, and if so, can we discriminate reliable data from questionable data?
Several explanations for the range in paleolatitude estimates have already been explored. For example, sedimentary processes can produce significant postdepositionally shallowed inclinations, as shown in sedimentary rocks in southern Tibet [e.g., Tan et al., 2010; Huang et al., 2013]. Additionally, secular variation of the Earth’s magnetic field leads to an intrinsic variation in spot readings of that field over any time interval [e.g., Johnson et al., 2008; Tauxe et al., 2008; Deenen et al., 2011]. Thus, small data sets of volcanic rocks that undersample geomagneticfield behavior may deviate significantly from an accurate estimate of a mean paleomagneticfield direction. The relevance of this problem for Tibetan paleolatitude estimates was recently discussed by Lippert et al. [2014].
Other sources of error may relate, however, to the recording mechanisms of rocks and their vulnerability to remagnetization. Paleogeographic and tectonic reconstructions using paleomagnetic data require that the recorded natural remanent magnetization (NRM) in rocks was acquired at the time of their formation. The acquisition of a geologically stable remanence long after the formation of a rock, termed as secondary magnetization, is an insidious problem for paleomagnetism. Undated or unrecognized secondary remanent magnetizations often obscure or completely replace the primary magnetizations and are thus a common obstacle to applying paleomagnetism to global (plate) tectonic reconstructions [e.g., Elmore et al., 2012; Font et al., 2012; Van Der Voo and Torsvik, 2012]. Suspected mechanisms for remagnetization include elevated temperature, stress, chemical alteration, or secondary mineral growth related tofluid migration or other chemical processes. These processes can act alone or in concert, and they frequently result in changes in the magnetic mineralogy, in the NRM, or both [Jackson and Swanson-Hysell, 2012]. The severity of the problem is illustrated by widespread remagnetization events linked to large-scale tectonic processes, which are common in orogens in North America [e.g., McCabe et al., 1983; Miller and Kent, 1988; McCabe and Elmore, 1989; Elmore and McCabe, 1991; Elmore et al., 2001; Geissman and Harlan, 2002; Evans et al., 2012; Zechmeister et al., 2012], South America [e.g., D’Agrella-Filho et al., 2000; Trindade et al., 2004; Rapalini and Bettucci, 2008; Font et al., 2011, 2012; Tomezzoli et al., 2013], Europe [e.g., Molina Garza and Zijderveld, 1996; Van der Voo et al., 1997; Dinarès-Turell and Garcia-Senz, 2000; Weil and Van der Voo, 2002; Zegers et al., 2003; Gong et al., 2009a; Zwing et al., 2009; Roberts et al., 2010], and Asia [e.g., Chen and Courtillot, 1989; Appel et al., 1991, 1995; Otofuji et al., 2003; Torsvik et al., 2005; Kim et al., 2009; Liu et al., 2011; Appel et al., 2012; Kirscher et al., 2013]. Therefore, proper identification of “remagnetized” and “nonremagnetized” rocks is critical to paleomagnetic research, particularly for paleogeographic reconstructions of continental blocks in convergent orogenic belts.
In this paper, we reinvestigate volcanic sequences of the lower Linzizong Group in the Nanmulin Basin of the southern Lhasa terrane. A previous study [Chen et al., 2010] argued that the observed paleomagnetic results with low inclinations are primary. A low Paleogene latitude (∼10°N) for the Lhasa terrane was calculated, implying its collision with the Tibetan Himalaya at tropical latitudes at ~55–60 Ma [Chen et al., 2010]. We provide more robust data on the age of the volcanic sequences with zircon U-Pb geochronology. We then test whether we can reproduce the paleomagnetic data of Chen et al. [2010]. Third, we provide a detailed rock magnetic analysis, utilizing thermomagnetic experiments, hysteresis data,first-order reversal curve (FORC) diagrams, and isothermal remanent magnetization (IRM) component analysis to evaluate the carriers of the remanent magnetization(s) and their likely age of origin. We also apply end-member modeling of magnetic components [Gong et al., 2009b] to the whole section to identify potential mechanisms for the acquisition of remanent magnetization. Optical and scanning electron microscope inspection is used to visually characterize the magnetic mineralogy. We describe potential NRM acquisition mechanisms for the Paleogene volcanic rocks in the Nanmulin Basin and discuss ourfindings in the context of dating the collision between the Tibetan Himalaya and the Lhasa terrane.
2. Geologic Background
The Lhasa terrane was the southernmost part of the continental Eurasian plate before collision with the continental lithosphere of the Indian plate [Tapponnier et al., 1981; Burg et al., 1983; Allegre et al., 1984; Burg and Chen, 1984; Sengor, 1984; Dewey et al., 1988; Yin and Harrison, 2000]. To the south, it is separated
from the Tibetan Himalaya, derived from the northernmost continental lithosphere of the Indian plate, by the Yarlu-Tsangpo suture. To the north, the Lhasa terrane is separated from the Qiangtang terrane by the Late Jurassic–Early Cretaceous Bangong-Nujiang suture [Dewey et al., 1988; Yin and Harrison, 2000; Kapp et al., 2007] (Figure 1). Before the collision of India with Eurasia, northward subduction of Neotethyan oceanic lithosphere under Eurasia produced a Cordilleran-type continental margin along the southern margin of the Lhasa terrane. This subduction history is, in part, manifested in the Gangdese arc, testified by the vast occurrence of the Paleocene to Eocene Linzizong; volcanic successions are a prominent expression [Coulon et al., 1986; Yuquans, 1995; Ding et al., 2003]. The extrusive Linzizong Group is widely distributed in an east-west elongated belt along the northern edge of the Gangdese arc across the southern margin of the Lhasa terrane. Its emplacement age ranges from 69 Ma to 48 Ma [Coulon et al., 1986; Bureau of Geology and Mineral Resources of Xizang Autonomous Region (BGMRXAR), 1993; Mo et al., 2003; Zhou et al., 2004; He et al., 2007; Lee et al., 2007; Mo et al., 2008; Lee et al., 2009; Ding et al., 2014]. Stratigraphic [Garzanti et al., 1987; Green et al., 2008; Najman et al., 2010; Hu et al., 2012; DeCelles et al., 2014; Orme et al., 2014] and metamorphic [de Sigoyer et al., 2000; Leech et al., 2005; Guillot et al., 2008] arguments are numerous for collision being underway by 55–50 Ma. The Linzizong Group provides an ideal target to use paleomagnetism to determine the paleolatitudes of the Lhasa terrane during the initial stages of the India-Asia collision.
The Linzizong Group typically unconformably overlies strongly deformed Mesozoic strata. It is divided, from bottom to top, into three subunits: the Dianzhong Formation (E1d), the Nianbo Formation (E2n), and
the Pana Formation (E2p) [Team of Regional Geological Survey of the Bureau of Geology and Mineral Resources
of Tibet Autonomous Region, 1990; Liu, 1993; Leier et al., 2007; Mo et al., 2007]. In the Nanmulin Basin, approximately 50 km northeast of Xigaze (Figure 1a), the Linzizong Group is well exposed and has a thickness of∼4500 m (Figure 1b). The investigated successions consist of the E1dand E2nunits, whereas the
youngest E2punit is missing (Figure 1b) [Geological Survey of Tibet Autonomous Region (GSTAR), 2002]. The lowest E1dstrata lie unconformably on the older Cretaceous Shexing Formation. E1dis composed of
andesitic lavas at the bottom, strongly altered brown grey dacitic to rhyolitic tuff in the middle, and pinkish massive andesitic tuff layers near the top (Figure S1 in the supporting information). Thin red siltstone layers are also found near the top. E2nis separated from E1dby a slight angular unconformity. This unit is characterized by interbedded red siltstone and pinkish andesitic tuff layers that are similar in composition to the top of E1d(Figure S1 in the supporting information). Neogene strata unconformably overlie E2n
north of the study region (Figure 1b). In our section, E1ddips consistently to the north, whereas a local
kilometer-scale fold is expressed by E2nstrata with part of the strata dipping to the south (Figures 1c and
1d). Although many geochronologic studies have been done on the Linzizong Group, especially in the Linzhou Basin [Bureau of Geology and Mineral Resources of Xizang Autonomous Region (BGMRXAR), 1993; Mo et al., 2003; Zhou et al., 2004; He et al., 2007; Lee et al., 2007], no isotopic age data from the Linzizong Group in the Nanmulin Basin have been reported.
3. U-Pb Geochronology
Two hand samples were collected from the massive tuff layers in the upper part of E1d(ND4) and tuff layers in the lower part of E2n(ND10) for U-Pb geochronologic analyses (Figure 1b). Methods and procedures
for U-Pb zircon geochronology are described in Text S1 in the supporting information. The analytical data are reported in Table S1 in the supporting information.
Zircons from sample ND4 are clear and euhedral with crystal lengths between 20 and 120μm and length to width ratios of 1:1 to 4:1. Zircons show clear oscillatory zoning with rare inherited cores. Forty spot analysis of 30 individual zircon grains (combined rim and core analyses of some individual grains) show a weighted mean age of 51.98 ± 0.44 Ma (2σ, mean square weighted deviate (MSWD) = 0.96) with ages that range between 49.2 and 78.2 Ma (Figure 2a). The ages are all concordant. One grain was excluded from the weighted mean due to inheritance.
Figure 1. (a) Schematic geologic map showing the distribution of the Gangdese batholith and the associated Linzizong volcanic sequences in the Lhasa terrane, southern Tibet (modified from Yin and Harrison [2000] and Lee et al. [2009]). (b) Paleomagnetic sampling locations on a simplified geologic map of the Nanmulin Basin (modified from GSTAR [2002]). (c) Geologic map of the sampled section with bedding attitudes and sampling locations marked. (d) Schematic cross-section along the line AA′ in Figure 1c. Paleomagnetic samples are divided into five groups (group A-E1d-L to group E-E2n-L).
Zircons from sample ND10 are clear and euhedral with crystal lengths between 35μm and 110 μm and length to width rations of 1:1 to 5:1. Zircons show clear oscillatory zoning with no inherited grains or cores. Thirty-five spot analysis of 27 individual zircon grains (combined rim and core analyses of some individual grains) show a weighted mean age of 51.98 ± 0.79 Ma (2σ, MSWD = 0.44) with ages that range between 49.4 and 57.1 Ma (Figure 2b). The ages are all concordant.
Although we have not applied zircon U-Pb dating to the lower part of E1din the Nanmulin Basin, our results
show that the top of E1d(ND4) and the bottom of E2n(ND10) were formed at ~52 Ma. Furthermore, these indistinguishable ages also indicate that the age of the unconformity is ~52 Ma. Importantly, there is no significant age gap between the upper part of E1dand overlying E2ndirectly above the unconformity.
4. Paleomagnetic Sampling
Typical 2.5 cm diameter paleomagnetic cores were collected using a portable gasoline-powered drill and oriented with magnetic and Sun compasses. Each paleomagnetic sampling site consists of at least eight independent core samples. Bedding attitudes determined from the planar orientation of the top surface of the volcanicflows and interbedded sedimentary layers were measured throughout the section at several sampling sites. The observed variations in the orientations of measured bedding are small within each of the two sampled areas. For E1d, a mean bedding orientation (dip azimuth = 3.4°N; dip = 24.5°;α95= 3.3°) from
30 measurements was applied to all the samples (Table S2 in the supporting information). Similarly, we also calculated and applied a mean bedding orientation (dip azimuth = 181.1°N; dip = 16.6°;α95= 4.7°) from 26 measurements for all samples from E2n(Table S2 in the supporting information).
We divided our samples intofive groups on the basis of lithologic differences described in the geologic setting and following the paleomagnetic studies described below (Figure 1d). Group A-E1d-L (“L” stands for lava) includes sample sites NL1, NL2, and NL3, which are fresh lavaflows collected near the base of E1d. Group
a)ND4
b)ND10
Figure 2. Zircon U-Pb dating of the collected volcanic samples from the Linzizong Group in the Nanmulin Basin. (a) Sample ND4 from the massive tuff layers from the upper part of E1d. (b) Sample ND10 from the tuff layers in E2n. Cumulative age probability plot, individual zircon analyses, and their mean age column, and U-Pb concordia diagram in presented in order in both Figures 1a and 1b. The plots were made using Isoplot 3.60 [Ludwig, 2008].
B-E1d-L includes sites from NL4 through NL 16; these samples are from the middle part of E1d. Group C-E1d-L
contains sites NL17 through NL28; these samples are from slightly altered pinkish massive tuff layers at the top of E1d. Group D-E2n-S (“S” stands for sediment) includes sites NL29 through NL33, which are from red siltstone layers in E2n. Group E-E2n-L consists of sites NL34 through NL40 and were collected from the pinkish
tuff layers that are intercalated with the red siltstone from group D-E2n-S in E2n.
5. Demagnetization and Analysis of the Directions of the Characteristic
Remanent Magnetization
5.1. Demagnetization
We isolated characteristic remanent magnetization (ChRM) directions using both thermal and alternating field (AF) demagnetization. Samples were heated and cooled in an Alto-Shaam convection oven (model TD48-SC) that has a residualfield less than 10 nT. The natural remanent magnetization (NRM) was measured on a horizontal 2G Enterprises DC superconducting quantum interference device (SQUID) cryogenic magnetometer (with a noise level of 3 × 10 12Am2). AF demagnetization was completed with an in-house developed robotized sample handler [Mullender et al., 2005] attached to a horizontal pass-through 2G Enterprises DC SQUID magnetometer (noise level of 2 × 10 12Am2) hosted in the magnetically shielded room (residualfield <200 nT) at the Fort Hoofddijk Paleomagnetic Laboratory, Utrecht University (Netherlands). Samples were progressively demagnetized with 19 thermal steps ranging from room temperature to 690°C. Progressive AF demagnetization was performed with 22 successive steps from 0 up to 100 mT.
Most samples from groups A-E1d-L, C-E1d-L, D-E2n-S, and E-E2n-L display high-temperature or high-coercivity
magnetizations that decay linearly toward the origin (Figure 3), whereas only a few samples from group B-E1d-L reveal linear demagnetization trajectories during thermal or AF treatment.
For samples from group A-E1d-L, a NRM component was commonly removed at low temperature (150°C) or
lowfield level (20 mT) by thermal and AF treatment (Figures 3a–3c), respectively. After removing this weak component, a second component with a lower unblocking temperature (<450°C, defined as low-temperature component (LTC) hereafter) albeit a higher coercivity (>60 mT) was often also isolated, and a third component was unblocked by 560–580°C (defined as intermediate temperature component (ITC) hereafter) and within a 30–60 mT coercivity window (Figures 3a–3c and Figure S2a in the supporting information). These two components have indistinguishable ChRM direction.
Samples from group B-E1d-L volcanic deposits did not respond well to thermal or AF demagnetization. The NRM intensity for most samples was usually weak (1 × 10 4 6 × 10 2A/m). No well-defined ChRM could be isolated from more than half of the samples because of an overprint or erratic demagnetization behavior (Figures 3d and 3e). A component that unblocked between 450 and 580°C and between 25 and 100 mT could be isolated after removing an initial component up to 450°C or 25 mT for some samples (Figures 3f and 3g).
With thermal demagnetization, most samples from group C-E1d-L revealed one or possibly two overlapping
components: an ITC with maximum unblocking temperatures of 560–580°C and a high-temperature component (HTC) with maximum unblocking temperatures of 670–680°C (Figures 3h–3j and 3l–3n, and Figures S2b–S2f in the supporting information). It is difficult to evaluate if these two components share the same direction statistically because of the inherent noise induced by thermal demagnetization, in particular within 450–580°C; we note, however, that a small difference in the direction of the ITC and HTC can be detected in some samples (Figure 3h). ChRM directions of these samples were determined from 450 to 680°C covering both the ITC and the HTC. AF treatment was usually ineffective at isolating the ChRM in these samples.
For the sedimentary samples from sites in group D-E2n-S, the maximum unblocking temperature is around 670–680°C (Figure 3k and Figure S2c in the supporting information). After removing a low-temperature component, a ChRM could usually be isolated between 400 and 680°C.
For volcanic samples from group E-E2n-L, one or possibly two overlapping components with maximum
unblocking temperatures of 560–580°C (ITC) and 670–680°C (HTC) were also isolated during thermal demagnetization (Figures 3h–3j, Figures 3l–3n, and Figures S2b–S2f in the supporting information). It is
usually difficult to discriminate the ITC from the HTC because the two components overlap. ChRM directions determined from the thermal demagnetization were calculated using both the ITC and the HTC. A stable component was also isolated between 10 and 100 mT for all the samples subjected to AF treatment, although the demagnetization trajectories do not decay entirely to the origin (Figures 3l and 3n). We chose the AF results to define the ChRM directions of the samples; thermal results were only used for a few samples when AF results were not available.
Figure 3. Representative demagnetization diagrams for samples covering the entire section. Alternatingfield (AF) and thermal demagnetizations for samples NL2.8 and NL37.3 are shown for comparison. Closed (open) symbols represent the projection of vector end points on the horizontal (vertical) plane; values represent alternatingfield and thermal demagnetization steps in mT (millitesla) and °C, respectively. All diagrams are displayed after bedding tilt correction. (a–c) Samples from group A-E1d-L. (d–g) Samples from group B-E1d-L. (h–j) Samples from group C-E1d-L. (k) Sample from group D-E2n-S. (l–n) Samples from group E-E2n-L. The red
solid line represents high-temperature component (HTC); the red dashed line represents intermediate temperature component (ITC). IntNRMrepresents the intensity
5.2. ChRM Directions
Principal component analysis [Kirschvink, 1980] on at leastfive successive steps resulted in precisely determined ChRM directions for most of these samples (Table S3 in the supporting information). Thermal and AF demagnetization paths for specimens from the same sample are usually comparable, although thermal demagnetization results are sometimes more erratic and yield higher maximum angular deviation (MAD) values (Figures 3b and 3n). Directions with MAD> 5° were systematically rejected from further analysis (Table S3 in the supporting information). Discrete lava site-mean directions with k< 50 and n < 5 were discarded following the volcanic data selection criteria of Johnson et al. [2008] and consistent with the selection criteria used in Lippert et al. [2014] (Table S4 in the supporting information). Paleomagnetic directions were transformed into virtual geomagnetic poles and evaluated using Fisher’s [1953] statistics.
ChRMs from E1dsamples are entirely of reverse polarity, and ChRMs from E2nsamples are entirely of normal
polarity. The results that met our selection criteria were divided into three groups according to rock types: (1) 20 volcanic sites from E1d, (2) 7 tuff sites from E2n, and (3) 38 single measurements of red siltstone specimens from E2n(Figures 4a and 4b and Table S4 in the supporting information). To complement these
groups, we incorporated the corresponding directions of sites xn12–xn18 from E1dand xn01–xn11 from E2n previously reported by Chen et al. [2010] from the same intervals in this area.
The difference in bedding attitude between the sampled E1d(dipping toward the north) and E2n(dipping
toward the south) intervals provides the opportunity to assess the prefolding origin of the interpreted ChRMs by performing several fold tests. The combination of the site data from this study and those from Chen et al. [2010] covers bothflanks of the fold in E2n, which allows us to apply geologically rigorous fold tests to
the red siltstone and tuff in E2nseparately. For the red siltstone, the nonparametric fold test of Tauxe and
Watson [1994] is negative with best grouping reached at 12% to 28% untilting (Figure 5a). For the tuff, the ChRM directions from bothflanks of the fold in E2nhave a common true mean direction (CTMD) with a classification of “B” before tilt correction (Figure 5b) [McFadden and Lowes, 1981; McFadden and McElhinny, 1990], but they are scattered after tilt correction (Figure 5c). The nonparametric fold test of Tauxe and Watson [1994] is also negative with best grouping reached at 2% to 47% untilting (Figure 5b). Moreover, we inspected the directions from volcanic sites in E1dand E2ncombined. Before tilt correction, the ChRM directions of
volcanic sites in E1dand E2nhave a CTMD with a classification of “A” [McFadden and Lowes, 1981; McFadden and McElhinny, 1990] (Figure 5c). After tilt correction, however, the ChRM directions from E1dand E2n
show increased dispersion with k value decreasing from 47.5 (in situ) to 18.1 (tilt corrected) (Figure 5c). The nonparametric fold test of Tauxe and Watson [1994] is clearly negative with best grouping reached at 5% to 7% untilting (Figure 5c). Our U-Pb geochronologic data show that no significant time gap exists between the sampled E1dand E2nintervals and thus exclude the possibility that this negative fold test is induced by
tectonic motion accrued over a long time gap. These threefold tests clearly show that ChRMs recovered from the Linzizong Group in the Nanmulin Basin were largely acquired after folding.
We conclude that the ChRM directions observed in the lower Linzizong Group in the Nanmulin Basin have not faithfully recorded the geomagneticfield at the time of volcanism and sedimentation. Instead, fold tests imply that the magnetizations have a postfolding origin. We present below the results of systematic rock magnetic analyses to determine the carrier(s) of the remanence, and therefore potential processes responsible for remagnetization, and to determine whether the primary (if present) and secondary magnetizations can be successfully isolated.
6. Rock Magnetism and Petrography
6.1. Rock Magnetism
We applied detailed rock magnetic analyses, including thermomagnetic experiments, hysteresis measurements, FORC measurements, and IRM component analysis [Kruiver et al., 2001], with the goal of identifying the magnetic carrier(s) of the studied rocks. Descriptions of the methods used for these analyses are in Text S2 in the supporting information.
Typical thermomagnetic results for samples from group A-E1d-L show an irreversible decrease in magnetization
up to ~600°C (Figure 6a and Figure S3a in the supporting information). These samples are also characterized by two phases distinguished by a clearly steeper decrease in magnetization slope of the thermomagnetic
runs: a LTC (~250–450°C) and an ITC (~450–580°C). The hysteresis loops are relatively open and essentially saturated at 500 mT (Figure 6b and Figure S4a in the supporting information). The Bcand Bcrvalues are also low, indicating a dominant low-coercivity component (Table S5 in the supporting information). The vertical spread of the contours in the FORC diagrams indicates an assemblage of strongly interacting single domain (SD)-like magnetic particles (Figures S5a and S5b in the supporting information) [Roberts et al., 2000; Chen et al., 2007]. Another component with pseudosingle domain (PSD) to multiple domain (MD) state is also observed (Figures S5a and S5b in the supporting information) [Roberts et al., 2000]. The IRM acquisition curves for the samples from group A-E1d-L arefit with three IRM components: a soft component L1 (L stands for lava) with B1/2
(thefield at which half of saturation isothermal remanent magnetization (SIRM) is reached) ~40 mT and dispersion parameter (DP) 0.26 (log units); a relatively hard component L2 with B1/2> 120 mT and a lower DP of ~0.2; and a much harder component L3 with B1/2~400 mT and DP of 0.25 (Figure 6c and Figure S6a and Table S6
Figure 4. (a and b) Equal-area projections of site mean ChRM directions before (IS; Figure 4a) and after (TC; Figure 4b) bedding tilt correction for volcanic sites from both E1dand E2n. The blue circles and dots are the reported results from volcanic rocks by
Chen et al. [2010] from E1dand from E2n(southern limb of the local fold), respectively. Before tilt correction, the average
site mean directions for E1dare the antipode of the average site mean directions for E2n. The common true mean direction
test of the two averages before tilt correction is positive with classification of B [McFadden and Lowes, 1981]. The star represents present-day magneticfield (PDF, following Geocentric Axial Dipole Hypothesis) in the sampled section. (c and d) Equal-area projections of individual ChRM directions before (IS; Figure 4c) and after (TC; Figure 4d) bedding tilt correction for sedimentary specimens from E2n. Note that sedimentary rocks from E2ngive higher inclination values than the intercalated
in the supporting information). We interpret the SD-like magnetic particles carrying the LTC and component L2 to be Ti-rich titanomagnetite, whereas the PSD-MD-like magnetic particles carrying the ITC and component L1 to be Ti-poor titanomagnetite. Components L1 and L2 are the predominant magnetic carriers and contribute more than 95% to the SIRM. A minor contribution (<5%) of hematite to the SIRM is illustrated by component L3 [Kruiver and Passier, 2001].
The rock magnetic properties for volcanic samples from groups B-E1d-L, C-E1d-L, and E-E2n-L are similar to
each other. Representative samples show an irreversible decrease in magnetization up to∼680°C (Figure 6d and Figures S3b–S3f in the supporting information). The observed decrease from 450°C to 580°C and from 620°C to 680°C in magnetization indicates the existence of two components: an ITC (~450–580°C) and a
Geographic 100% Tilt adjusted 95%: (12, 28)
% Untilting -40 0 40 80 120 0.00 0.02 0.04 0.06 0.08 0.10 0.12 0.14 0.16 0.18 F raction of maxima 0.95 0.90 0.85 0.80 0.75
a) Red siltstone from E2n
95%: (-5, 7) % Untilting -40 0 40 80 120 0.00 0.02 0.04 0.06 0.08 0.10 F raction of maxima 0.94 0.92 0.90 0.88 0.86 0.84 0.82 0.80 0.78
Geographic 100% Tilt adjusted
c) Volcanic rocks from E1d and E2n b) Volcanic rocks from E2n
Geographic 100% Tilt adjusted 95%: (2, 47)
% Untilting -40 0 40 80 120 0.00 0.02 0.04 0.06 0.08 0.10 F raction of maxima 0.94 0.92 0.90 0.88 0.84 0.86
Figure 5. (a and b) Nonparametric fold tests [Tauxe and Watson, 1994] applied on (Figure 5a) the red siltstone and (Figure 5b) tuff from both the southern and northern limbs in E2n, respectively. Equal-area plots of the individual ChRM directions from each specimen are shown in (left) geographic coordinates and (right)
after tilt correction. (Figure 5, right) Results of the fold test with bootstrapped statistics on thefirst eigenvalues (τ1) upon progressive untilting. The 95% bootstrap error
interval is indicated. Before tilt correction, the ChRM directions for samples from both siltstones and tuffs are clustered. After tilt corrections, these directions become scattered. (c) The same nonparametric fold test applied to E1dand E2nvolcanic samples. Before tilt correction, the ChRM directions of samples from E1dand E2n
a) NL1.2 d) NL22.7 g) NL32.4
c) NL1.1 f) NL25.4 i) NL29.7
e) NL25.4 h) NL32.4
b) NL1.2
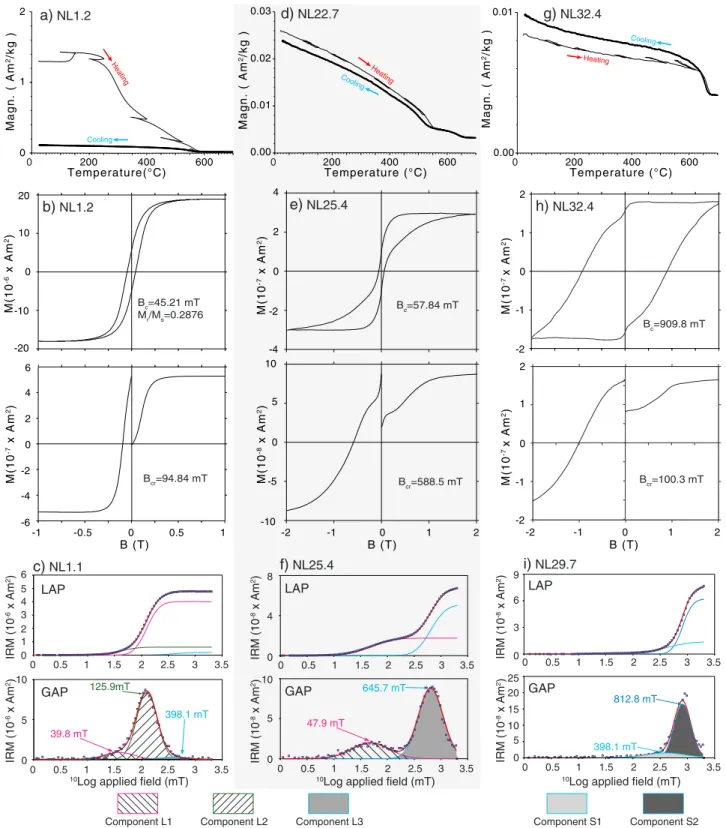
Figure 6. Typical rock magnetic results from samples from (a–c) group A-E1d-L; (d–f) groups B-E1d-L, C-E1d-L, and E-E2n-L; and (g–i) group D-E2n-S. For each group, a
representative high-field thermomagnetic run with thin (thick) lines representing the heating (cooling) curves; hysteresis loop, IRM acquisition, back-field curves, and IRM component analysis results are shown. The thermomagnetic runs were performed in air. Heating and cooling rates were 10°C min 1. The hysteresis loops, IRM acquisition curves, and back-field curves were measured for B between 2 T and 2 T. Hysteresis loops are corrected for the paramagnetic contribution. Ms: saturation magnetization, Mr: remanent saturation magnetization, and Bc: coercive force; IRM component analysis was applied following Kruiver et al. [2001]. The squares are
the measured data points. The components are marked with different colored lines in the linear acquisition plot (LAP) and as hatches in the gradient acquisition plot (GAP). Three components (components L1 to L3) are required tofit the IRM acquisition curves of the volcanic rocks from groups A-E1d-L, B-E1d-L, C-E1d-L, and E-E2n-L.
Two components (components S1 and S2) are required tofit the IRM acquisition curves of the sedimentary samples from group D-E2n-S. SIRM is in 10 6Am2; log10(B1/2)
HTC (~620–680°C). The hysteresis loops are generally wasp waisted and remain unsaturated within a 2 T field (Figure 6e and Figures S4b–S4f in the supporting information), indicating the combination of magnetic minerals with low and high coercivities [Roberts et al., 1995; Tauxe et al., 1996]. The FORC distributions of these samples are characterized by contours that diverge away from the origin and are spread along the Huaxis
(Figures S5c–S5h in the supporting information). This contour pattern is consistent with the behavior of typical interacting PSD to MD magnetic particles [Pike et al., 1999; Roberts et al., 2000]. A soft component L1 and a very hard component L3 are required tofit the IRM acquisition curves of these samples (Figure 6f and Figures S6b–S6f and Table S6 in the supporting information). Similar to the results from samples in group A-E1d-L, the ITC and component L1 are carried by Ti-poor titanomagnetite of PSD-MD state, whereas the HTC and component L3 illustrate the contribution of hematite. However, hematite is the dominant magnetic carrier for most samples from groups B-E1d-L, C-E1d-L, and E-E2n-L; its contribution to the SIRM is up to 90%.
For the siltstone samples from group D-E2n-S, the sharp decrease in magnetization from 620°C to 680°C is typical of hematite [Dunlop and Ödemir, 1997] (Figure 6g). It has potbellied hysteresis loops and is not fully saturated in a 2 Tfield in both hysteresis loops and IRM acquisition curves (Figure 6h); these observations are consistent with the presence of hematite as magnetic carrier. Both of the two components (component S1 and component S2, S stands for sediments) required tofit the IRM acquisition curves represent hematite because of their very high B1/2values (Figure 6i and Table S6 in the supporting information); this is consistent
with the results from the thermomagnetic experiments and hysteresis analyses.
6.2. Petrography
To identify textural relationships that may help elucidate remagnetization processes, polished thin sections of four representative samples from groups A-E1d-L (NL1.2), C-E1d-L (NL22.7 and NL27.4), and E-E2n-L (NL40.8)
were investigated with optical microscopy. These samples were subsequently inspected with a scanning electron microscope (SEM) to reveal the microtextures of the magnetic minerals, which in turn can provide additional constraints on diagenetic conditions and their effect on the magnetic signal. A Hitachi S3400 SEM, operated at 20 keV and 40–60 nA at the Electron Microscope Unit at the University of Hong Kong, was used for these observations. Detailed optical petrographic observations of these thin sections can be found in Text S3 in the supporting information. In general, sample NL1.2 from group A-E1d-L shows evidences
for slight alteration, whereas evidence for pervasive low-temperature hydrothermal alteration is observed in samples from groups C-E1d-L and E-E2n-L (Table S7 in the supporting information).
SEM observation provides detailed textural information about the iron oxides. Titanomagnetite is abundant in sample NL1.2 from group A-E1d-L, which is consistent with the high-NRM intensity of this
sample (Figure 7a). Titanomagnetite grains range from less than 10μm to over 200 μm (Figures 7a–7c). The titanomagnetite grains are either euhedral or have resorbed edges (Figures 7b and 7c). These grains host numerous inclusions of ilmenite and silicate minerals. Most of the grains show solid-state exsolution features with a trellis of relatively Ti-rich lamellae distributed in a Ti-poor host. This high-temperature exsolution feature suggests that the host andesitic lavaflow was formed during a slow-ascending eruption [Turner et al., 2008]. It also implies that the titanomagnetite is primary.
The abundance of titanomagnetite grains in samples from groups C-E1d-L and E-E2n-L is remarkably less than that of NL1.2 (group A-E1d-L), which is in agreement with their generally weak magnetizations. Two
iron oxides with contrasting petrographic features are present in these samples: titanomagnetite and hematite. The titanomagnetite grains are euhedral to subhedral and are usually more than 100μm in size (Figures 7e, 7g, 7h, 7j, 7k, and 7o). Most titanomagnetite grains with inclusions also show exsolution features, indicating that they have a primary origin (Figures 7e, 7g, 7h, 7j, 7k, and 7o). Another iron oxide with very different habits (Figures 7d and 7f–7o) is hematite, based on the rock magnetic studies described above. This hematite usually has a veryfine grain size and is characterized by a very different distribution within the rock from the titanomagnetite grains. Four distinct habits of hematite are observed. One habit is distributed along cracks in what appears to be precipitation from a secondaryfluid (Figure 7d). A second habit is distributed along the cleavage of magmatic biotite as an alteration product (Figures 7f–7i). A third habit coexists with clay minerals associated with feldspar alteration (Figures 7j–7o). A fourth habit is distributed around titanomagnetite grains as an oxidation product (Figures 7j, 7k, and 7o). These textural observations suggest that titanomagnetite was formed during cooling of the magma, whereas hematite crystallized postemplacement.
Figure 7. SEM backscattered electron images for selected samples. Hem: hematite, Ti-Mt: Titanomagnetite. (a–c) Sample NL1.2 from group A-E1d-L, with abundant
titanomagnetite particles showing solid-state exsolution features. (d) Hematite growing along a fracture in sample NL22.7 from group C-E1d-L. (e) A large inclusion-rich
titanomagnetite grain with solid-state exsolution features in sample NL22.7. (f ) Hematite growing along cleavage planes within a preexisting silicate mineral (probably biotite) in sample NL22.7. (g and h) Large titanomagnetite grains coexisting with exsolvedfine hematite from biotite in sample NL27.4 from group C-E1d-L.
(i) Hematite exsolved from deformed biotite crystal and grown within the cleavage of sample NL27.4. (j and k) Fine-grained authigenic hematite that has grown around the large titanomagnetite grain in sample NL40.8 from group E-E2n-L. (l and m) Low-magnification and corresponding high-magnification view of sample
NL40.8 shows hematite growing around the edge of silicate minerals. (n) The large feldspar pyroclast intruded by quartz vein is altered to albite and iron oxides in sample NL40.8. (o) Euhedral titanomagnetite grains in sample NL40.8.
7. End-Member Modeling of Magnetic Components
To further illustrate and identify the processes responsible for remagnetization, we applied the end-member modeling method recently developed by Gong et al. [2009b]. This method has been helpful for identifying remagnetized and nonremagnetized sedimentary rocks independent of paleomagneticfield tests [Gong et al., 2009b; Van Hinsbergen et al., 2010; Meijers et al., 2011; Dekkers, 2012; Aben et al., 2014], although it heretofore has not been applied to volcanic rocks. Detailed methods of the end-member modeling are described in Dekkers [2012].
To ensure that we have fully characterized the end-members, we measured IRM acquisition curves from 112 samples representing the entire studied section (24 from group A-E1d-L, 15 from group B-E1d-L, 25 from
group C-E1d-L, and 48 samples from group E-E2n-L). Prior to measuring each IRM acquisition curve, each
sample was demagnetized along three orthogonal axes in a 300 mT AFfield with the last demagnetization axis parallel to the IRM acquisitionfield; this procedure minimizes the effects of magnetic interaction and thermal activation on the shape of the IRM acquisition curves [Heslop et al., 2004]. The IRM was acquired in 61 logarithmically increasingfield steps from 0 up to 700 mT on the same in-house-developed robot described previously. All data were acquired with a two-position measurement protocol, which allows the best correction of the sample tray [Dekkers, 2012].
MATLAB modules with the end-member modeling algorithm of Weltje [1997] were used to analyze the data [Heslop and Dillon, 2007]. The program normalizes all IRM curves to their maximum value to form a closed data set. The solutions for two to nine end-members were calculated, and the following criteria were used to select the optimal number of end-members: (1) a coefficient of determination r2between the input data and the end-member model [Heslop et al., 2007] must be>0.8, (2) inclusion of yet another end-member provides marginal interpretational value, (3) virtual duplication of end-members should be avoided: the limit of interpretational power has been reached, and (4) the program calculates the end-member model by iteration until a threshold convexity error has been reached (set at 6) following Weltje [1997]; if that convexity is not reached within 1000 iterations, then, the convexity error at termination can also be used to judge the quality of the model [Dekkers, 2012].
End-member solutions reveal that a two-end-member model has a higher convexity of 4.9528 (after 1000 iterations) and an r2value of 0.78113 (Figure 8a), which is lower than 0.8; thus, this model is rejected. A three-end-member model has an r2value of 0.86121, above the lower limit of 0.80, and convexity of
2.5707 (Figure 8a). The model with four end-members has yet a higher r2of 0.90819 and lower convexity of 1.7154 (Figure 8a). The models withfive or more end-members are characterized by virtual duplication of end-members, which means the data set is overinterpreted in those cases.
Comparison of the models with three and four end-members shows that the end-members EM1 and EM2 are indistinguishable, whereas EM3 in the three-end-member model is divided into EM3 and EM4 in the four-end-member model (Figures 8b and 8c). The calculated end-member IRM acquisition curves are subjected to IRM component analysis as described below. In the IRM component analysis results of different end-members of the two models, EM1 and EM2 are interpreted to be hematite and Ti-rich titanomagnetite, respectively (Figures 8b and 8c). EM3 is interpreted in the three-end-member model as a combination of Ti-poor titanomagnetite and hematite (Figures 8b and 8c); both EM3 and EM4 in the four-end-member model are also considered combinations of Ti-poor titanomagnetite and hematite. From these results, we conclude that the four-end-member model does not discriminate more distinctive and geologically interpretable end-members than the three-end-member model. Thus, we prefer to interpret our data set using the three-end-member model.
The shape of the normalized IRM acquisition for each of the three end-members is shown in Figure 8b. EM1 is far from saturation in a 700 mTfield, which is typical for hard magnetic minerals. EM2 is rather soft; it is fully saturated in a 400 mTfield. EM3 is considered a mixture of magnetic minerals with variable coercivities. It is partially saturated at 100 mT, but it is not fully saturated at 700 mT.
We applied IRM component analysis to these three end-members [Kruiver et al., 2001]. Six components (component 1 to component 6, increasing from magnetically soft to hard) can be recognized in total (Figures 8e–8g). EM1 can be fit with two components with very high coercivities (components 4 and 6; Figure 8e); these two components are probably hematite. We interpret EM2 to be Ti-rich titanomagnetite,
a)
c) d)
b)
e) EM1 f) EM2 g) EM3
Figure 8. End-member modeling of acquisition curves of IRM of the volcanic rocks. (a) Diagram showing the r2versus number of end-members. (b and c) End-member modeling for the normalized IRM acquisition curves with (Figure 8b) three and (Figure 8c) four end-members. (d) Ternary plot of the three-end-member model showing end-member percentages for each specimen. Red diamonds: samples from group A-E1d-L; black dots: samples from groups B-E1d-L, C-E1d-L, and E-E2n-L. Group D-E2n-S
(sediments) is not considered here. (e–g) IRM component analysis [Kruiver et al., 2001] of the end-members in the preferred three-end-member model. The squares are the calculated data points from end-member modeling that are used tofit the IRM components. The components are marked with differently colored lines in the linear acquisition plot (LAP); in the gradient acquisition plot (GAP), they are shown in hatches. Component 1 has a very low coercivity and contribution; it is not assigned a physical meaning. Components 2 and 3 are more prominent; they represent Ti-poor and Ti-rich titanomagnetite. Components 4, 5, and 6 have the highest coercivity and show properties characteristic of hematite. The IRM is normalized to the highest IRM value (IRM/IRM700 mT); log10(B1/2) and DP are in log10millitesla. The values of B1/2are
based on its fairly high B1/2of ~90 mT
(Figure 8f). The IRM acquisition curves for EM3 arefit with three IRM components: component 1 with B1/2of ~13 mT, soft component 2 with a B1/2of ~45 mT, and a very hard component 5
with B1/2of ~600 mT (Figure 8g). Component
1, a very low-coercivity component, constitutes only∼7% of the SIRM; it is only required tofit the skewed-to-the-left distribution of component 2 and is not given physical meaning other than being the result of thermally activated component 2 particles [Egli, 2004; Heslop et al., 2004]. Component 2 and component 5 typically represent Ti-poor titanomagnetite and hematite, respectively. The contribution of component 2 to the SIRM is approximately 60%, and the contribution of component 5 to the SIRM is around 30% (Table S7 in the supporting information). For fitting of the three end-members, components 2 and 3 are ascribed to Ti-poor and Ti-rich titanomagnetite, respectively; components 4, 5, and 6 are all hematite but with different grain sizes. The components (components 2–6) required to fit the end-members in three-end-member model in IRM component analysis are thus consistent with the
components for the IRM acquisition curve fitting of the volcanic rocks in our rock magnetic studies described above (Figure 6 and Table S6 in the supporting information). This observation illustrates that the three end-members are geologically interpretable, a feature of the technique emphasized by Weltje [1997]: interpreters should strive for geologically meaningful end-members and not lean too much on only mathematically dictated solutions.
In a ternary plot (Figure 8d), most samples from groups B-E1d-L, C-E1d-L, and E-E2n-L
(black dots) are mixtures of EM1 and EM3 with minor contributions from EM2. In contrast, samples from group A-E1d-L (red diamonds) plot very close to the baseline with most of them clustering around the EM2 apex. Additionally, careful inspection of the ternary plot reveals that more samples plot closer to EM1 than EM3, which means that the contribution of EM1 is higher than that of EM3 for most samples in groups B-E1d-L, C-E1d-L,
and E-E2n-L.
Interpretations of the rock magnetic and petrographic studies and end-member
T able 1. Summa ry of the P aleom agnetic and Per to graphic Studie s and End-M embe r Mode ling a Group A-E 1d -L B-E 1d -L C-E 1d -L D-E 2n -S E-E 2n -L Sites NL1-3 NL4-16 NL17-28 NL29-33 NL34-40 Format ion E1d E1d E1d E2n E2n Rock Fresh ande sitic lava Altered brow n-grey dac itic to rhyolitic tu ff Pi nkish ande sitic tuff Red si ltstone P inkish ande sitic tu ff ChRM 25 0– 4 50°C; 525 –580°C; 30 –60 mT 45 0– 580°C 450 –58 0°C; 6 2 0– 680°C 400 –68 0°C 450 –580° C; 620 –68 0°C; 40 –90 mT Thermo mag netic Runs LT C: Ti-ric h TM; IT C: Ti-poo r T M IT C: Ti-p oor TM ; HT C: hem atit e IT C: Ti-p oor TM; H T C: hem atite HT C: hemat ite IT C: Ti-poo r TM; HT C: hem atite Hystere sis SD: Ti-ric h TM; PSD-MD: Ti-poo r T M PS D-MD: Ti-poo r TM; hem atite PS D-MD: Ti-poo r TM; hem atite Hemat ite SD-PSD: Ti-poo r TM ; hemat ite IRM Comp onent ana lysis 95% Ti-poor T M and Ti-ric h TM; 5% Hematit e. 1 0-35% Ti-poo r TM. Up to 90% hem atite. 5-50% Ti-poo r TM. Up to 95% hem atite. 100% hem atite 25-80% Ti-poo r T M. Up to 80% hem atit e. SEM Prima ry TM Prima ry TM and secondary hem atite Prim ary TM and second ary hemat ite End-me mber EM 2:T i-rich TM EM1 (he matite )> EM 3 (high-poor TM and hem atit e) >> EM2 Ti-ric h T M EM1 (he matite )> EM 3 (high-po or TM and hem atit e) >> EM2 Ti-ric h T M E M 1 (hema tite) > EM3 (high -poor TM and hem atite) > EM2 Ti-ric h T M a LT C– low-te mper ature component, IT C– Inte rmedia te temp eratur e com pone nt, HT C– High -tempe rature component, SD –single doma in, PS D –pseu dosingl e doma in, MD –multiple doma in, and TM –titanomagnet ite.
modeling are summarized in Table 1. Based on the analysis described above for the mineralogical interpretation of the three end-members and the contribution of each end-member estimated from the ternary plot (Figure 8d), it is clear that magnetic carriers for most samples in groups B-E1d-L, C-E1d-L, and
E-E2n-L are dominated by secondary hematite with a minor contribution from magmatic titanomagnetite, whereas the dominant magnetic carrier in group A-E1d-L is magmatic titanomagnetite. We thus suspect
that the secondary ChRM indicated by the negative paleomagneticfield tests is carried mostly by secondary hematite.
8. Discussion
8.1. Acquisition of the Natural Remanent Magnetization
Remagnetization may be the result of thermoviscous resetting [e.g., Kent, 1985; Johnson and Swapp, 1989; Harlan et al., 1996]. Considering that the lower E1dunit is regionally intruded by Eocene granitic plutons (Figure 1b) and large volumes of Neogene lavas crop out north of the studied Nanmulin section, we suspect that thermal conduction from this volcanic episode resulted in remagnetization of the Linzizong Group in the Nanmulin Basin. However, this is inconsistent with rock magnetic and petrographic results that show that secondary hematite is a prominent magnetic carrier. Furthermore, apatitefission track thermochronology of samples from the E1dand E2nvolcanic rocks, as well as the adjacent granitic plutons (Figure 1b) clearly indicates that the Linzizong volcanic rocks in the Nanmulin area were never heated above ~110°C since eruption [Yuan et al., 2007]. Therefore, we conclude that a more viable mechanism for remagnetization of the Linzizong Group in the Nanmulin Basin is the growth of new magnetic particles at low temperature by alteration andfluid flow. This would result in a chemical remanent magnetization (CRM) residing in the secondary magnetic mineral(s) crystallized at temperatures well below the Curie temperature. This mechanism is a widespread cause of remagnetization [e.g., Dekkers, 2012; Elmore et al., 2012].
Precipitation and growth of secondary hematite to produce CRMs during low-temperature hydrothermal alteration of igneous rocks have been described by several workers [e.g., Edel and Schneider, 1995; Edel and Aifa, 2001; Geissman and Harlan, 2002; Ricordel et al., 2007; Preeden et al., 2009; Parcerisa et al., 2013]. Edel and Schneider [1995] found that high laboratory unblocking temperature magnetizations carried by secondary hematite and hematized titanomagnetite could be isolated in Upper Carboniferous-Lower Permian rhyolites from Northern Vosges (France). These magnetizations fail a fold test and display directions consistent with Middle-Upper Permian directions from Variscan, Europe. Continuous overprinting due to low-temperature alteration of titanomagnetite and crystallization of secondary hematite from the Middle Permian to Upper Permian was suggested to explain the resetting of the primary magnetization. In another example, Geissman and Harlan [2002] studied Precambrian crystalline units in the Rocky Mountains and suggested that magnetization of exclusively reversed polarity in those rocks was presumably acquired during the Permo-Carboniferous reversed superchron. The dominant magnetic carrier of these plutonic rocks is secondary hematite, which was formed during migration of basinalfluids (at temperatures below 200°C) along regional nonconformities and fracture or fault zones in Precambrian basement rocks.
Analogously, we suggest that secondary hematite growth is responsible for the (partial) magnetization resetting of the Linzizong Group observed in the Nanmulin Basin. The widespread occurrence of residual Ti-rich titanomagnetite in samples from group A-E1d-L and the rare presence of secondary hematite suggest
that these rocks probably carry a primary remanence. The observed ChRM directions of samples from group A-E1d-L have steeper inclinations than samples from groups B-E1d-L, C-E1d-L, and E-E2n-L (Table S4 in the supporting information). Nevertheless, a robust paleopole cannot be calculated from only three site mean directions. Samples from groups B-E1d-L, C-E1d-L, and E-E2n-L are characterized by variable amounts of
secondary hematite and magmatic Ti-poor titanomagnetite, supporting the conclusion that these rocks are partially remagnetized, as indicated by the negative fold tests. Red siltstones in group D-E2n-S only
have hematite as a remanence carrier and are completely remagnetized as indicated by the failed fold test. Mineralogically, the remagnetization processes are characterized by decomposition of the Ti-rich titanomagnetite and precipitation of the secondary hematite, whereas part of the relatively stable Ti-poor titanomagnetite survived the alteration processes.
We hypothesize that the secondary hematite growth occurred either by circulation of hydrothermalfluids, by paleoweathering, or by a combination of these processes. Weathering during the generation of the unconformity between E1dand E2nis unlikely, however, because both alteration and related remagnetization
of the tuff and siltstone layers are also observed in the overlying E2nformation. The siltstone in E2nappears to be completely remagnetized, but the overlying tuffs in E2nappear to be only partially remagnetized,
a conclusion based mostly on the relative contribution of hematite to the SIRM (Table S6 in the supporting information). Interestingly, the concentration of secondary hematite appears to decrease downward and upward from the siltstone layers in E2n. We suggest that these siltstones served as a conduit for a
low-temperature, oxidizing hydrothermalfluid. This fluid could have migrated along the unconformity between E1dand E2nand percolated downward and upward from this unconformity. It liberated iron
from titanomagnetite and from some silicates that were precipitated quickly as hematite afterward. This process can explain the distribution of secondary hematite growth and (partial) overprinting of the original magnetization. The observation that group A-E1d-L volcanic rocks in E1dfarthest from the siltstone layers
and the unconformity have not been affected by remagnetization is consistent with this interpretation. The age of the low-temperature hydrothermal alteration is unknown, but the negative fold test indicates that the CRM postdates the folding. Moreover, before the bedding tilt correction, the CRM directions defined by the red siltstones in E2nare clustered around a direction that is different from the geocentric axial
dipolefield direction for the present latitude of the section with a difference in inclination of 9.3°±3.9°. This suggests that the CRM was acquired before the Brunhes Chron (780,000 years ago). Remagnetization of E1d and E2nmust have occurred at different times, because they have different polarities (Figures 4a and 4b).
The duration of the remagnetization event may have been an extended period of time, but the antipodal character (Figure 4a) of the ChRMs from both formations shows that there was no appreciable change in latitude or vertical axis rotation during this time period. We emphasize that we cannot confirm that this was the actual sequence of events responsible for the remagnetization demonstrated by the negative fold tests, rock magnetic studies, and petrographic observations; it is, however, consistent with the regional geology of the Nanmulin Basin.
8.2. An Attempt to Recover the Primary Inclinations From Partially Remagnetized Strata
The ChRMs that we and Chen et al. [2010] isolated from the Linzizong Group in the Nanmulin Basin are a mixture of a primary thermoremanent magnetization (TRM) carried by magmatic titanomagnetite and a secondary CRM carried by pigmentary hematite. Ideally, these TRMs and CRMs with different directions could be separated during thermal or AF demagnetization because of the different unblocking temperature orfield spectra of titanomagnetite and hematite. However, the directions from the TRM cannot be clearly distinguished from the CRM (Figure 3) because the unblocking temperature andfield spectra for titanomagnetite and pigmentary hematite overlap. Further discussion on this point is provided in Text 4 in the supporting information.
Because standard paleomagnetic analyses fail to isolate the primary direction from the partially remagnetized volcanic rocks from groups B-E1d-L, C-E1d-L, and E-E2n-L, the paleomagnetic results from the Nanmulin Basin should be, in principle, disregarded in paleogeographic reconstructions. However, the simultaneous unblocking of the primary and secondary components, and the variable degree of pigmentary hematite contribution of our samples, inspired us to attempt a novel approach to isolate the primary and overprint directions.
To this end, wefirst use the IRM component analysis of each sample to estimate the percentages of the signal carried by hematite and titanomagnetite, respectively. For the 45 samples with ChRM directions isolated by AF demagnetization in group E-E2n-L that pass thefilter for the ChRM direction selection described above, we plotted the inclination and declination of each ChRM direction before and after tilt correction against the percent contribution of hematite to the SIRM. For the inclination, the result shows a distinct linear correlation between inclination and the contribution of hematite to the SIRM in the sample (Figures 9a and 9b). In in situ coordinates, the slope of the line is 0.2042, indicating that the inclination of the ChRM direction increases with increasing amount of hematite (Figure 9a). The square of Pearson’s correlation coefficient (R2) is 0.3948, which is higher than the critical value of 0.3458 for 45 samples with p = 0.02. In tilt-corrected coordinates (Figure 9b), the slope of the line is 0.1982. The square of Pearson’s correlation coefficient (R2) is 0.3775, which is also higher than the critical value of 0.3458 for 45 samples (p = 0.02).
0 10 20 30 40 50
Inclination° (in situ) N = 45 R
2 = 0.3948
m = 0.2042 dm = 0.04 c = 22.52
0 20 40 60 80 100
Hematite contribution to SIRM (%)
a) b) c) d) f) e) g) h) 22.5 42.9 [20.1, 24.9] [41.5, 44.4] 0 10 20 30 40 50 60 70
Inclination° (tilt corrected)
m = 0.1982 dm = 0.04 c = 38.10
0 20 40 60 80 100
Hematite contribution to SIRM (%)
N = 45 R2 = 0.3775 38.1 57.9 [35.7, 40.5] [56.5, 59.4] N = 45 R2 = 0.0167
Declination° (in situ)
300 310 320 330 340 350 360 N = 45 R2 = 0.0013 0 20 40 60 80 100
Hematite contribution to SIRM (%)
Declination° (tilt corrected)
0 20 40 60 80 100 300 310 320 330 340 350 360
Hematite contribution to SIRM (%)
Inclination° (in situ)
-60 -50 -40 -30 -20 -10 0 10 50 60 70 80 90 100 N = 27 R2 = 0.0265
Hematite contribution to SIRM (%)
Inclination° (tilt corrected)
-60 -50 -40 -30 -20 -10 0 10 N = 27 R2 = 0.0422 50 60 70 80 90 100
Hematite contribution to SIRM (%)
N = 27 R2 = 0.035
Declination° (in situ)
Hematite contribution to SIRM (%)
120 130 140 150 160 170 180 190 200 40 50 60 70 80 90 100
Hematite contribution to SIRM (%)
Declination° (tilt corrected) 120 130 140 150 160 170 180 190 200 N = 27 R2 = 0.0379 40 50 60 70 80 90 100
Figure 9. (a and b) The hematite contribution to the SIRM in percentage versus magnetic inclination (Figure 9a) before and (Figure 9b) after tilt correction for 45 tuff samples from E2n(all ChRM directions determined from AF demagnetization). The
regression lines with 95% confidence intervals are indicated with the black lines and shaded areas. (c and d) The hematite contribution to the SIRM in percentage versus magnetic declination (Figure 9c) before and (Figure 9d) after tilt correction for the same 45 samples. (e and f) The hematite contribution to the SIRM in percentage versus magnetic inclination (Figure 9e) before and (Figure 9f) after tilt correction for 27 lava samples from E1d(ChRM directions mostly determined from thermal
demagnetization). (g and h) The hematite contribution to the SIRM in percentage versus magnetic declination (Figure 9g) before and (Figure 9h) after tilt correction for the same 27 E1dsamples. N: number of the samples selected; R2: square of Pearson’s
Based on the normality assumption, the estimator of the slope coefficient will itself be normally distributed. At the same time, the sum of squared residuals is distributed proportionally toχ2with (n 2) degrees of freedom [Steel and Torrie, 1980]. This allows us to use the t statistics to construct a confidence interval for the inclination. Our rock magnetic and microcopy analyses and the negative fold tests show that the hematite-carried CRM is secondary and was acquired after folding. We can now estimate the ambient geocentric axial dipolefield inclination at the time of remagnetization by extrapolating the in situ correlation line in Figure 9a to a 100% hematite contribution. This yields an estimated inclination of 42.9° (with lower and upper confidence limits of 41.5° and 44.4°, respectively, 95% significance) [Asuero et al., 2006]. This suggests that the Nanmulin Basin was located at a paleolatitude of 24.9°N (23.9°N, 26.1°N) during the poorly constrained time of remagnetization. The inclination of the secondary CRM is very similar to the mean in situ inclination of the 38 individual ChRM directions from the red siltstones in E2n(Figure 4c and Table S4 in the supporting information). This similarity strongly suggests that these extrapolated values are geologically meaningful and approximate to the inclination of the CRM. It further adds confidence to the reliability of our linear regression method to distinguish between the inclination of a secondary CRM and that of the primary TRM.
Similarly, the intercepts when hematite has no contribution to the SIRM in the two regression lines can be used to recover the inclination of the TRM but now after tilt correction (Figure 9b). This value is 38.1° (35.7°, 40.5°; 95% confidence limit) and should be the inclination of the primary TRM recorded by the tuffs in unit E2n. This inclination corresponds to a primary latitude of 21.4°N (19.8°N, 23.1°N) at the time the sampled
lavas erupted and cooled. This value is statistically indistinguishable from the paleolatitude determined from the equivalent volcanic rocks of the upper Linzizong Group in the Linzhou Basin ~200 km to the east [Dupont-Nivet et al., 2010]. The declination of the ChRM plotted against the contribution of hematite to the SIRM reveals no systematic correlation. This suggests that the original declinations of the TRM and CRM probably were not very different, such that no significant vertical axis rotation occurred between the acquisition of the TRM and the CRM (Figures 9c, 9d, 9g, and 9h).
Although the similarities between the modeled directions and primary magnetizations in coeval lavas elsewhere on the Lhasa terrane (described below) may be fortuitous, we regard the consistency among the paleomagnetism, rock magnetism, petrography, and directional modeling to be encouraging. Our analysis using the approach described above suggests the linear correlation between decreases or increases in magnetic inclination (depending on the polarity of TRM in E1dvolcanic rocks, see more information in Text S5
in the supporting information), and an increase in the contribution of hematite to the SIRM should also be observed for volcanic rocks in the north dipping E1dunit. However, the data do not display the predicted
correlation (Figures 9e and 9f ). We offer a few explanations for this: the small number of the samples in the data set (only 27); the narrow bandwidth of hematite contribution to the SIRM (52%–98%, with only four samples below 80%; Table S8 in the supporting information); or that the CRM of E1dvolcanic rocks reflects
more complex multiple remagnetization and alteration processes (see TExt S5 in the supporting information for further discussions on the possible pathway of NRM acquisition in E1dvolcanic rocks). Each of these
factors can be tested with additional work on a larger sample collection.
8.3. Implications for Reconstructing the India-Asia Collision Zone
We now explore the implications of ourfindings for tectonic reconstructions of the India-Asia collision history. The isolated ChRM directions from the Linzizong volcanic rocks in the Nanmulin Basin are similar to those reported by Chen et al. [2010], but we show that the shallow inclinations and the low paleolatitudes calculated from these inclinations and presented by these authors result from a tilt correction of paleomagnetic directions that were largely obtained after tilting. Thus, the Paleogene latitude of the Lhasa terrane cannot be directly calculated from these data sets because the Linzizong Group in the Nanmulin Basin has been remagnetized. Our exploratory approach using linear modeling of magnetic inclination, however, may identify the paleolatitude at the time the primary and secondary magnetization were acquired. Our modeling suggests primary inclinations of 38.1° (35.7°, 40.5°), corresponding to a paleolatitude of 21.4°N (19.8°N, 23.1°N). This inclination value is statistically indistinguishable from the mean inclination of 40.3°±4.5° (95% confidence limit) measured in the coeval volcanic rocks of the upper Linzizong Group in the Linzhou Basin ~200 km to the east [Dupont-Nivet et al., 2010], as well as from the shallowing-corrected inclinations (40.0° (33.1°, 49.5°) and 41.3°±3.3° based on two independent correction methods) in the sedimentary rocks of E2pin that same basin [Huang et al., 2013]. With a total of ~600–700 km of Cenozoic intra-Asian