HAL Id: hal-01856039
https://hal.archives-ouvertes.fr/hal-01856039
Submitted on 11 Oct 2018
HAL is a multi-disciplinary open access archive for the deposit and dissemination of sci-entific research documents, whether they are pub-lished or not. The documents may come from teaching and research institutions in France or abroad, or from public or private research centers.
L’archive ouverte pluridisciplinaire HAL, est destinée au dépôt et à la diffusion de documents scientifiques de niveau recherche, publiés ou non, émanant des établissements d’enseignement et de recherche français ou étrangers, des laboratoires publics ou privés.
Using Water Stable Isotopes in the Unsaturated Zone to
Quantify Recharge in Two Contrasted Infiltration
Regimes
Florent Barbecot, Sophie Guillon, Éric Pili, Marie Larocque, Elisabeth
Gibert-Brunet, Jean-François Hélie, Aurélie Noret, Caroline Plain, Vincent
Schneider, Alexandra Mattei, et al.
To cite this version:
Florent Barbecot, Sophie Guillon, Éric Pili, Marie Larocque, Elisabeth Gibert-Brunet, et al.. Using Water Stable Isotopes in the Unsaturated Zone to Quantify Recharge in Two Contrasted Infiltration Regimes. Vadose Zone Journal, Soil science society of America - Geological society of America., 2018, 17 (1), pp.1-13. �10.2136/vzj2017.09.0170�. �hal-01856039�
Using Water Stable Isotopes in the
Unsaturated Zone to Quantify Recharge
in Two Contrasted Infiltration Regimes
Florent Barbecot,* Sophie Guillon, Eric Pili, Marie Larocque,
Elisabeth Gibert-Brunet, Jean-François Hélie, Aurélie Noret,
Caroline Plain, Vincent Schneider, Alexandra Mattei, and
Guillaume Meyzonnat
A reliable estimate of recharge is needed for the sustainable management of groundwater resources. Water stable isotope (d18O and d2H) profiles in the unsaturated zone are frequently used to quantify groundwater recharge based on the seasonality of water isotopic compositions in precipitation. A very simple approach consists of integrating the soil water content between peak values of soil water isotopic composition, typically corresponding to precipitation signa-tures from warm and cold seasons. When precipitation isotopic compositions are available, a conceptual surface water isotopes budget and lumped parameter dis-persion model can be computed. These models were applied on two field sites with similar permeable soils with grass cover but contrasting recharge regimes and seasonality, one in the Paris Basin (France) with continuous recharge from autumn to spring and the other in the St. Lawrence Lowlands (Quebec, Canada) with episodic recharge in fall and after snowmelt. For the two sites, the peak-to-peak method and isotope surface budget led to comparable recharge intensities. At least at the Paris Basin site, evaporation was shown to slightly modify the average unsaturated zone and hence groundwater isotope composition. The proposed parameterization of isotope fractionation due to evaporation allows qualitative estimation of the fraction of evaporation, at least during the recharge seasons. In spite of its simplifications and limitations, the proposed parsimonious model can give estimates of recharge in a variety of sites even if they are not well characterized, as it benefits from the large availability of monthly isotopic com-positions in precipitation.
Abbreviations: d-excess, deuterium excess; GNIP, Global Network of Isotopes in Precipitation; LMWL, Lo-cal Meteoric Water Line; lc-excess, line-conditioned excess; PB, Paris Basin; PET, potential evapotranspira-tion; SLL, St. Lawrence Lowlands.
The UNESCO World Water Assessment Program
identified a gap in knowl-edge of the impact of climate change on groundwater resources. While numerous recent studies have attempted to bridge this gap, they have also demonstrated that we currently do not have the ability to quantitatively predict the impact of climate change on ground-water resources with a satisfying degree of confidence (Crosbie et al., 2013; Kurylyk and MacQuarrie, 2013). Recharge is a key parameter in groundwater management, and thus a reliable estimate of recharge is necessary for sustainable groundwater resource develop-ment (Rivard et al., 2014). To achieve accurate water budgets, recharge quantification has been investigated at local scales using lysimeters (Pfletschinger et al., 2012; Xu and Chen, 2005), water-table fluctuations (Hagedorn et al., 2011; Healy and Cook, 2002; Liang and Zhang, 2012), and baseflow analysis (McCallum et al., 2014). Independent of the method, the impact of all possible environmental stresses, meteorological variability, and changes in climate, land use, and water extraction on the recharge regime cannot be completely taken into account (Kurylyk and MacQuarrie, 2013).Variability in the stable isotope signature of soil pore water collected at depths with suction lysimeters has been used to investigate subsurface processes (Darling and Bath,
Core Ideas
• Soil water stable isotope profiles can be used to quantify groundwater recharge.
• Climate conditions are recorded in water stable isotope profiles of the unsaturated zone.
• Soil water isotope profiles provide insight into the seasonality of recharge events.
F. Barbecot, S. Guillon, M. Larocque, J.-F. Hélie, A. Mattei, and G. Meyzonnat, GEOTOP, Dép. des sciences de la Terre et de l’atmos-phère, Univ. du Québec à Montréal, CP8888 succ. Centre-Ville, Montréal, QC, H3C 3P8, Canada; S. Guillon and A. Mattei, Mines Paris-Tech, PSL Univ., Centre for geosciences and geoengineering, 35 rue Saint-Honoré, 77300 Fontainebleau, France; E. Pili, CEA, DAM, DIF, F-91297 Arpajon, France; E. Gibert-Brunet and A. Noret, UMR8148_GEOPS CNRS/UPS, Univ. Paris-Sud/Paris-Saclay, Bâtiment 504, 91405 Orsay Cedex, France; C. Plain, UMR EEF-UL1137, INRA/Univ. de Lorraine, Bld des Aiguillettes, BP 239, 54506 Vandœuvre-lès-Nancy, France; V. Schneider, ANDRA–Centre de stockage de l’Aube, DOI/CA/QED, 10200 Soulaines-Dhuys, BP7, France. *Correspon-ding author (barbecot.florent@uqam.ca). Received 13 Sept. 2017.
Accepted 13 Mar. 2018.
Citation: Barbecot, F., S. Guillon, E. Pili, M. Larocque, E. Gibert-Brunet, J.-F. Hélie, A. Noret, C. Plain, V. Schneider, A. Mattei, and G. Meyzonnat. 2018. Using water stable isotopes in the unsaturated zone to quantify recharge in two contrasted infiltration regimes. Vadose Zone J. 17:170170. doi:10.2136/vzj2017.09.0170
Special Section: Stable Isotope Approaches in Vadose Zone Research
© Soil Science Society of America.
This is an open access article distributed under the CC BY-NC-ND license
(http://creativecommons.org/licenses/by-nc-nd/4.0/).
1988; Stumpp et al., 2009a, 2009b; Thomas et al., 2013). As an alternative method, water stable isotopes in the unsaturated zone offer a time-integrated fingerprint of recharge and of subsurface water pathways (Darling and Bath, 1988; Bengtsson et al., 1987; Koeniger et al., 2016). Unsaturated zone stable isotope profiles under temperate climate conditions have thus been used to study groundwater recharge mechanisms (Lee et al., 2007; Li et al., 2007; McConville et al., 2001; Mueller et al., 2014; Saxena, 1984; Song et al., 2009; Stumpp and Hendry, 2012; Stumpp et al., 2009a, 2009b). Suction lysimeters are quite time consuming to use, with a sampling effort of at least 1 yr, while cryogenic extraction of soil water allows the collection of comparable stable isotope data within one or a few field work days. New, faster methods, such as direct equilibration, are also becoming widely used and raise issues regarding the possible biases between the various methods of soil water isotope analysis used (Orlowski et al., 2016).
The isotopic composition of precipitation is strongly corre-lated with air temperature. A distinct seasonal pattern therefore occurs in precipitation under temperate climates, with summer rainfall enriched in heavy isotopes and winter rainfall depleted (Rozanski et al., 1993). In addition to d18O and d2H, line-condi-tioned excess (lc-excess) values (Landwehr and Coplen, 2004) are very sensitive to local evaporation and associated isotope fraction-ation occurring at the surface. These are therefore used in addition to d18O and d2H to evaluate recharge processes and apparent mean residence times of soil water (Lee et al., 2007).
Even if transpiration predominates under temperate climates and is considered to not fractionate water stable isotopes, evaporation from plant interception or from the upper soil leads to fractionation and enrichment in heavy isotopes (Braud et al., 2005, 2009b; Sprenger et al., 2016; Sutanto et al., 2012). Water recharging during a given season can therefore be identified in deep unsaturated zone profiles, and recharge rates can be obtained from the displacement between successive seasonal inputs (Gehrels et al., 1998; Małoszewski et al., 2006; Małoszewski and Zuber, 1993; McConville et al., 2001; Saxena, 1984). On the one hand, this simple peak-shift method is easily applied (Adomako et al., 2010), even if the isotopic compositions of precipitation are not available (Gehrels et al., 1998). On the other hand, numerical models, such as SiSPAT-Isotopes (Braud et al., 2005, 2009a), Soil-Litter-Iso (Haverd and Cuntz, 2010), or a modified version of HYDRUS-1D (Stumpp et al., 2009a, 2009b; Stumpp and Hendry, 2012), are increasingly being used to understand the dynamics of water stable isotopic composition in the unsaturated zone (Sprenger et al., 2015). Such level of model refinement is associated with a high data requirement that can only be achieved for specific study sites, but less for more numerous and less known sites at the regional scale where there is a lack of recharge rate estimations.
The aim of this study was to apply a simple and parsimonious method to quantify the rate and seasonal pattern of recharge, based on water stable isotope depth profiles, applicable to sites under contrasted climate conditions and requiring a limited amount of additional data. The two study sites are in the Paris Basin (France)
and in the St. Lawrence Lowlands (Quebec, Canada), for which water stable isotopic compositions of both precipitation and the unsaturated zone are available. Recharge was calculated based on a simple peak-shift approach. A model coupling a surface water and isotope budget to a lumped parameter model is proposed for a more robust quantification of recharge but also to explain the evolution of water isotopic composition in the unsaturated zone, and particularly to investigate the influence of evaporation.
6
Materials and Methods
Study Sites and Sampling
The Paris Basin SiteThe Paris Basin site (PB) is located 35 km south of Paris (France), in the very fine and well-sorted sands of the Oligocene Fontainebleau aquifer. This regional unconfined aquifer has a maximum thickness of 50 to 70 m. The total porosity of the aqui-fer is 25 to 40%, with volumetric water content in the unsaturated zone in the range of 7 to 28% (Schneider, 2005). The hydraulic conductivity reaches 1.10−5 to 6.10−5 m/s (Corcho Alvarado et al., 2007; Renard and Tognelli, 2016).
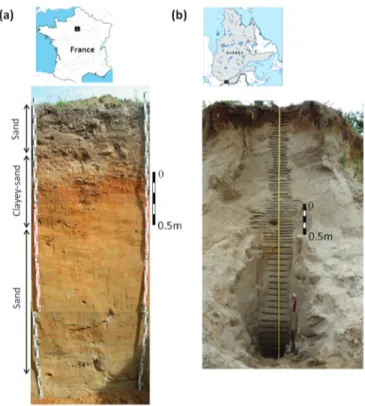
This study site is covered with grass, with a 60-cm-thick sandy soil layer overlying a clayey-sand layer from 60 to 100 cm and homogeneous sands below 100 cm (Fig. 1a). In May 2006, a 3-m-deep trench was dug in the unsaturated zone using an excava-tor. Soil sampling for pore water extraction and isotopic analysis was conducted immediately after opening the trench. Soil was sam-pled using a spatula, with a 2.5-cm spacing from the 0- to 137-cm depth and a 10-cm spacing from the 140- to 280-cm depth (Fig.
Fig. 1. Locations and photographs of the trenches where sand samples were taken for soil water extraction and water isotope analysis for (a) the Paris Basin and (b) the St. Lawrence Lowlands.
1a). Soil samples weighing on average 100 g were collected in poly-propylene bottles and were stored in these airtight bottles until stable isotope analysis. Gravimetric water content was measured on the grab samples and converted into volumetric water content assuming a bulk density of 1500 kg/m3.
The water table below the site lies, on average, 6 to 8 m below the surface. Several groundwater samples were collected from nearby wells for stable isotope analysis.
Meteorological data, precipitation and temperature, were obtained with a 15-d time step from the nearby Trappes station (Meteo France). The average annual precipitation is 668 mm/yr, while average monthly temperatures fluctuate between 0 and 25°C. An average recharge rate of 100 to 150 mm/yr was calcu-lated for the previous decades based on environmental tracers and at the regional scale around the study site (Corcho Alvarado et al., 2007) (Table 1) and confirmed by hydrological modeling in the Fontainebleau Sands (Renard and Tognelli, 2016).
Precipitation was collected 10 km away, at the GEOPS laboratory (Université Paris-Sud/Paris-Saclay, Orsay, France), from August 2002 to July 2012, using paraffin oil to prevent evaporation of water in the collector and isotopic fractionation. Cumulated bulk precipitation was sampled twice a month, and its isotopic composition was measured (Fig. 2–4). Deuterium excess (d-excess = d2H − 8 d18O) in precipitation was calculated to look for variable origins of air masses. The Local Meteoric Water Line (LMWL) was defined based on the isotopic composition of pre-cipitation. Its equation (d2H = a d18O + b) was used to calculate lc-excess values (lc-excess = d2H − a d18O − b) for the soil pore water profile.
The St. Lawrence Lowlands Site
The St. Lawrence Lowlands site (SLL) is located 70 km south-west of Montreal, in the Vaudreuil-Soulanges area (Quebec, Canada), and in the medium sands of the Saint-Télésphore esker. These gla-ciofluvial sediments can reach up to 40-m thickness and lie above the regional bedrock aquifer (Larocque et al., 2015). The aquifer is locally unconfined, with a total porosity of 40% and a hydraulic con-ductivity on the order of 10−5 to 10−4 m/s. The study site is located in a flat area close to a sand quarry. The area is covered mainly by woodland, except on the site outcrops where the soil is covered with grass and where the unsaturated zone was sampled.
Taking advantage of an outcrop recently exposed on the border of the sandpit excavation, the entire unsaturated zone was sampled in May 2013 for the measurement of water content and pore water isotopic composition. The vertical outcrop was refreshed immediately before sampling by removing the 5 to 10 cm of sand exposed to the atmosphere. Sand samples were taken using a spatula, with a 5-cm spacing below the soil surface down to a depth of 2.5 m and then a 10-cm spacing down to the water table at the 4.5-m depth (Fig. 1b). Soil samples weighed on average 100 g and were stored in airtight polypropylene bottles until stable iso-tope analysis. The sand was homogeneous throughout the whole depth profile. Gravimetric water content was measured on the grab samples and converted into volumetric water content assuming a bulk density of 1500 kg/m3. Daily weather data (minimum and maximum temperature and precipitation) were obtained from the Coteau du Lac station (http://www.mddelcc.gouv.qc.ca/climat/ donnees/index.asp), 20 km from the study site. Average annual precipitation in this area for the period 1980 to 2010 is 960 mm/yr (Larocque et al., 2015), with average monthly temperatures rang-ing from −11 to 23°C. An average recharge rate of 189 mm/yr was calculated for the period 1990 to 2010 using a regional surface water budget (Larocque et al., 2015) (Table 1).
Monthly isotopic composition values and precipitation amounts were obtained from the closest station of the Global Network of Isotopes in Precipitation (GNIP, http://www-naweb.iaea.org/napc/ ih/IHS_resources_gnip.html), namely Ottawa, from January 2010 to June 2012 (Fig. 4). Even though Ottawa is relatively far (130 km) from the study site, the climate is similar at Ottawa and the SLL site, with similar average temperatures and precipitation as well as altitude, and Ottawa precipitation isotope compositions can thus be used for the SLL site model. Discrete snowpack and rain samples were collected at SLL for measurement of isotope composition in 2012 and 2013. As was done for PB, the LMWL was determined and used to calculate the lc-excess for the soil pore water profile.
Table 1. Estimate of the amount of annual groundwater recharge at the Paris Basin (PB) and St. Lawrence Lowlands (SLL) using several methods.
Method
Groundwater recharge
PB SLL
———————— mm/yr ———————— Unsaturated zone isotope profile 304 114
Hydro-isotopic water budget 203 200–370 Regional modeling 150† 189‡ † Corcho Alvarado et al. (2007).
‡ Larocque et al. (2015).
Fig. 2. Monthly average O isotopic composition of precipitation at the Paris Basin (PB, black) and the St. Lawrence Lowlands (SLL, gray). For each site, dashed lines represent the volume-weighted average O isotopic composition of the unsaturated zone profiles sampled in May 2006 for PB and May 2013 for SLL. Periods of recharge obtained from the water budget are represented by horizontal bars.
Water Extraction and Isotopic Analysis
Stable isotopic analysis of the soil pore water was conducted on water extracted from the collected soil samples using cryogenic vacuum extraction. Because soils sampled for this study were mainly of sand type and relatively wet, water isotope composition from cryo-genic extraction can be assumed to have limited bias. A small soil sample of around 100 g for PB (40 g for SLL) was introduced into a vacuum line. Pore water was extracted for 6 h for PB samples and 2 h for SLL samples and condensed in a collection tube maintained in liquid N2 (Araguás-Araguás et al., 1995). The soil sample was heated to around 60°C during the extraction, under a vacuum of around 1 Pa. After extraction, the soil sample was weighed, heated overnight at 100°C, and then reweighed to determine the water extraction yield as well as the initial soil water content.
The isotopic signature of water condensed in the collection tube was shown to follow a Rayleigh distillation curve (data not shown), and >98% of pore water must be extracted to ensure the absence of isotopic fractionation in the pore water sample. For this study, extraction yields were monitored to be >98% for all samples. Oxygen and H isotopic compositions of the extracted soil pore water as well as of the groundwater and precipitation were measured with a Thermo Finnigan Delta+ isotope ratio mass spectrometer in dual inlet mode, coupled to an equilibration bench, at the GEOPS laboratory (Université Paris Sud, France) for PB and on a Micromass Isoprime isotope ratio mass spec-trometer in dual inlet mode, coupled to an Aquaprep system, at GEOTOP-UQAM (Montreal, Canada) for SLL. Each analysis required 200 mL of water, equilibrated at 40°C for 7 h with CO2
Fig. 3. Time series of water and isotope surface budgets for the Paris Basin site from 2002 to 2006: isotopic composition measured in precipi-tation (black and gray solid lines with monthly average as dashed lines), isotopic composition calculated in infiltrating water (red and orange), deuterium-excess in precipitation (dashed gray line), measured precipitation (blue), calculated potential evapotranspiration (green), and infiltra-tion into the unsaturated zone (red).
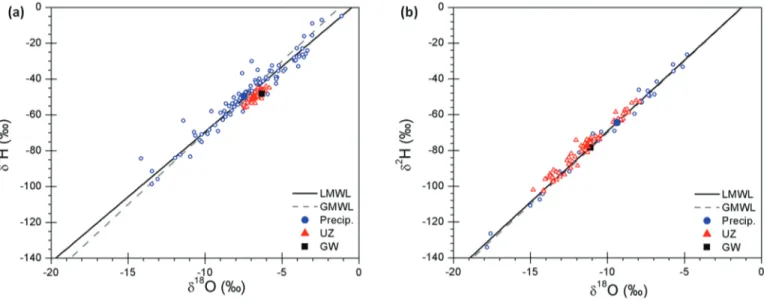
Fig. 4. Stable isotopic composition of water in precipitation (blue circles), in the unsaturated zone (UZ) pore water (red triangles), and in groundwater (GW, black squares) for (a) the Paris Basin and (b) the St. Lawrence Lowlands. For each site, filled symbols correspond to volume-weighted averages of individual empty data points. For each site, the Local Meteoric Water Line (LMWL) and Global Meteoric Water Line (GMWL) are represented by a black solid line and gray dashed line, respectively.
for d18O, and equilibrated at 40°C for 4 h with H
2 with a Pt catalyst for d2H.
Raw data were corrected using three internal working water standards, expressed in delta notation and normalized to the Vienna Standard Mean Ocean Water (VSMOW)–Standard Light Antarctic Precipitation scale:
sample 18 VSMOW O 1R R d = - [1] where 18 16
O
O
i iR
=
and i corresponds to the sample or VSMOW. Hydrogen
isotopic composition is expressed similarly to d2H, with
Ri = ([2H]/[1H])
i. The d18O and d2H values are reported in per
mil (‰) vs. the VSMOW international standard. The precision of liquid water analysis (1s) was 0.05‰ for d18O and 1‰ for dD. To check that the uncertainty due to cryogenic extraction was small, dried soil samples were rewetted with standard water. The mea-sured isotopic composition for the extracted water was equal to that of the standard water in the range of the analytical precision of the liquid water analysis.
Recharge Estimation from Water Isotope Profi les
in the Unsaturated Zone
The seasonal variation in the isotopic composition of precipita-tion (Fig. 2), combined with a seasonal pattern of evapotranspiraprecipita-tion, were directly linked to atmospheric temperatures. This led to a sea-sonal pattern of the amount and isotopic composition of infiltration and recharge. Even if the input function (i.e., rain isotopic
composi-tion) was unknown, a simple interpretation of water stable isotope depth profiles would allow the amount and periods of recharge to
be quantified. The successive recharge seasons (summer–autumn vs. winter–spring) were identified in water isotope profiles in the unsaturated zone due to their contrasting water isotopic composi-tions (enriched vs. depleted in heavy isotopes) (Fig. 2, 5, and 6). The amount of recharge I (in m/yr) that occurred during a certain time
period T (in yr) was obtained by integrating the volumetric water
content qw(z) over the depth interval [Z1, Z2] (in m), corresponding to the time period T (equation after Leibundgut et al., 2009):
( ) 2 1 w d Z Z z z I T q =
ò
[2]For this method, the time period could be only roughly estimated, typically to one hydrological season or 1 yr, from the evolution of water isotope composition with depth.
Lumped Parameter Models for Water Isotopic
Composition in the Unsaturated Zone
To explain the observed evolution of water isotopic composi-tion in the unsaturated zone, a surface water and isotopic mass balance was used, combined with a lumped parameter model for isotope transport in the unsaturated zone. The successive steps of the model, from a time series of precipitation and its stable isotopic composition to the depth profile of water isotopes in the unsatu-rated zone, are described below.
Water Budget at the Subsurface
As a reference point from which to discuss the water budget at the surface, the traditional Thornthwaite method (Thornthwaite, 1948) was used to calculate the potential recharge fluxes. This con-ceptual box model applies to the soil layer from the surface to the root depth:
( ) ET( ) ( ) ( ) 1( ) ( )
P i = i +R i +I i +éëS i -S i- ùû [3]
Fig. 5. Depth profiles of pore water O isotopic composition (black) and volumetric water con-tent (gray) at (a) the Paris Basin and (b) the St. Lawrence Lowlands. Vertical dashed lines cor-respond to volume-weighted average isotopic composition in groundwater (black) and pre-cipitation (blue). Annual or seasonal recharge is calculated through depth integration of water content in shaded areas. For the Paris Basin, the modeled depth profile of isotopic composition (dashed line) was calculated from the hydro-isotopic surface budget and the one-dimensional lumped parameter model.
where i is the time step, P is precipitation (rain), ET is actual
evapotranspiration, R is surface and subsurface runoff, I is
perco-lation below the root depth, i.e., recharge, and S is soil storage, all
expressed in millimeters.
This water budget was calculated at the smallest time step available for stable isotopes in precipitation (15 d for PB, 1 mo [i.e., 28–31 d] for SLL). Potential evapotranspiration (PET) was calculated following Turc (1961). Even if it was shown to tend to underestimate evapotranspiration (Fisher and Pringle, 2013), this method was originally developed for a monthly time step, close to the one used here, and could be applied solely with temperature data, hence well adapted for poorly instrumented sites. For both PB and SLL sites, surface and subsurface runoff was assumed to be negligible due to the flat topography and very permeable sandy soils. The conceptual soil storage reservoir, with a maximum capac-ity Smax, corresponded to the upper soil down to the maximum rooting depth (0.1–0.2 m at both sites), where evaporation and transpiration occurred, and below which there was no more water abstraction. Water “overflowing” and leaving this soil reservoir per-colated vertically in the unsaturated zone and finally recharged the underlying aquifer. At each time step i, precipitation P(i) and soil
water S(i − 1) were considered as available water for evaporation
and transpiration. Actual evapotranspiration was calculated based on the demand on PET and this amount of water available in the precipitation and soil reservoir: ET(i) = min[PET(i), S(i − 1) + P(i)].
If some water remained available after subtraction of the actual evapotranspiration, it was added to the soil storage. Recharge was then calculated as overflow, water exceeding the threshold capac-ity Smax of the soil storage reservoir. This could be summarized as
I(i) = max{S(i − 1) + P(i) − min[PET(i), S(i − 1) + P(i)], 0} and S(i) = max{S(i −1) + P(i) − min[PET(i), S(i − 1) + P(i)], Smax}.
Such a simple conceptual box model was assumed valid because the calculation time step was long, typically 15 to 30 d, and because the objective was to build a data parsimonious model.
For SLL, recharge was expected to occur in autumn and with snowmelt in the spring, the soil usually being frozen from mid-December to March. Hence, the water budget was modified, with evapotranspiration and recharge set to zero when the average monthly temperature remained below zero. The potential excess water then accumulated in the soil reservoir until positive tem-peratures occurred.
Hydro-isotopic Surface Budget
Following the traditional surface water budget (Eq. [3]), a simple mass balance approach was applied to determine the iso-topic composition of the percolating water. At each time step, the water isotopic composition of the soil storage reservoir was calcu-lated by weighting the isotopic composition of water in the soil reservoir at the previous time step and the isotopic composition of the precipitation at the current time step:
( ) ( ) ( ) ( ) ( ) ( ) ( ) mix i S i 1 S i11 P i P i S i P i d - - +d d = - + [4]
where d is the isotopic composition of d18O or d2H, d
S and dP
are the isotopic compositions of soil storage and of precipitation, respectively, and S(i) and P(i) are the amounts of water in the soil
storage and in precipitation, respectively, at the ith time step.
Partitioning between evaporation and transpiration was not included in the model, neither based on field properties nor directly based on water stable isotopes as done by Sutanto et al. (2012). However, for grassland under northern latitudes as for the two sites, transpiration was shown to dominate with >60 to 65% of total actual evapotranspiration (Wei et al., 2017). As discussed below, the isotopic composition of water in the unsaturated zone was used as a simple proxy to identify whether some evaporation occurred during the recharge period(s), without going further into quantification. At PB, isotopic compositions clearly followed an evaporative trend, with negative lc-excess (Fig. 6a), while it was not the case at SLL with null or slightly positive lc-excess (Fig. 6b). In the model, isotopic fractionation was therefore assumed to occur due to evaporation of water in the soil reservoir. Soils of the two study sites were wet (Fig. 5, water content >10% v/v), consistent with a medium intensity of evapotranspiration fluxes, and the equations of isotopic fractionation for open water (Gonfiantini, 1986) were used, including equilibrium fractionation as well as
kinetic enrichment. At each time step, the isotopic composition of water in the soil storage was calculated by
( ) ( )
(
)
(
)
( )(
)
(
)
r , r r mix r r , , , , B T H S i i A T HB T H f A T HB T H é ù ê ú d = dê - ú + ê ú ë û [5]where f is the fraction of water remaining after evaporation, and A(T,Hr) and B(T,Hr) are parameters defined by Gonfiantini (1986), which depend on both atmospheric temperature, T,
Fig. 6. Depth profiles of line-conditioned excess (lc-excess) in pore water at (a) the Paris Basin and (b) the St. Lawrence Lowlands. For the Paris Basin, the modeled depth profile of lc-excess (dashed line) was calculated from the hydro-isotopic surface budget and the one-dimensional lumped parameter model.
and atmospheric relative humidity, Hr. Following Barnes and Allison (1983), in A and B terms, the kinetic enrichment is equal
to (1 − Hr), the relative difference of transport resistance in air between isotopes being neglected.
The outputs of the water budget (Eq. [3]) were used to cal-culate dinf(i), the isotopic composition of water percolating from
soil storage into the unsaturated zone. The value of dinf(i) was
determined for the time steps during which recharge occurred (Fig. 3) and was equal to dS(i), the isotopic composition of water in soil
storage at this same time step.
The model was applied to PB from January 2002 to May 2006. For SLL, the hydro-isotopic surface budget was calculated from January 2010 to May 2013, with a monthly time step.
Transport in the Unsaturated Zone: Piston Flow with Dispersion
The second step of the model was the transport of water stable isotopes through the unsaturated zone. Considering the limited amount of data available with which to constrain the model, a conceptual input–output lumped parameter model based on tran-sit time distribution was chosen in this study to identify the main processes. According to the literature (Barnes and Allison, 1988; Lindström and Rodhe, 1992) and in agreement with the observed variability in d18O and d2H with depth (Fig. 5), transport of water stable isotopes in the unsaturated zone occurred by convection or piston flow, as well as dispersion, leading to attenuation at depth. The convolution integral method of Małoszewski and Zuber (1993) was chosen to reproduce and interpret soil depth profile data.
First, the amount of recharge, I(i) (Eq. [3]), and the isotopic
composition of the percolating water, dinf(i), obtained from the
water and isotope budgets as a function of time (Fig. 3), were com-bined and transformed into dinf(q), a series of isotopic compositions
for each increment of recharge water q (in mm). Water content was
not constant with depth (Fig. 5), but the spatial and temporal varia-tions of soil water content were not included in the model because it was intended only as a simple model for validation of the surface budget and main recharge processes and not as an investigation of transient processes. The assumption of homogeneous and constant water content by volume, qw, was made, corresponding to steady-state vertical flow of water. This assumption was required to apply the transit time distribution model. A simple mass balance, or piston flow model, was applied to propagate the series dinf(q) into a series
d¢inf(z) of isotopic composition as a function of depth in the
unsatu-rated zone. This was done using the simple conversion
max w
Q q
z=
-q [6]
where z is the depth (in mm) reached by the parcel of water after
a cumulated amount of recharge of q (in mm), and Qmax is the cumulated recharge amount (in mm) calculated for the entire time series (2002–2006 at PB).
Second, the relationship between input and output soil water isotopic compositions was based on a transit time distribution
function. The dispersion model (Małoszewski et al., 2006) was chosen as the most appropriate for solute transport in soil columns. This dispersion model was retained also for its parsimony, with a dispersion parameter as the single parameter. However, the limita-tions of this model have to be kept in mind, especially through the steady-state assumption. The model proposed here aimed at giving a general estimate of water fluxes, not at explaining the transient dynamics of soil water isotopes.
Traditionally, the dispersion model was used to determine the temporal evolution of the isotopic composition of unsaturated zone water collected at a fixed depth with a lysimeter, based on the temporal evolution of the isotopic composition in precipitation. For the current application, the isotopic composition of unsatu-rated zone water for all depths had to be calculated at a fixed time, namely the time of sampling. The lumped parameter dispersion model was therefore modified as follows. For each depth Z, the
isotopic composition after dispersion d¢out(Z) was obtained by a
convolution between the transit time distribution function with the theoretical non-attenuated depth profile d¢inf(z):
( ) max ( ) ( ) out 0 inf , d Z z Z = z g Z z z ¢ ¢ d =
ò
d [7]where Zmax = Qmax/qw (in m) is the maximum depth reached by water that recharged at the real beginning of the time series, and
g is the transit time distribution function of the dispersion model:
( ) 3/2exp ( )2 4 4 Z z Zz g z DzZ D - é - ù ê ú = ê- ú p êë úû [8]
where D is the dispersion parameter (dimensionless), which
cor-responds to the inverse of the Peclet number (Małoszewski and Zuber, 1993) and hence can theoretically be linked to dispersivity. The depth profile of the water content was not modeled, as it was not the main focus of the study and not adapted to the lumped parameter model.
The transport model was applied only at PB. For SLL, the surface budget was less well constrained, due to the lack of time series on snowpack and snowmelt, and the transport segment was not pursued.
Sensitivity Analysis and Calibration of the Model Parameters
Four years of data were available prior to sampling at PB. The model was thus run from July 2002 to May 2006. Isotopic com-positions were observed to be constant below 2 m at PB (Fig. 5a). With such dispersion, the available 4-yr period of data was long
enough so that the first and oldest recharged water isotopic com-positions were attenuated at the 2-m depth. Especially, any data older than 2002 would have been attenuated. To ensure initializa-tion of the model but keep its simplicity, the recharge time series, d¢inf(z), was artificially extended into the past (corresponding to
the deepest part of the unsaturated zone) using the measured aver-age isotopic composition of the deep unsaturated zone. For cases
where shorter time series of meteorological data were available or if dispersion was lower, monthly average data of precipitation amounts and isotope compositions should be used for a spin-up period.
A simple sensitivity analysis was conducted to determine the influence of the hydro-isotopic budget parameters on the average isotopic composition and intensity of recharge (Table 2). The value of atmospheric relative humidity Hr did not influence much the isotopic composition of the recharged water but con-trolled the slope of the unsaturated zone data points relative to the meteoric water line in d18O–d2H space. The value of f strongly influenced the isotopic composition of the recharged water (Table 2), and the value of Smax also influenced it, albeit to a lesser extent. The values of these three latter parameters were determined by a simple inverse approach. The objective function j that was minimized was defined as the difference between the calculated volume-weighted average d18O of recharge water and the measured volume-weighted average d18O in the unsaturated zone:
( ) ( ) ( ) inf 18 UZ O i i I i i I i é d ù ë û j =
å
-då
[9]The calibration of the two parameters of the transport model, namely the dispersion coefficient, D, and soil water content, qw, was then performed. The transport parameter values depended on those of the parameters obtained from the surface budget. Soil water content qw was not very sensitive and was estimated by manual adjustment. For the dispersion coefficient, a coupled multiparameter calibration as in Sprenger et al. (2015) was not conducted, but rather a simple parameter adjustment based on the minimization of the objective function j¢, defined as the sum of the differences between the measured and calculated d18O in the unsaturated zone at each depth where measurement was available:
( ) ( ) max 0 18 out OUZ Z Z Z Z é ¢ ù j =¢
å
êëd -d úû [10]The transport model applied only to water percolating below the active rooting depth. The upper 10 to 20 cm of the soil, which corresponded to the conceptual soil reservoir or at least where tran-sient surface water fluxes occurred, were thus not handled by the transport model and not considered for the fit and interpretation.
6
Results
Water Budget
For PB, the average annual precipitation and potential evapo-transpiration were 668 and 746 mm/yr, respectively. The surface water budget was calculated for a fitted Smax value of 52 mm, giving the best agreement for isotopic composition (see below). The actual evapotranspiration was 455 mm/yr, for an average recharge of 203 mm/yr (Table 1). Recharge was obtained almost continu-ously from September and October until April and May (Fig. 2 and 3). In that case, the value of Smax could be compared with the soil
moisture capacity, according to Smax = RD(qFC − qWP) (Renard and Tognelli, 2016), where RD is the rooting depth (0.2 m for the PB site), and qFC and qWP are the water contents of the soil at field capacity and the wilting point, respectively (around 5 and 2% v/v, respectively). Physical soil properties gave an Smax value of 6 mm, which was lower but compatible with the fitted value. The obtained intensities for the various components of the water budget were in agreement with those used by Renard and Tognelli (2016) for another site nearby in the Paris Basin.
For SLL, the average annual precipitation (rain and snow) and potential evapotranspiration for the 2010 to 2013 period were 922 and 630 mm/yr, respectively. The Smax value leading to the best agreement between the modeled and measured volume-weighted average isotopic composition was 300 mm, a large value that could not be linked to a physical interpretation of soil moisture content. It has to be emphasized here that Smax was a fitting parameter of the conceptual water budget, and that the link with field observa-tions was not straightforward, especially as Smax depended on the model time step. The large value of Smax was thus consistent with the long time step (1 mo) of the model at SLL. The corresponding recharge was 200 mm/yr, in the same order of magnitude as the lit-erature value (Table 1), but occurred only for snowmelt. The actual evapotranspiration was 608 mm/yr, almost equal to the potential evapotranspiration. At the regional scale, Larocque et al. (2015) obtained a lower value of 381 mm/yr, but this has to be consid-ered carefully because they considconsid-ered runoff. The water budget thus appeared to be somehow too simple to fully handle processes occurring in a cold climate and thus to be affected by large uncer-tainty. Larocque et al. (2015) used a more complex surface water budget better adapted to a cold climate and showed that recharge Table 2. Sensitivity analysis of the hydro-isotopic surface budget to the parameters relative humidity (Hr), maximum storage capacity (Smax), and the fraction of water remaining after evaporation (f), and to
poten-tial evapotranspiration (PET) for the Paris Basin (PB) site.
Parameter Avg. recharge d
18O-weighted avg. d 2H-weighted avg. lc-excess† mm ————————————‰ ———— ———————— Reference case‡ 203 −6.86 −50.00 −3.35 Hr = 0.1 203 −6.95 −50.84 −3.55 Hr = 0.5 203 −6.72 −48.56 −2.90 Smax ´ 2 147 −6.02 −46.31 −5.64 Smax/2 231 −7.41 −52.52 −1.95 f = 0.99 203 −8.13 −55.60 0.10 f = 0.90 203 −2.52 −30.40 −14.65 PET +10% 192 −6.88 −50.16 −3.36 PET −10% 217 −6.82 −49.75 −3.38 Unsaturated zone profile (PB site) −6.86 −50.39 −3.74 † Line-conditioned excess.
occurred during two separate periods for SLL, from October to December and then from March to May. An Smax value of 50 mm was also tested, similar to that for the PB site. This led to an actual evapotranspiration of 517 mm/yr and recharge of 372 mm/yr, with an acceptable fit of isotopic composition but this time with the two expected periods of recharge.
Stable Isotopic Composition of Precipitation
Monthly averaged, amount-weighted isotopic compositions of precipitation for the two sites are presented in Fig. 2. The entire time series of isotopic compositions and d-excess in precipitation from 2002 to 2006 for the PB site is presented in Fig. 3. A marked seasonal fluctuation existed for both sites due to temperature effects, with correlation coefficients (R2) of 0.36 and 0.60 between d18O in precipitation and temperature for the PB and SLL sites, respectively. Isotopic compositions of both O and H were more depleted in heavy isotopes during winter and more enriched in heavy isotopes during summer. The amplitude of this seasonal fluctuation was greater for SLL (97‰ for d2H and 12‰ for d18O) than PB (29‰ for d2H and 5‰ for d18O) due to the larger under-lying temperature amplitude. For SLL, the isotopic compositions of the local rain samples were fully consistent with the values from the GNIP station in Ottawa. The average isotopic composition of the snow samples was −17.3 ± 0.1‰ for d18O and −126.1 ± 1.0‰ for d2H, also in the range of the GNIP station data.
For both sites, the LMWLs were close to the Global Meteoric Water Line (Fig. 4a, d2H = 7.12 d18O + 2.19 for PB; Fig. 4b,
d2H = 7.93 d18O + 10.1 for SLL). They compared well with LMWL equations in the same regions [see, for example, Millot et al. (2010) for PB and Arnoux et al. (2017) for SLL]. For PB, the d-excess varied throughout the year according to the variable sources of vapor masses and the continental recycling of water vapor. The lc-excess was therefore used to overcome this variability and to investigate local evaporation effects.
Stable Isotopic Composition of Pore Water
in the Unsaturated Zone and Groundwater
Depth profiles of the water isotopic composition in the unsatu-rated zone are presented in Fig. 5a and 6a for PB and in Fig. 5b and 6b for SLL. Only d18O profiles are reported because d2H profiles show similar patterns of variability. At both sites, at least one cycle of pore water isotopic composition variation was observed: higher iso-topic compositions corresponding to recharge at the end of summer and during autumn, and lower values corresponding to recharge during winter. The amplitude of soil water isotopic composition variability was dampened compared with that of precipitation, with 12‰ for d2H and 2‰ for d18O for PB and with 51‰ for d2H and 7‰ for d18O for SLL. At PB, the 4.5‰ d18O amplitude in precipita-tion was attenuated to 1‰ at the 1-m depth and to <0.1‰, in the range of noise, at the 2-m depth. Depth profiles of soil water content also showed some variability (Fig. 5), with higher water content in the finer layer at PB and at the surface at both sites because sampling was conducted in May following winter infiltration.
The average isotopic composition of water in the unsatu-rated zone, weighted by the water content at each depth, was equal to d18O
uz = −6.9‰ and lc-excess = −3.7‰ for PB, and d18O
uz = −11.3‰ and lc-excess = 2.3‰ for SLL (Fig. 5 and 6). At PB, the average isotopic composition of the groundwater was d18O = −6.3‰ and d2H = −48.3‰ (Fig. 4a), while the mea-sured isotopic composition of the groundwater in the regional surface aquifer of SLL was d18O = −11.1‰ and d2H = −78.5‰ (Larocque et al., 2015) (Fig. 4b).
Even if the two sites had contrasting recharge seasonality and mechanisms, the average isotopic composition of the unsaturated zone was close to that of the local groundwater (Fig. 4). For SB, it was quite close to the weighted average isotopic composition of the local precipitation, reflecting the continuous infiltration and recharge of precipitation from fall to spring. On the contrary, for SLL the average isotopic composition in the unsaturated zone was more depleted in heavy isotopes than the weighted average isotopic composition of the local precipitation, corresponding to the large amount of heavy-isotope-depleted snowmelt water infiltration as freshet. Comparison between d18O values in precipitation and in the unsaturated zone indicated that recharge occurred predomi-nantly during late fall (d18O around −10‰) and spring (d18O of snow around −15‰) at SLL (Fig. 2 and 5b) and more continuously during fall, winter, and spring at PB (Fig. 2, 3, and 5a). At PB, lc-excess values in the unsaturated zone ranged between 0 and −5‰ (Fig. 6a), indicating that at least some evaporation occurs before or during infiltration, leading to a slight enrichment of the isoto-pic composition in recharge in the unsaturated zone. At SLL, the average lc-excess values in the unsaturated zone were positive (Fig. 6b), showing no evidence of evaporation and suggesting the exis-tence of heterogeneity in precipitation sources between recharge and non-recharge periods.
Quantification of Recharge for the Two
Contrasted Sites from Unsaturated Zone Profiles
Annual amounts of recharge were calculated following Eq. [2] for both the PB and SLL profiles and are reported in Table 1. The depths between which soil water content was integrated were chosen based on the visual observations of maximum and minimum as well as smooth or more abrupt changes in the isotopic composition vs. depth (Fig. 5) and on the expected seasonality of isotopic composition in recharge, from higher values in autumn to more negative values in spring. At PB, one cycle between two minima of d18O was identified between the 22- and 160-cm depths (Fig. 5a), corresponding to an annual recharge of 304 mm/yr (Table 1). More specifically, infiltration during autumn and winter 2005 could be identified by a relatively higher isotope composition between the 50- and 125-cm depths, while recent infiltration in spring 2006 would lie on top of the profile, down to the 50-cm depth (Fig. 5a). At SLL, relatively abrupt changes of d18O vs. depth allowed identification of spring snowmelt and autumn recharge for the two hydrological years preceding sampling (Fig. 5b). In the upper part of the profile, snowmelt recharge in 2013 was identified
with low d18O values between 22 and 72 cm and amounted to 48 mm, and a recharge in autumn 2012 of 66 mm was identified with high d18O values between 77 and 142 cm. This led to an annual recharge of 114 mm/yr (Table 1). Below that, low d18O were again observed from 147 to 212 cm, corresponding to spring snowmelt in 2012, with a calculated recharge of 68 mm. Below 217 cm, d18O values increased slightly and probably corresponded to recharge from autumn 2011, but the amplitude of variations was too dampened to allow quantification. Quantification of recharge based on the integration of water content vs. depth was based on a subjective identification of the depth range corresponding to a given period of recharge and thus subject to a large uncertainty. However, the results obtained in this study provide a straight-forward first-order estimate of the amount of recharge and also a confirmation of the expected seasonality of recharge.
Modeling the Isotopic Composition Evolution
from Precipitation to Infiltration and Recharge
For the PB site, Eq. [5] and isotope fractionation were at first not included in the model, but the minimization of the objective function j never led to a good fit of the data (data not shown). As already identified with the negative lc-excess value in the unsaturated zone, this confirmed that some evaporation occurred at PB. Isotope fractionation was therefore included in the model. Minimization of the objective function j then led to the determination of the surface water budget parameters (Smax
and evaporation parameters f and Hr). The best fit (Fig. 5a and 6a) was obtained for Smax = 52 mm, Hr = 0.3, and f = 0.97. The
obtained average annual recharge was then 203 mm/yr (Table 1), not fully similar to the values obtained from the depth integration method (above) and the literature but of the same order of mag-nitude and acceptable regarding the simplifications of the model and associated uncertainties. It has to be noted that the surface hydro-isotopic budget was self-sufficient to quantify the amount and seasonality of recharge. The transport model served as valida-tion and confirmavalida-tion of the major recharge processes.
Regarding the lumped parameter transport model for PB, the distance between the two d18O minima in the soil profile (Fig. 5a) was compared with the amount of recharge between the two dinf(r) series minima, and Eq. [6] was used to deduce an average
water content of qw = 0.42. This value was higher than the field value of 0.15 to 0.25 (Fig. 5a), but this parameter was not opti-mized automatically, was not very sensitive, and was thus affected by a large uncertainty. A dispersion parameter D of 0.06 gave the
best fit between the observed and calculated profiles (Fig. 5a and 6a). This dispersion parameter was an effective bulk parameter for the whole profile, disregarding the spatial variations of dispersivity with depth, and was not interpreted in terms of dispersivity.
For SLL, as already guessed by the positive lc-excess values in the unsaturated zone, a model without evaporation and without iso-tope fractionation allowed minimization of the objective function and was thus retained. There was thus only one parameter, Smax, to calibrate. The best agreement between the average d18O and d2H
calculated for recharge vs. measured values in the unsaturated zone profile was obtained for an Smax of 300 mm, leading to an annual recharge of 200 mm/yr (Table 1), again different from but on the order of magnitude of values obtained from the simple depth inte-gration method (above) and from the literature. However, as already discussed above, an Smax value of 50 mm, similar to that for the PB site and more physical, led to a higher recharge of 372 mm/yr and emphasized the current limitations of the model for a cold climate.
6
Discussion
Processes to Include in Models
of Soil Water Isotope Profiles
In this study, a conceptual water isotope budget was used at the surface, based on the traditional water budget, but also taking into account physical processes that alter the soil water isotopic composition, namely mixing and isotopic fractionation associated with evaporation. Regarding transport in the unsaturated zone, the choice of a lumped dispersion model to reproduce the measured d18O in the unsaturated zone was based on the limited availability of data with which to constrain the model. The simplified surface budget was consistent with a simplified transport model that did not incorporate the variations of water content with depth and with time. The influence of soil heterogeneity as well as of immobile water on the average isotopic composition of recharge water were consid-ered to be negligible by several researchers (Barnes and Allison, 1988; Lindström and Rodhe, 1992) but were shown to occur by others (Gazis and Feng, 2004; Schoen et al., 1999). The use of a lumped parameter model allowed these processes to be taken somehow into account through the effective dispersion parameter.
Other modeling approaches with more physically based numer-ical models of surface water, isotopes, and heat budgets have been proposed, coupled with water and isotope transport in the unsatu-rated zone based on Richards’ equation (Braud et al., 2005; Gehrels et al., 1998; Haverd and Cuntz, 2010; Melayah et al., 1996; Rothfuss et al., 2012; Sprenger et al., 2015; Stumpp and Hendry, 2012). Such physically based models handle the transient dynamics of flow and transport in the unsaturated zone as well as soil heterogeneity and help improve the calibration of soil transport parameters and the understanding of water residence time. However, they often lack detailed presentation of a surface isotope water budget. Non-fractionating transpiration is usually included in the models for sites in temperate areas (e.g., HYDRUS-1D; Stumpp and Hendry, 2012), but isotope-fractionating evaporation is less often taken into account (Haverd and Cuntz, 2010; Rothfuss et al., 2012, Sprenger et al., 2018). These modeling approaches can be more or less complex but always require many data and parameters. In opposition, the model proposed here is much more conceptual and simplified but includes this isotope fractionation in a simple way while requiring few data and parameters.
Parsimonious Models for Recharge
Quantification and Uncertainties
The two sites considered in this study have contrasting recharge mechanisms and seasonality, with episodic recharge in
autumn and from snowmelt at SLL and more continuous recharge from autumn to spring at PB. The two models proposed here been proven to allow quantification of the recharge amount and possibly seasonality for sites that are not so well characterized and where only limited data are available to interpret the isotope composition of the pore water in the unsaturated zone.
The two methods give estimates of recharge intensity that are of the same order of magnitude as values given in the literature and obtained with hydrogeological modeling (Table 1). However, even if a precise quantification was not the scope of the study and uncer-tainties on annual recharge estimated from depth integration of water content as well as from our simple model are large, noticeable differences remain with literature values. Such uncertainties could not easily be handled by water managers, and the proposed models are not intended for their use. More generally, uncertainties on recharge estimations remain significant, especially when compar-ing methods and even with complex models, which emphasizes the need to further improve recharge quantification methods.
Limitations of the Proposed Water Isotope Budget
and Transport Model for Recharge Quantification
The main limitation of the use of unsaturated zone water isotope profiles is the attenuation of the precipitation isotope signal at depth (Cook et al., 1992). As opposed to arid or semi-arid regions with deep unsaturated zones where several years of recharge intensity are stored, temperate areas generally have shal-lower unsaturated zones and higher recharge intensities that limit the preservation of the signals. The seasonal variability can clearly be observed at SLL but is smaller for PB (Fig. 5). The model shown here is intended to be theoretically applicable to any site under a temperate climate, even if sites characterized by strong seasonality, and especially by snow cover, are better suited to the quantification of recharge from soil water isotopes profiles.
Another limitation of the interpretation of soil water isotope profiles is that a long-term time series of precipitation isotopic com-position is required. Monthly time step time series have been used because they are more easily acquired or available from GNIP sta-tions almost all over the world. A monthly time step is shown here to enable the application of a hydro-isotopic surface budget and the identification of seasonal variations in recharge. If associated with soil sampling at a fine spatial resolution, typically every 5 cm or so, high-resolution precipitation data could allow the use of a two-component lumped parameter model, with both piston flow and dispersion models, to investigate the existence of preferential infiltration events, as proposed by Stumpp and Małoszewski (2010). Uncertainties in the surface water budget propagate also into the transport model. The major limitation of the transport model is the assumption of steady-state flow (homogeneous and constant soil water content), which is required to apply the lumped parameter dispersion model but which prevents any investigation of transient processes.
Finally, the surface water budget and transport models were calibrated in this study on one single profile taken at one
time, which is one of its strengths but also a limitation because it increases the uncertainties, from sampling and cryogenic extrac-tion to model calibraextrac-tion.
Despite these limitations, the simple surface and transport models are complementary to the peak-to-peak method and are applicable to sites where little information is available.
Impact of Evaporation on Water Isotopic
Composition in the Unsaturated Zone
Isotopic fractionation is associated with evaporation at the soil surface and is known to be an important control of the isoto-pic composition of water in soils (Barnes and Allison, 1983, 1988; Sutanto et al., 2012). The average negative lc-excess value in the unsaturated zone for PB indicates the role of local evaporation, and this was confirmed by the hydro-isotopic surface budget, where isotope fractionation had to be included to fit the data. For SLL, this is not the case; average lc-excess is positive and a good fit of the data is obtained without fractionation. The fitted f coefficient of
0.97 for evaporation at PB might not be directly transposed into evaporation partitioning but confirms that transpiration largely dominates water uptake for soil under a temperate climate and covered with grass. Evaporation occurring during the hot sum-mers clearly leads to isotope fractionation, but because there is no recharge during summer, this fractionated signal is barely pre-served in a small amount of soil moisture. When autumn rain is mixed with this small amount of fractionated water remaining in the soil reservoir, the evaporated signal is largely dampened. These values of f and evaporation therefore correspond to the recharge
periods, namely autumn and spring. At SLL, where average tem-peratures are lower, evaporation from the unsaturated zone is negligible during the recharge seasons, spring and autumn, and hence does not impact the isotopic composition of recharge.
For both sites, lc-excess appears to be a robust indicator of local evaporation intensity. Water stable isotopes in the unsatu-rated zone have thus already been used to partition evaporation and transpiration fluxes (Sutanto et al., 2012). Surface budgets for water stable isotopes, including fractionation associated with evaporation, as proposed in this study, should be further developed and tested under temperate climates.
Equation [5] is proposed as a simple parameterization of the isotope fractionation associated with evaporation in soils, but it would require improvement and validation by future experimental and numerical studies. Equation [5] was originally established for open water and is adapted to sites such as PB where evaporation fluxes are small and kinetic fractionation is limited. Future work should focus more specifically on the validation of such isotope fractionation equation. One major issue would be to include a parameterization or a fit of a temporal evolution of the f parameter,
which would require including partitioning of evapotranspiration.
6
Conclusion
Based on the results from two field sites with contrasting hydrologic and climate conditions, water stable isotope (d18O and
d2H) profiles in the unsaturated zone were shown to permit the quantification and identification of seasonality in recharge, based on the seasonality of the water isotopic composition of precipita-tion. A very simple approach consists of integrating the soil water content between extreme values of soil water isotopic composi-tion, typically corresponding to precipitation signatures during warm and cold seasons. When a time series of precipitation iso-topic composition is available, even at only a monthly time scale, a water isotope budget can be calculated at the surface using a conceptual overflowing soil reservoir model including mixing of successive precipitation but also isotope fractionation due to evapo-ration. The intensity of evaporation, associated with enrichment in heavy isotopes, can be constrained by the lc-excess measured in the unsaturated zone. A first and simple parameterization is proposed to take this fractionation into account in the surface water budget. This water budget can be constrained with the vol-ume-weighted average isotopic composition of pore water in the unsaturated zone and thus allows determination of the intensity and seasonality of recharge. This model and the peak-to-peak inte-gration lead to similar values, consistent at first order with more complex methods but emphasizing the uncertainties remaining on recharge quantification. A lumped parameter dispersion model is then used to represent percolation of water and attenuation of the water isotope signal at depth. It allows the main variations of water isotope composition with depth to be reproduced and soil parameters and transport processes to be discussed.
Even if the attenuation of the precipitation isotopic signal during recharge limits the investigation to the two first meters of the unsaturated zone and to sites with contrasting recharge periods, the approaches proposed in this study could be applied to a large number of sites and are very promising for the investigation of spatial and temporal variability of recharge as well as for drawing recharge maps at the local to regional spatial scales.
Data Availability
All data are available on request to the corresponding author. Acknowledgments
We thank the Fonds de recherche du Québec–Nature et technologies (FRQNT) and the Programme d’acquisition de connaissances sur les eaux souterraines du Québec (PACES) program for funding the Quebec portion of this research, as well as the Institut de Radioprotection et Sureté Nucléaire (IRSN) for assistance in collecting monthly rainfall samples. Camille Peretti and Karine Lefebvre are thanked for their help in the field and in the laboratory. We thank Associate Editor Christine Stumpp, as well as Matthias Sprenger and an anonymous reviewer for their comments that greatly helped improve the manuscript.
References
Adomako, D., P. Małoszewski, C. Stumpp, S. Osae, and T.T. Akiti. 2010. Estimating groundwater recharge from water isotope (d2H, d18O)
depth profiles in the Densu River basin, Ghana. Hydrol. Sci. J. 55:1405– 1416. doi:10.1080/02626667.2010.527847
Araguás-Araguás, L., K. Rozanski, R. Gonfiantini, and D. Louvat. 1995. Isotope effects accompanying vacuum extraction of soil water for stable isotope analyses. J. Hydrol. 168:159–171. doi:10.1016/0022-1694(94)02636-P Arnoux, M., F. Barbecot, E. Gibert-Brunet, J. Gibson, E. Rosa, A. Noret, and
G. Monvoisin. 2017. Geochemical and isotopic mass balances of kettle lakes in southern Quebec (Canada) as tools to document variations in groundwater quantity and quality. Environ. Earth Sci. 76:106.
doi:10.1007/s12665-017-6410-6
Barnes, C.J., and G.B. Allison. 1983. The distribution of deuterium and 18O in dry soils: 1. Theory. J. Hydrol. 60:141–156.
doi:10.1016/0022-1694(83)90018-5
Barnes, C.J., and G.B. Allison. 1988. Tracing of water movement in the unsaturated zone using stable isotopes of hydrogen and oxygen. J. Hydrol. 100:143–176. doi:10.1016/0022-1694(88)90184-9
Bengtsson, L., R.K. Saxena, and Z. Dressie. 1987. Soil water movement estimated from isotope tracers. Hydrol. Sci. J. 32:497–520. doi:10.1080/02626668709491208
Braud, I., T. Bariac, P. Biron, and M. Vauclin. 2009a. Isotopic composition of bare soil evaporated water vapor: II. Modeling of RUBIC IV experimental results. J. Hydrol. 369:17–29. doi:10.1016/j.jhydrol.2009.01.038
Braud, I., T. Bariac, J.P. Gaudet, and M. Vauclin. 2005. SiSPAT-Isotope, a coupled heat, water and stable isotope (HDO and H218O) transport
model for bare soil: I. Model description and first verifications. J. Hydrol. 309:277–300. doi:10.1016/j.jhydrol.2004.12.013 Braud, I., P. Biron, T. Bariac, P. Richard, L. Canale, J.P. Gaudet, and M.
Vauclin. 2009b. Isotopic composition of bare soil evaporated water vapor: I. RUBIC IV experimental set up and results. J. Hydrol. 369:1–16. doi:10.1016/j.jhydrol.2009.01.034
Cook, P.G., W.M. Edmunds, and C.B. Gaye. 1992. Estimating paleorecharge and paleoclimate from unsaturated zone profiles. Water Resour. Res. 28:2721–2731. doi:10.1029/92WR01298
Corcho Alvarado, J.A., R. Purtschert, F. Barbecot, C. Chabault, J. Rueedi, V. Schneider, et al. 2007. Constraining the age distribution of highly mixed groundwater using 39Ar: A multiple environmental
tracer (3H/3He, 85Kr, 39Ar, and 14C) study in the semiconfined
Fontainebleau Sands Aquifer (France). Water Resour. Res. 43:W03427. doi:10.1029/2006WR005096
Crosbie, R.S., B.R. Scanlon, F.S. Mpelasoka, R.C. Reedy, J.B. Gates, and L. Zhang. 2013. Potential climate change effects on groundwater recharge in the High Plains Aquifer, USA. Water Resour. Res. 49:3936– 3951. doi:10.1002/wrcr.20292
Darling, W.G., and A.H. Bath. 1988. A stable isotope study of recharge processes in the English Chalk. J. Hydrol. 101:31– 46. doi:10.1016/0022-1694(88)90026-1
Fisher, D.K. and H.C. Pringle. 2013. Evaluation of alternative methods for estimating reference evapotranspiration. Agric. Sci. 4: 51–60. doi:10.4236/as.2013.48A008
Gazis, C., and X. Feng. 2004. A stable isotope study of soil water: Evidence for mixing and preferential flow paths. Geoderma 119:97–111. doi:10.1016/S0016-7061(03)00243-X
Gehrels, J.C., J.E.M. Peeters, J.J. De Vries, and M. Dekkers. 1998. The mechanism of soil water movement as inferred from O-18 stable isotope studies. Hydrol. Sci. J. 43:579–594. doi:10.1080/02626669809492154
Gonfiantini, R. 1986. Environmental isotopes in lake studies. In: P. Fritz and J.C. Fontes, editors, Handbook of environmental isotope geochemistry. Elsevier, Amsterdam. p. 113–168.
Hagedorn, B., A.I. El-Kadi, A. Mair, R.B. Whittier, and K. Ha. 2011. Estimating recharge in fractured aquifers of a temperate humid to semiarid volcanic island (Jeju, Korea) from water table fluctuations, and Cl, CFC-12 and 3H chemistry. J. Hydrol. 409:650–662.
doi:10.1016/j.jhydrol.2011.08.060
Haverd, V., and M. Cuntz. 2010. Soil–Litter–Iso: A one-dimensional model for coupled transport of heat, water and stable isotopes in soil with a litter layer and root extraction. J. Hydrol. 388:438–455. doi:10.1016/j.jhydrol.2010.05.029
Healy, R.W., and P.G. Cook. 2002. Using groundwater levels to estimate recharge. Hydrogeol. J. 10:91–109. doi:10.1007/s10040-001-0178-0 Koeniger, P., M. Gaj, M. Beyer, and T. Himmelsbach. 2016. Review on soil
water isotope-based groundwater recharge estimations. Hydrol. Processes 30:2817–2834. doi:10.1002/hyp.10775
Kurylyk, B.L., and K.T.B. MacQuarrie. 2013. The uncertainty associated with estimating future groundwater recharge: A summary of recent research and an example from a small unconfined aquifer in a northern humid-continental climate. J. Hydrol. 492:244–253. doi:10.1016/j.jhydrol.2013.03.043