Data Quality Enhancement in Oil Reservoir
Operations: An application of IPMAP
By
Paul Hong-Yi Lin
BASc. Electrical Engineering (2006) The University of British Columbia
Submitted to the System Design and Management Program in Partial Fulfillment of the Requirements for the Degree of
Master of Science in Engineering and Management At the
Massachusetts Institute of Technology June 2012
@ 2012 Hong-Yi Lin. All rights reserved
The author hereby grants to MIT permission to reproduce and to distribute publicly paper and electronic copies of this thesis document in whole or in part in any medium now known or
hereafter created.
Signature of Author
Paul Hong-Yi Lin System Design and Management Program March 1, 2012 Certified by
Stuart E Madnick John Norris Maguire Professor of Information Technology Sloan School of Management Professor of Engineering Systems School of Engineering assachusetts Institute of Technology Thesis Supervisor Certified by_ _
Patrick Hale Director System Design & Management Program Massachusetts Institute of Technology
ARCHIVES
i7;ITUT
Data Quality Enhancement in
Oil
Reservoir Operations: An
application of IPMAP
By
Paul Hong-Yi Lin
Submitted to the System Design and Management Program
on March 1, 2012 in Partial Fulfillment of the Requirements for the Degree of Master of Science in Engineering and Management
ABSTRACT
This thesis presents a study of data quality enhancement opportunities in upstream oil and gas industry. Information Product MAP (IPMAP) methodology is used in reservoir
pressure and reservoir simulation data, to propose data quality recommendations for the company under study. In particular, a new 4-step methodology for examining data quality for reservoir pressure management systems is proposed:
1. Trace the data flow and draw the IPMAP
2. Highlight the cross-system and organizational boundaries
3. Select data quality analytical questions based on data quality literature review 4. Apply the analytical questions at each boundary and document the results This original methodology is applied to the three management systems to collect a pressure survey: using a spreadsheet, a standardized database and an automated database. IPMAPs are drawn to each of these three systems and cross-system and organizational boundaries are highlighted. Next, data quality systematic questions are applied. As a result, three data quality problems are identified and documented: well identifier number, well bore data and reservoir datum.
The second experiment investigates the data quality issues in the scope of reservoir simulation and forecasting. A high-level IPMAP and a process flow on reservoir simulation and forecasting are generated. The next section further elaborates on the first high level process flow and drills into the process flow for simulation. The analytical data quality questions are raised to the second simulation process flow and limited findings were documented. This thesis concludes with lessons learned and directions for future research.
Thesis Advisor: Stuart E. Madnick
John Norris Maguire Professor of Information Technology Sloan School of Management
Professor of Engineering Systems School of Engineering
ACKNOWLEDGEMENTS
I would like to thank Professor Stuart Madnick for his support, insight, and guidance in the course of my research.
I would like to thank Allen Moulton and Yang Lee for providing detail guidance and research directions.
I would also like to thank Director Patrick Hale for making the SDM program flexible to tailor to individual needs.
In addition, I would like to thank the colleagues in the EG organization who has spent time with me for interview and data collection.
Finally, I would like to thank my family and friends for love and support during my study at MIT.
Table of Contents
1. Introduction...8
1.1 Research M otivation ... 8
1.2 Research O bjective...9
1.3 Research Fram ework (Q ualitative Case Study)... 10
1.4 Structure of Thesis ... 12
1.5 Confidentiality ... 12
2. Background and Literature ... 13
2.1 U pstream O il and G as Industry ... 13
2.2 Data Q uality: IPMA P A pproach... 17
3. Reservoir Data: Pressure Survey ... 29
3.1 Pressure Survey ... 29
3.2 IPM A P ... 31
3.2.1 Case A : No form al system ... 32
3.2.2 Case B: Partially systematized with Reservoir Information System (RIS)... 34
3.2.3 Case C: Full cycle system with Well Pressure System (WPS) ... 39
3.3 A nalysis Results ... 43
3.3.1 C ase A A nalysis Results ... 45
3.3.2 Case B A nalysis Results ... 47
3.3.3 C ase C Analysis Results...49
3.3.4 System Analysis Results... 52
4. Fit-for-Purpose Reservoir Sim ulation & Forecasting ... 54
4.1 Fit-For-Purpose...54
4.2 IPM A P ... 56
4.3 Analysis Results ... 64
5. Conclusion...65
5.1 Lessons Learned ... 67
5.2 Directions and Enhancem ent for Future Research... 68
Table of Figures
Figure 1: Data Longevity ... 8
Figure 2: Reservoir Inform ation Process Flow ... 11
Figure 3: EG Upstream Business Inform ation Map ... 13
Figure 4: Generation and M igration of O il and Gas ... 15
Figure 5: The Seism ic Method ... 15
Figure 6: Oil Perforations ... 16
Figure 7: W aterflood ... 17
Figure 8: Five Nodes of IPMAP... 23
Figure 9: LCM of Pressure Survey ... 29
Figure 10: Exam ple of Pressure Survey ... 31
Figure 11: BHP Survey Search ... 31
Figure 12: IPMAP on Spreadsheet Process ... 32
Figure 13: IPMAP of RIS... 35
Figure 14: Enter API Num ber ... 37
Figure 15: Search API...37
Figure 16: Vendor and W ell Inform ation Check... 38
Figure 17: Verify Test Conditions ... 38
Figure 18: Charted Data...39
Figure 19: IPMAP of W PS... 40
Figure 20: Data Loaded Autom atically from W PL ... 41
Figure 21: User-inputted Values... 41
Figure 22: Design Pressure Bom b ... 42
Figure 23: FFP Three Step W orkflow ... 55
Figure 24: High Level IPM AP for Sim ulation ... 57
Figure 25: Process Flow for Design a New Subsurface Development...59
List of Tables
Table 1: Data Quality Dim ensions... 18
Table 2: Comparison Summary - IPMAP with Other Modeling Methods...21
Table 3: Sim ulation Analytical Questions ... 28
Table 4: Data Quality Dim ensions Sum mary... 28
Table 5: Data Q uality Dimensions... 45
Table 6: Spreadsheet Analysis... 46
Table 7: RIS Analysis...48
Table 8: W PS Analysis...50
Table 9: System Level Analysis ... 52
Table 10: Sim ulation Analytical Questions ... 64
1. Introduction
1.1 Research Motivation The Fundamental Problem
EnerGizer Inc. (EG) is an oil and gas company' that has global operations in oil productions and refineries. Profit of an oil and gas company derives primarily from its upstream business. Upstream oil and gas business refers to the searching for and the recovery and production of crude oil and natural gas. Upstream oil and gas decisions draw on massive quantities of data, internal EG analyst estimates that the data generated by its upstream business is growing at 60% per year. Furthermore, oil
reservoir simulation and forecasting requires complex engineering data calculations and assumptions. As a result, data quality plays a critical role in the profitability of EG. In general, the upstream oil and gas data quality problems can be summarized below:
> Data longevity: reservoir information value varies over its life cycle. In some cases, it declines uniformly and eventually becomes negative as shown in the Figure 1 ( Source: EG internal report) below. Or it could cyclically regain value through operational re-use. Therefore it is a challenge to decide on the data retention period. In addition, EG has a very long lived field that has reservoir pressure data predates 1927.
Delete?
Time (Minutes-Decades)
Figure 1: Data Longevity
>
Data accumulation: EG has over 52,0002 active wells. The Bureau of Ocean Energy Management, Regulation and Enforcement (BOEMRE) has a specific requirement for BHP surveys. For each new reservoir, a static BHP survey must be completed within 3 months after the date of first continuous production. EG also has an internal policy to conduct pressure surveys to a significant portion of its wells annually. As a result, vast amount of reservoir pressure information are accumulated every year.Although EG is a fictitious name, the research was conducted at an actual company
Oil price fluctuation: Oil price goes up and down. It is not economical to produce oil using advanced methods when the price of oil is at USD$20 per barrel back in 1995. Therefore, a reservoir may be in dormant state for some time with ceased production wells. There is a time gap in the reservoir pressure data collected.
> Business unit silos: Each business unit collects pressure data differently. There are at least three observed methods to collect pressure data. In Gulf of Mexico, an automated application/database called Well Bottom Hole Pressure (WPS) is used. In some specific North American region, pressure survey collection follows a systematic process and leverages the centralized database provided by IT Company called Reservoir
Information System (RIS). Third, in some fields, the whole process can be done by an engineer and stored in a spreadsheet.
>
Knowledge/information transfer: In 2007, industry analysts estimated that half of the oil and gas workforce will retire over the next decade. Significant amount of information is sitting in engineers' laptop or shelf. The know-hows need to be transferred to the next generation and the process has to be standardized.> Data ownership: Oil companies do not always own the data. The data owners could be:
>
National or local governments>
Individual property/mineral rights holders>
Multiple owners: Production Share Agreements; Joint Operating Agreements(JOA)
>
Service companies that lease data (seismic data for example)The complexity of data ownership further amplifies the reservoir pressure data storage, collection and consumption.
1.2 Research Objective
The data quality issues addressed above are not new, but have confronted oil and gas firms for decades. The research objective of this thesis is to recommend data quality enhancement opportunities, within the data scope of upstream oil and gas. The key research questions are:
>
Within the scope of reservoir data in upstream oil and gas, what are the cross-system and organizational flows by data that can be further investigated to identify data quality enhancement opportunities?Who are the data consumers and data creators? Who are the key stakeholders for the data collection and processing? What are the system and organization
boundaries an information product has to flow through? How is the data quality review conducted? What are the different methods to map out the data flow? It is believed that a complete trace of data flow can not only visualize the information process flow, but also an opportunity to spot data quality issues.
1.3 Research Framework (Qualitative Case Study) A Case Study Approach
The approach of this thesis is primarily based on case studies. As identified in S. Madnick et al.'s paper "Overview and Framework for Data and Information Quality Research" (2009), Case Study is one of the high level data quality research method. The case study is an empirical method that uses a mix of quantitative and qualitative evidence to examine a phenomenon in its real-life context (Yin 2002). The in-depth inquiry of a single instance or event can lead to a deep understanding of why and how it happened. Useful hypotheses can be generated and tested using case studies
(Flyvbjerg 2006). The method is widely used in data quality research. For example, Davidson et al. (2004) reported a longitudinal case study in a major hospital on how information product maps were developed and used to improve data quality. Several other data quality case studies can be found in (Lee et al. 2006).
Two-Phase Approach
An overlapping and simultaneous two phase research effort is applied. In other words, this approach is drilling two wells at the same time. This thesis is to look into two different data quality experiments using IPMAP.
Experiment I
The first case is to apply IPMAP to the reservoir pressure data. More specifically, the IPMAP is applied to the three different known management systems of collecting
pressure data as indicated in the reservoir pressure problem section earlier. This thesis is to suggest a new method to examine the data quality, in which is original in the data quality and IPMAP research field. This approach is to highlight the cross-system and organizational boundary on the IPMAPs drawn. The data quality questions, which are derived from data quality literatures, are applied at these cross-system and
organizational boundaries. This approach is applied to a detailed physical level to monitor and trace the data flow.
Experiment 2
The second case is to apply IPMAP to reservoir simulation and forecasting. IPMAP is applied to a high level or architecture level of reservoir simulation and forecasting. The IPMAP then attempts to drill into further details of data flow. This experiment will also look into the use of process flow, in addition to the IPMAP approach, to search for data quality improvement opportunities
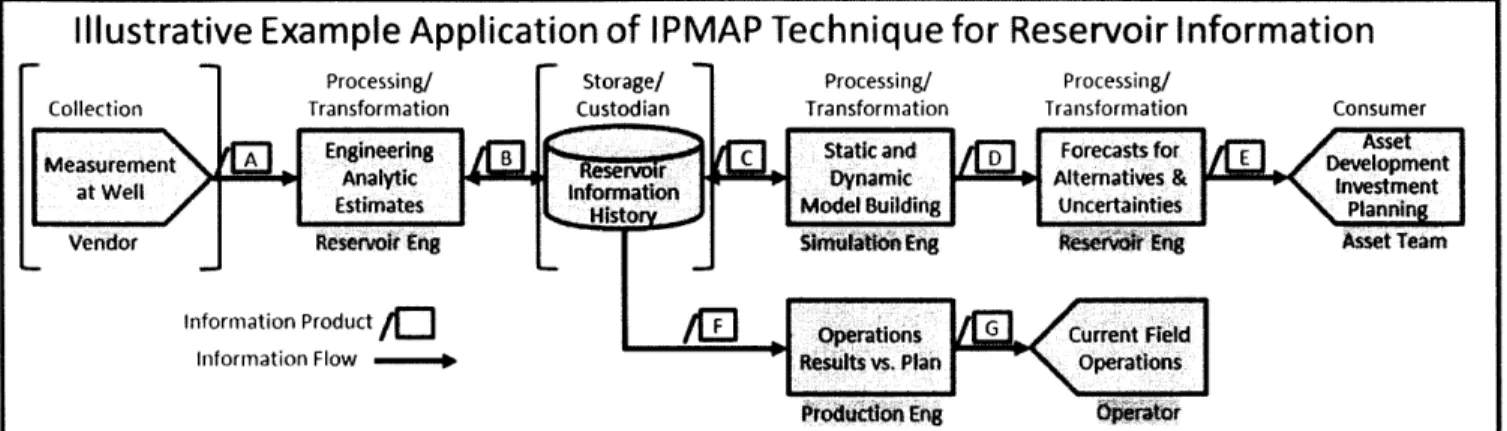
To understand more how does pressure survey fit into the overall upstream oil and gas business, the reservoir information process flow as shown in Figure 2 is referenced from MIT Information Quality program and EG.
Illustrative Example Application of IPMAP Technique for Reservoir Information
Processing/ Storage/ Processing/ Processing/
Collection Transformation Custodian Transformation Transformation Consumer
E n g ne ri n l anf io n M i gI n v o pt e n t
Vendor Reservoir Eng Simulation Eng Reservoir Eng Asset Team
information Product / 0 Operations G Current Field Information Flow -" Results vs. Plan Operations
Production Eng Operator
Figure 2: Reservoir Information Process Flow
The first step of reservoir pressure information collection involves having vendor to perform actually data measurement at a well. The second step is to process and transform the collected data into data analytics and estimates by reservoir engineer. The third step is to store the reservoir pressure data into a database. The Experiment 1 of pressure survey will be involved with the first three steps of the above process flow. The Experiment 2 involves the accumulation of the data in Experiment 1 and includes the fourth step which is to do reservoir modeling by simulation engineers. The ultimate
results of either of the processes feed into asset development team or operation team. How does the selected approach address the key research questions?
The IPMAP approach is selected because it could map out clearly the data flow during its life cycle. IPMAP can provide visualizations of the entire data flow and can isolate the system and organizational boundaries. Two different experiments are chosen in order to verify the applicability of IPMAP at both physical and architectural level.
Reservoir simulation and forecasting is selected because this process is performed based on the accumulated pressure data in the first experiment. This would represents a significant portion of the oil upstream business, as the combination of the two
experiments monitors how pressure data is collected and is feed into data transformation, simulation and forecasting, for business decision analysis. Data Sources
A hallmark of case study research is the use of multiple data sources, a strategy which also enhances data credibility (Patton, 1990; Yin, 2003). Potential data sources of this thesis include, but are not limited to: EG documentation, EG archival records, interviews with IT representative and subject matter experts, direct observations, and participant-observation. Within this case study research, critical qualitative and quantitative data
are collected, and they facilitate reaching a holistic understanding of the phenomenon being studied. Detailed academic resources are documented in the appendix section.
1.4 Structure of Thesis
Chapter 1 starts with the research motivation of the thesis. The fundamental problems of data in upstream oil and gas industry are listed. The research objective and key research questions are stated. The thesis methodology, two phase approach of drilling two experiments at the same time are explained with ties to the research questions. Chapter 2 provides background and literature information. In particular, an overview of
upstream oil and gas industry is presented. Basic oil and gas exploration, appraisal, and production concepts are introduced to give a better understanding of the problems at hand. The second part of this chapter explains the fundamental ideas of an Information Product Map (IPMAP).
Chapter 3 begins with the problems that the company under study is encountering in getting the accurate information about reservoir pressure. The three methodologies of obtaining pressure surveys are drawn into IPMAP. The data quality analytical questions are applied at cross-organizational boundaries. Potential data quality problems are discovered and recommendations are made.
Chapter 4 explains the simulation and forecast aspect of the upstream oil business. Multiple methods are used in this section in an attempt to identify data quality issues: IPMAP and process flow chart. The correlation of IPMAP with enterprise architecture is investigated and data quality issue is documented.
Chapter 5 concludes and summarizes the findings in this research. Areas for future research opportunities are suggested as well as the research improvement
recommendations. 1.5 Confidentiality
Production data and diagrams presented in this thesis have been distorted or are hypothetical for the purpose of ensuring the confidentiality of information proprietary to the company under study.
2. Background and Literature
2.1 Upstream Oil and Gas Industry
The oil and gas industry is commonly categorized into three major groups: Upstream, midstream and downstream, given midstream operations are typically included in the downstream category. This thesis will focus in the upstream oil sector, which typically refers to the searching for and the recovery and production of crude oil and natural gas. The upstream oil sector is also known as the exploration and production (E&P) sector.
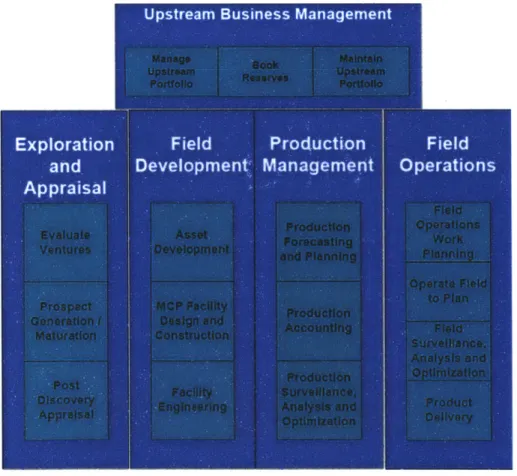
In EG's organization, the upstream business management division oversees four major business functions: Exploration and appraisal, field development, production
management and field operations. In addition, business function of subsurface
characterization and modeling and drilling completions and workovers act as support teams to the above-mentioned four major business units. As depicted in Figure 3,
reference from EG internal document, each business function is subdivided into next-level groups.
aptemBsnesMngmn
EG's organization has identified that sound reservoir management is an essential requirement of any successful oil and gas company. According to EG's Vice Chairman of the Board and Executive Vice President, Global Upstream and Gas, "EG's future success will in large part be measured by the ability to grow upstream production, while similarly growing the reserve base to enable further sustained production growth." Major oil companies are valued mainly on their proved reserves volumes as proved reserves are seen as a clear indicator of a company's future earning capability.
Consequently, for a company to sustain its competitive position, it needs to continue to replenish its proved reserves base as quickly as it is produced. As EG plans to grow production over the next ten years, they must maintain a Reserves Replacement Ratio (RRR) in excess of 100% in order to maintain their competitive position.
The market valuation depends on how attractive the future looks for the company under study. With less and less access to new basins and sizeable resources in many
countries, EG will have to focus more on what they have already discovered and how they can more effectively turn resources to reserves to production.
Reservoirs and crude oil production
Crude oil is a mixture of molecules formed by carbon and hydrogen atoms. Many types of crude oils exist, some more valuable than others. Heavy crude oils are very thick and viscous and are difficult or impossible to produce, whereas light crude oils are very fluid and relatively easy to produce (Hyne 2001).
In order to have a commercial deposit of gas or oil, three geological conditions must have been met (Hyne 2001). First, there must be a source rock in the subsurface of that area that generated the gas or oil at some time in the geological past. Second, there must be a separate, subsurface reservoir rock to hold the gas or oil. Third, there must be a trap on the reservoir rock to concentrate the gas or oil into commercial quantities. The source of gas and oil is the organic matter that is buried and preserved in the ancient sedimentary rocks. In the subsurface, temperature is the most important factor
in turning organic matter into oil (Hyne 2001). As the source rock is covered with more sediment and buried deeper in the earth, it becomes hotter and hotter. The minimum temperature for the formation of oil is about 1200F. The reactions that change organic
matter into oil are complex and time consuming. If the source rock is buried deeper where temperatures are above 3500F, the remaining organic matter will generate
natural gas.
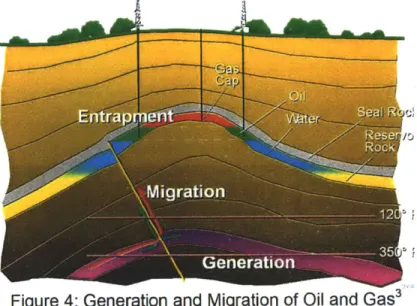
After oil and gas have been generated, they rise through fractures in the subsurface rocks. The rising gas and oil can intersect a layer of reservoir rock. A reservoir rock is a sedimentary rock that contains billions of tiny spaces called pores (Hyne 2001). The gas and oil flow into the pores of the reservoir rock layer. Water, gas or oil will always flow along the path of least resistance. In the subsurface, a reservoir rocky layer has the least resistance. The ease in which the fluid can flow through the rock is called
permeability, and the movement of the gas and oil up the angle of the reservoir rock toward the surface is called migration. Figure 4 illustrates the generation and migration of oil and gas.
Figure 4: Generation and Migration of Oil and Gas3
As the gas and oil migrates up along the reservoir rock, it can encounter a trap. A trap is a high point in the reservoir rock where the gas or oil is stopped and concentrated. In the trap, the fluids separate according to their density. The gas goes on to the top to form gas cap. Oil goes into the middle layer. The water stays at the bottom. A caprock or seal rock must be present to enclose the fluids and complete a trap. Oil and gas could leak up to the surface without a caprock.
Figure 5: The Seismic Method4
So how do oil and gas companies locate the reservoirs? Seismic exploration method is the answer. Seismic exploration uses an acoustic source and several hydrophone array
Source: http://ugmsc.wordpress.com/2011/03/30/one-day-course-review-hydrocarbon-prospect-in-western-indonesia/. Date accessed: June 26, 2011.
detectors (Hyne 2001). The source is located near the surface and emits an impulse of sound energy into the subsurface, as shown above in Figure 5. The sound energy
bounces off sedimentary rock layers and returns to the surface to be recorded by the detector. Sound echoes are used to make an image of the subsurface rock layers.
Next, companies uses a rotary drilling rig to drill a well in order to find out if a trap contains commercial amounts of gas and oil. A well drilled to find a new gas or oil field
is called a wildcat well. Offshore wells are drilled the same as on land. For offshore wildcat wells, the rig is mounted on a barge, floating platform, or ship that can be moved
(Hyne 2001). Once an offshore field is located, a production platform is then installed to drill the rest of the wells and produce the gas and oil.
To evaluate the well, a service company runs a wireline well log. Depending on the test
results, the well can be plugged and abandoned as a dry hole or completed as a producer.
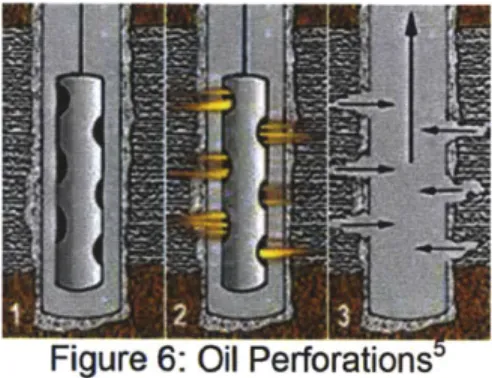
Once a producer well is established, the casing is shot with explosives to form holes called perforations, as shown in Figure 6, in order to allow the gas or oil to flow into the well (Hyne 2001). Most oil wells, however, do not have enough pressure for the oil to flow to the surface. As a result, artificial lift is introduced. A common artificial lift system
is a sucker-rod pump. The pump lifts the oil up the tubing to the surface. On the surface, a separator, a long and steel tank, is used to ungroup natural gas and salt water from the oil (Hyne 2001). The oil is then stored in steel stock tanks.
Figure 6: Oil Perforations
As oil and gas are ejected from the subsurface reservoir, the pressure on the reservoir
drops. The production of oil and gas from a well decreases with time on a decline curve. Ultimate recovery of gas from a gas reservoir is roughly 80% of the gas in the reservoir.
Oil reservoirs, on the other hand, are way more variable. They range from 5% to 80% recovery but average only 30% of the oil in the reservoir (Hyne 2001). This leaves 70% of the oil remaining in the pressure-depleted reservoir.
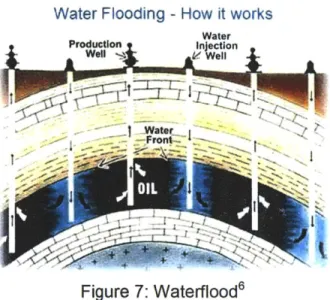
Once the primary recovery is done, a secondary recovery method call water-flood, as shown in Figure 7, can be applied to the reservoir and attempt to squeeze some more of the remaining oil out. During a water-flood, water is pumped under pressure down
injection wells into the depleted reservoir to force some of the remaining oil through the reservoir toward producing wells. Enhanced oil recovery involves pumping fluids that are not natural to the reservoir, such as carbon dioxide or steam, down injections wells to obtain more production.
Water Flooding - How it works
Water
Producion Inecto
i . - 7 ,
Figure 7: Waterflood6
After the well has been depleted, it is plugged and abandoned. Cement must be poured down the well to seal the depleted reservoir and to protect any subsurface fresh water reservoirs. A steel plate is then welded to the top of the well.
2.2 Data Quality: IPMAP Approach Data Quality
Poor data quality can have a severe impact on the overall effectiveness of an
organization. An industry executive report noted that more than 60% of surveyed firms (500 medium-size corporations with annual sales of more than $20 million) had
problems with data quality. The Wall Street Joumal also reported that, "Thanks to computers, huge databases brimming with information are at our fingertips, just waiting
to be tapped. They can be mined to find sales prospects among existing customers;
they can be analyzed to unearth costly corporate habits; they can be manipulated to divine future trends. Just one problem: Those huge databases may be full of junk. .. .In a world where people are moving to total quality management, one of the critical areas is data."
The quality of a product depends on the process by which the product is designed and produced (Wand and Wang 1996). Likewise, the quality of data depends on the design and production processes involved in generating the data. To design for better quality, it is necessary first to understand what quality means and how it is measured. Data
6 Source:
quality, as presented in the literature, is a multidimensional concept. Frequently mentioned dimensions are accuracy, completeness, consistency, and timeliness. The choice of these dimensions is primarily based on intuitive understanding (Ballou and Pazer 1985), industrial experience (Firth and Wang 1996), or literature review (Kriebel
1979). However, a literature review (Wang, Storey and Firth 1995) shows that there is
no general agreement on data quality dimensions.
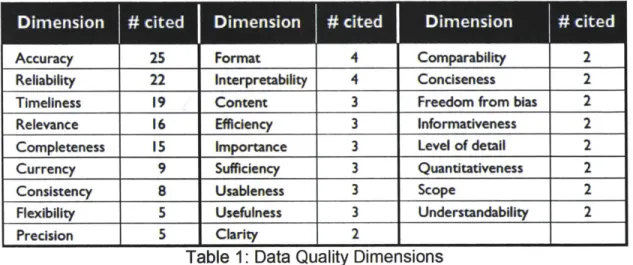
Wand and Wang provided a summary of data quality dimensions from various literatures as shown in Table 1.
Accuracy 25 Format 4 Comparability 2
Reliability 22 interpretability 4 Conciseness 2
Timeliness 19 Content 3 Freedom from bias 2
Relevance 16 Efficiency 3 Informativeness 2
Completeness 15 Importance 3 Level of detail 2
Currency 9 Sufficiency 3 Quantitativeness 2
Consistency 8 Usableness 3 Scope 2
Flexibility 5 Usefulness 3 Understandability 2
Precision 5 Clarity 2
Table 1: Data Quality Dimensions
The table provided the most often cited7 data quality dimensions based on a
comprehensive literature review (Wang, Storey and Firth 1995). The descriptions and definitions for the top-cited data quality dimensions are documented below.
Accuracy and Precision:
There is no exact definition for accuracy. According to Wand and Wang, inaccuracy can be interpreted as a result of garbled mapping into a wrong state of the information system. Lack of precision is a case which is typically viewed as inaccuracy.
Incompleteness may cause choice of a wrong information system state during data production, resulting in incorrectness. Note that inaccuracy refers to cases where it is possible to infer a valid state of the real world, but not the correct one. This is different from the case of meaningless states where no valid state of the real world can be inferred.
Reliability:
Reliability has been linked to probability of preventing errors or failures (Hansen 1983), to consistency and dependability of the output information (Kriebel 1979), and to how well data ranks on accepted characteristics (Agmon and Ahituv). In addition, reliability
7 Each appearance in a published article is counted as one citation. Thus, the result is biased in favor of the
dimensions used by authors who have published extensively and authors whose articles have been quoted by others. However, as as indicator of the notable data quality dimensions, the result provides a reasonable basis for further discussion.
has been interpreted as a measure of agreement between expectations and capability (Brodie 1980), and as how data conforms to user requirements or reality (Agmon and Ahituv). It is clear there is no generally accepted notion of reliability and that it might be related either to characteristics of the data or of the system.
Timeliness and Currency:
Timeliness has been defined in terms of whether the data is out of date (Ballou and Pazer 1985) and availability of output on time (Kriebel 1979). A closely related concept is currency which is interpreted as the time a data item was stored (Wang, Reddy and Kon 1995). Timeliness is affected by three factors: How fast the information system state is updated after the real-world system changes (system currency); the rate of change of the real-world system (volatility); and the time the data is actually used. While the first aspect is affected by the design of the information system, the second and third are not subject to any design decision. Lack of timeliness may lead to a state of the
information system that reflects a past state of the real world. Completeness:
Generally, the literature views a set of data as complete if all necessary values are included: "All values for a certain variable are recorded" (Ballou and Pazer 1985). Completeness is the ability of an information system to represent every meaningful state of the represented real world system (Wand and Wang 1996). Thus, it is not tied to data-related concepts such as attributes, variables, or values. A state-based
definition to completeness provides a more general view than a definition based on data; in particular, it applies to data combinations rather than just to null values. Also, it
enables data items to be mandatory or optional depending on the values of other data items.
Consistency:
In the literature, consistency refers to several aspects of data. In particular, it links to values of data, to the representation of data, and to physical representation of data. A data value can only be expected to be the same for the same situation. Inconsistency would mean that the representation mapping is one to many.
IPMAP
Literature in data quality management, reflecting over three decades of research, has suggested many viable solutions for assessing, managing, and improving quality (Shankaranarayanan and Wang 2007). The Total Data Quality Management (TDQM) approach for systematically managing data quality in organizations is a dominant paradigm (Wang 1998). This addresses not just data but also the processes that create that data. It is based on the perspective of managing data as a product and adopts several concepts from the manufacture of physical products. One of these is modeling and representing the manufacture of data products (Wang et al. 1998). In this thesis, the analysis is based on research on models for data manufacture, focusing on the
Visualizing the Creation of an Information Product
Given the volumes of data and the complexity in managing data within organizations, it is becoming increasingly evident that a formal modeling method that can alleviate the task of data quality managers is needed. This can be accomplished by offering data quality managers the ability to represent, in an intuitive and easy manner, the complex "production" systems that are used to capture, store, create, and communicate data in organizations (Shankaranarayanan and Wang 2007). A graphical representation of the different process elements (Ballou et al. 1998) can be used to create a visualized mapping of the data process. One such representation is the IPMAP. The IPMAP is an extension of the Information Manufacturing System or IMS proposed in (Ballou et al. 1998).
Process documentation, specifically in a visual form, contributes to data quality
improvement and provides an important tool to all information stakeholders - managers will find it important for capturing the entire process and understanding all the elements that are involved (Redman 1996), (Shankaranarayanan et al. 2003). According to Shankaranarayanan and Wang (2007), the IPMAP helps the data quality manager (the custodian) see what raw materials are used (source blocks), what processing is
performed and what new data is created (processing blocks and output data elements), what intermediate storages are involved (storage blocks), how data elements are assembled to create subcomponents and final IPs (assembly - variation of processing blocks), what quality checks are conducted (inspection blocks), whether a
subcomponent is reworked (cyclic flows), how the final IP is formatted (variation of processing blocks) and who is using the IP (consumer block).
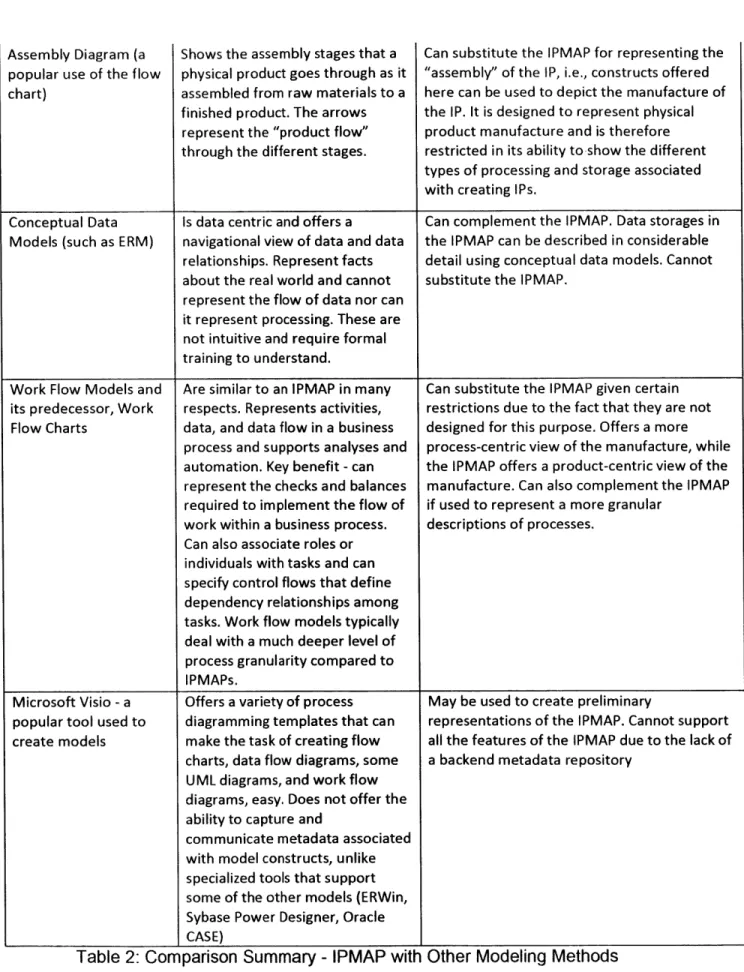
Distinguishing IPMAP from Other Modeling Methods
The IPMAP, in data quality management, serves primarily as a management tool that helps analyze and understand data manufacturing processes (Shankaranarayanan and Wang 2007). It is important to understand how other modeling methods are different
from IPMAP and whether if they can complement or substitute the IPMAP.
Shankaranarayanan and Wang reviewed some of these methods and discussed the relative merits and demerits of the IPMAP. A summary of this comparison is presented in the table below.
Model / Software Tool How does it differ from IPMAP? Can it complement / substitute the IPAMP?
Process Flow Chart (top Shows the steps within a process. Can complement the IPMAP. Process stages
down chart or a The arrows between stages within the IP and the business rules/logic
detailed flow chart) capture the predecessor / associated with each processing stage can be
successor association. The flow of made explicit using Process Flow Charts.
Assembly Diagram (a popular use of the flow chart)
Shows the assembly stages that a physical product goes through as it assembled from raw materials to a finished product. The arrows represent the "product flow" through the different stages.
Can substitute the IPMAP for representing the "assembly" of the IP, i.e., constructs offered here can be used to depict the manufacture of the IP. It is designed to represent physical product manufacture and is therefore restricted in its ability to show the different types of processing and storage associated with creating IPs.
Conceptual Data Is data centric and offers a Can complement the IPMAP. Data storages in Models (such as ERM) navigational view of data and data the IPMAP can be described in considerable
relationships. Represent facts detail using conceptual data models. Cannot about the real world and cannot substitute the IPMAP.
represent the flow of data nor can it represent processing. These are not intuitive and require formal training to understand.
Work Flow Models and Are similar to an IPMAP in many Can substitute the IPMAP given certain its predecessor, Work respects. Represents activities, restrictions due to the fact that they are not Flow Charts data, and data flow in a business designed for this purpose. Offers a more
process and supports analyses and process-centric view of the manufacture, while automation. Key benefit - can the IPMAP offers a product-centric view of the represent the checks and balances manufacture. Can also complement the IPMAP required to implement the flow of if used to represent a more granular
work within a business process. descriptions of processes. Can also associate roles or
individuals with tasks and can specify control flows that define dependency relationships among tasks. Work flow models typically deal with a much deeper level of process granularity compared to
IPMAPs.
Microsoft Visio - a Offers a variety of process May be used to create preliminary
popular tool used to diagramming templates that can representations of the IPMAP. Cannot support create models make the task of creating flow all the features of the IPMAP due to the lack of
charts, data flow diagrams, some a backend metadata repository
UML diagrams, and work flow
diagrams, easy. Does not offer the ability to capture and
communicate metadata associated with model constructs, unlike specialized tools that support
some of the other models (ERWin, Sybase Power Designer, Oracle
CASE)
Evaluating Data Quality in Context
A key principle of leveraging Information Product Map (IPMAP) in a given scenario is that the concept of information must be managed as a product using an information product approach, or IP approach. Contrast this approach to the often observed
treatment of information as by-product. The by-product approach places its focus on the wrong target, usually the system instead of the end product, the information (Lee et al. 2006).
A data element is defined as the smallest unit of a given data. Examples of a data element are names, data of birth, degree programs and etc. Information product is defined as a collection of data elements. Each information product has to have a specific data consumer. The data consumer is the final node on an IPMAP. Data consumers could be government regulatory reports, senior management teams, and legal representatives.
According to Lee et al. (2006), managing information as product requires a fundamental change in understanding information. To properly treat information as product, a
company must follow four rules:
>
Understand the consumer's information needs.>
Manage information as the product of a well-defined production process.> Manage information as a product with a life cycle.
>
Appoint an information product manager to manage the information product. The IPMAP offers a comprehensive view of the data used in a decision-task by informing the consumer about the sources or providers of the data, storages, transformations and processing, logic and assumptions associated with these transformations and processing, and the custodians associated with each of these stages (Shankaranarayanan and Wang 2007). It further provides access to the methods for evaluating quality. The consumer or decision-maker now has the ability to compute and gauge the quality of the data in the context of the task in which the data is to be used. The decision maker would do so by assigning weights to the data, reflecting theperceived importance of that data for the task it is used. Need for Managing DQ in Inter-organizational settings
The advances in information technology (IT) greatly facilitate inter-organizational data exchange. IT reduces the data collection, transfer and processing costs and makes data assets more attractive and valuable to create, own, and manage. Daniel and White (2005) suggest that the inter-organizational data linkages will become ubiquitous in the future. Data networks for inter-organizational data exchange are characterized by
multiple, independent data sources from which this data is extracted, and multiple, independent data repositories in which the data is captured / stored. Data management for decision-making in such environments involves gathering relevant data from outside the organization and integrating it with local data. Organizations appear to implicitly
assume that the quality of the data obtained from other organizations is acceptable. Research indicates that poor data quality (DQ) is a serious problem within many organizations (e.g., Eckerson 2002). In a network supporting data exchange among organizations, it is important to assure organizations of the quality of data they get from other organizations. A prerequisite is that organizations must first manage DQ internally.
Further, organizations use data received from another organization as inputs (either directly or after processing) to their business operations and decision-making. The issue of data quality is therefore not local to or isolated within one specific organization.
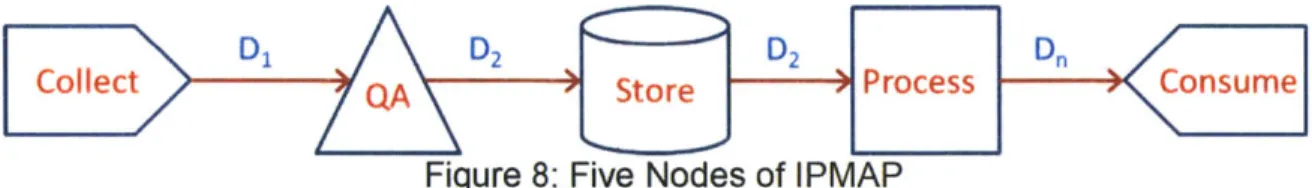
Developing Information Product Maps
To execute the information product approach, a firm needs not only a supportive
philosophy but also models, tools, and techniques. In this thesis, five possible nodes of collect, quality analysis, store, process, consume will be representing the information product flow, as illustrated in Figure 8.
> Di D2 D2 Dn
collect QA Store Process Consume
Figure 8: Five Nodes of IPMAP
Detail contents of these five nodes are customized and documented in the later section of the reservoir pressure IPMAP. As a general rule, collect nodes is the start node of an IPMAP. Collect is the process of capturing the initial information product or involves in the creation of the information product. There can be more than one collect node,
despite the fact that typically one collect node is sufficient. Quality analysis (QA) node is one of the process nodes and specializes in information quality verification. It is
common to have several QA nodes in an IPMAP as the ultimate benefit of IPMAP is to trace the information flow thoroughly and to enhance data quality. Store node is also a very popular node that will be appeared quite often. This can be the firm's data
management systems, databases or storage space of an application or tool. There are no changes to the data here as this process node is only for storage and information
retrieval. The process node is a general process node that is not either a storage or QA.
It can be representing any process that is applied to a given information product during its life cycle. Typically, there are a lot of process nodes in an IPMAP and they do change the contents or formats of the information product. The consume node is the final stop of the information product. There could be multiple consume nodes as the information product has several information customers.
An IPMAP is composed of mixtures of the five nodes, with arrows in between them indicating the directions of the information flow. The information or data flowing between nodes is marked with data identification number.
2.3 Experimental Method Two-Phase Approach
An overlapping and simultaneous two phase research effort is applied. In other words, this approach is drilling two wells at the same time. This thesis is to look into two different data quality experiments using IPMAP.
Experiment I
The first case is to apply IPMAP to the reservoir pressure data. More specifically, the IPMAP is applied to the three different known management systems of collecting pressure data as indicated in the reservoir pressure problem section. This thesis is to suggest a new method to examine the data quality, in which is new in the data quality and IPMAP research field. This approach is to highlight the cross-system and
organizational boundary on the IPMAPs drawn. The data quality questions, which are derived from data quality literatures, are applied at these cross-system and
organizational boundaries. This approach is applied to a detailed physical level to monitor and trace the data flow.
This new approach contains 4 distinct steps: 1. Trace the data flow and draw the IPMAP
2. Highlight the cross-system and cross-organizational boundaries
3. Select data quality analytical questions based on data quality literature review 4. Apply the analytical questions at each boundaries and document the results
The purpose of the IPMAP approach is to identify data quality improvement opportunities. This new approach is applied to 3 cases:
; Case A: No formal system
> Case B: Partially systematized using standardized RIS management system
> Case C: Full cycle system using autonomous WPS management system Step 1: Trace the data flow and draw the IPMAP
Draw the IPMAPs from the origin of the information product to the consumer of the information product.
Step 2: Highlight the cross-system and cross-organizational boundaries One of the key advantages of this IPMAP method is to isolate the system and
organizational boundaries. A cross-system boundary is a situation where the data flows through from one system to another within the same company context. A
to another company context. As data makes its cross-system or cross-organizational boundary flow, it may experience different data quality expectations and treatment. As a result, data loss or quality damage may occur. On the IPMAPs, system and cross-organizational boundaries will be highlighted.
The next step is to re-visit and summarize the data cross-system and organizational boundary flow by the three IPMAPs.
With all the cross-system and cross-boundary scenarios listed out, the next step is to apply the data quality analytical questions to each one of the scenarios and document the findings. These data quality questions are selected based on the data quality
literature review.
Step 3: Select data quality analytical questions based on data quality literature review
The top 7 most cited data quality dimensions are accuracy, reliability, timeliness,
relevance, completeness, currency and consistency. Based on these top 7 dimensions, 6 data quality analytical questions are derived. Systematic questions to examine data quality as information product flow across system and organizational boundaries:
>
Could data source provide multiple outputs for a single data request? (Consistency, Accuracy)>
Is there time expiration to the data? (Timeliness)> If the data is updated on the origin organization, is the data acquiring organization
notified of the data updates? (Currency)
> Can the data acquiring organization modify the data on its behalf? (Flexibility, Accuracy)
> Has any quality check performed once the data is migrated to a new organization? (Accuracy, Reliability)
Step 4: Apply the analytical questions at each boundaries and document the results
The findings of the analysis result will be documented and data quality improvement opportunities will be recommended.
The next set of the analysis investigates the quality of the three different pressure survey management systems at the system level. The questions to be considered for each of the management systems:
> Is there a standardized process for issuing pressure survey?
> Is there a standardized process for designing pressure survey?
> Is there a standardized process for storing the pressure survey?
The findings of the analysis result will be documented and data quality improvement opportunities will be recommended.
Experiment 2
The second case is to apply IPMAP to reservoir simulation and forecasting. IPMAP is applied to a high level or architecture level of reservoir simulation and forecasting. The IPMAP then attempts to drill into further details of data flow. This experiment will also look into the use of process flow, in addition to the IPMAP approach, to search for data quality improvement opportunities.
This new approach contains 6 distinct steps:
1. Trace the data flow and draw the IPMAP at high level
2. Highlight the cross-system and cross-organizational boundaries
a. If boundaries cannot be identified, apply the process flow diagram b. Drill into more detailed level of process flow diagram
3. Select data quality analytical questions based on data quality literature review 4. Apply the analytical questions at each boundaries and document the results
Step 1: Trace the data flow and draw the IPMAP
Draw the IPMAPs from the origin of the information product to the consumer of the information product at the high level.
Step 2: Highlight the cross-system and cross-organizational boundaries a. If boundaries cannot be identified, apply the process flow diagram If the cross-system and cross-organizational boundaries cannot be identified at the architectural level, this approach will shift direction to apply process flow diagram. As the data quality literature suggests, a process flow diagram can be beneficial to the data quality study.
b. Drill into more detailed level of process flow diagram
In order to apply any data quality analytical questions, the nodes must be further drilled into more detail steps.
Step 3: Select data quality analytical questions based on data quality literature review
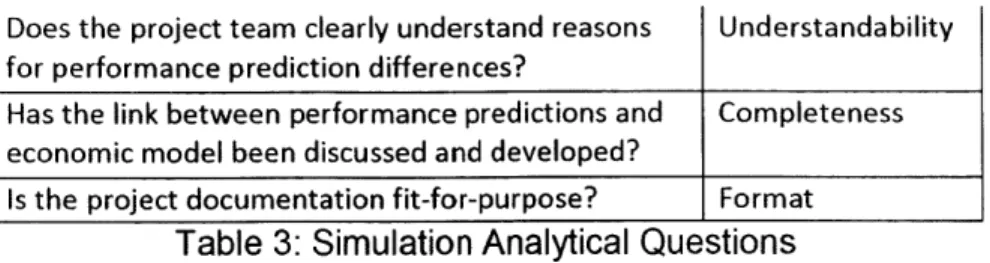
I brainstormed several questions based on the data quality dimensions listed in the data quality literature. These questions are organized below:
Dimension Does the plan clearly show how the proposed model Clarity will meet the reservoir characterization &
simulation objective(s)?
Is the reservoir simulation plan consistent with the Consistency
project objective?
Are there sufficient resources allocated to the Sufficiency
reservoir simulation project?
Has the plan capture the impact of uncertainties? Reliability
Have all the project stakeholders been consulted Completeness
and agreed with the simulation project plan?
Is the reservoir simulation plan clearly documented? Clarity
Is the project scoping plan up-to-date? Currency
Can the reservoir simulation objectives be met with Scope
the planned grid?
Do the selected realizations cover the full range of Reliability
geologic reservoir uncertainty?
Has adequate number of geologic realizations being Completeness
applied in the uncertainty analysis workflow? One model is typically inadequate, three to five are recommended.
Has rigorous screening techniques used for selecting Accuracy geologic realizations?
Has a comprehensive list of reservoir uncertainty Completeness
parameters and ranges been identified?
Has the entire project team agree with the Completeness
uncertainty parameters and ranges?
Does the up-scaled model adequately preserve Accuracy
pertinent geologic and flow characteristics?
Has post scale-up diagnostic tools employed to Accuracy
quantify accuracy of scale-up?
Are the initial reservoir simulation input parameters Accuracy
correct, and is the reservoir simulation model in equilibrium prior to start of production or injection?
Do the wells in the reservoir simulation model Accuracy
deliver correct production rates with specified surface or down hole back pressures?
Do the performance predictions adequately Informativeness
represent the business scenarios under consideration?
Does entire project team agrees with the business Completeness
cases under evaluation with reservoir simulation model?
Does the project team clearly understand reasons Understandability for performance prediction differences?
Has the link between performance predictions and Completeness
economic model been discussed and developed?
Is the project documentation fit-for-purpose? Format
Table 3: Simulation Analytical Questions
The analytical questions raised above attempts to address non-technical issues during the process, in an effort to optimize the information and data quality during the
simulation. Each question is classified into a specific data quality dimension as defined in the background section of this report. The table below summarizes the data quality dimensions applied.
Clarity Consistency Sufficiency Reliability Completeness Currency Scope Accuracy Informativeness Understandability Format
2 1 1 2 6 1 1 5 1 11
Table 4: Data Quality Dimensions Summary
Step 4: Apply the analytical questions at each boundaries and document the results
Similar to Experiment 1, data quality questions will be applied and the findings of the analysis result will be documented and data quality improvement opportunities will be recommended.
3. Reservoir Data: Pressure Survey
As indicated in the introduction, this first experiment drills into the process of collecting pressure data. Oil and gas companies gather pressure data by requesting third party vendors to perform pressure surveys on the production wells. This section is to introduce pressure survey and draw IPMAPs for three management systems of managing pressure survey data in EG. The key research objectives are to trace the data flow of the pressure survey process, highlight the system and organizational boundaries and search for data quality problems.
3.1 Pressure Survey
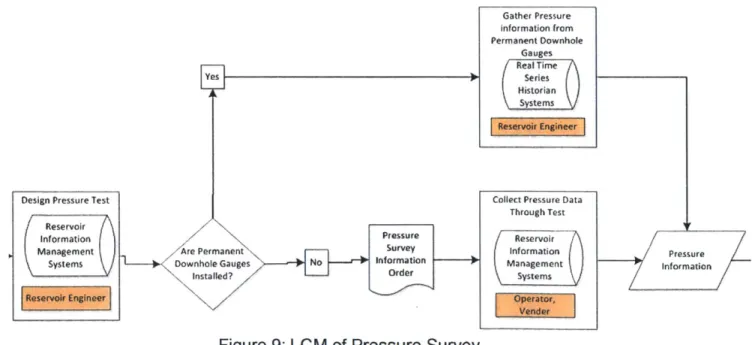
Life Cycle Model (LCM) describes the target architecture of information, in context of the business functions they support, and additionally illustrates the logical systems in which information resides and flows. Figure 9, reference from EG internal document, shows a small section of the Life Cycle Model (LCM), co-produced by EG's IT team and MIT Information Quality (IQ) project team. LCM maps out the entire process flow for EG's upstream business at an aggregated level. In order to identify potential information quality problems, this case is drilled into logical level where the actual business
processes take place. The focus will be on how to design the pressure survey test and how to collect the pressure survey data, within the business level of reservoir
surveillance, analysis and optimization.
Gather Pressure information from Permanent Downhole Gauges Real Time Series Historian Systems
Collect Pressure Data
Through Test Reservoir information Management Systems
Before describing how a pressure survey is performed, it is useful to understand the terminologies associated with reservoir pressure. Tubing pressure is measured on the fluid in the tubing, whereas casing pressure is measured on the fluid in the tubing-casing annulus. Bottom Hole Pressure (BHP) is measured at the bottom of the well. The pressure is measured either as flowing, with the well producing, or shut-in or static, after the well has been shut-in and stabilized for a period of time such as 24 hours. The original pressure in a reservoir before any production has occurred is called virgin, initial, or original pressure. During production, reservoir pressure decreases. Reservoir pressure can be measured at any time during production by shut-in BHP in a well. A
pressure bomb, an instrument that measures BHP, can be run into the well on a wire line. A common pressure gauge consists of a pressure sensor, recorder, and a
clock-driven mechanism for the recorder. The chart records pressure with time as the test is being conducted. Temperature can also be recorded on a similar instrument.
As this experiment will explore further into the collection and use of pressure surveys, an example of actual shut-in pressure survey is provided in Figure 10 below:
BOMB TYPE LMR SERIAL # 9441 CLOCK: NA CALIBRATION DATE:
RESERVOIR DATUM, SS PRESSURE DATE
K.B. ELEVATION ABOVE S.L. + LAST TEST
RESERVOIR DATUM, TVD THIS TEST 09/07/99
K.B. TO TUBING HANGER 46 CHANGE
PERFORATED INTERVAL MD 6310-6320 RATE OF CHANGE PSI/DAY
TUBING PRESSURE: 538 PSIG CASING PRESSURE: 747 PSIG
PRESSURE TAKEN BY: jim USING TREE GAUGE
LIQUID LEVEL (TVD) FT STOPS MADE OUT TANDEM RUN: YES
MD MD TVD PRESSURE A A GRADIENT DEGREES GRADIENT
FROM FROM FROM PSLA PSIA TVD A/ A F A i A
TBG HEAD K.B. K.B. P TVD DEG F TVD 0 46 46 551 96.0 419 465 464 556 5 418 0.012 101.0 0.012 919 965 964 562 6 500 0.012 103.0 0.004 1919 1965 1939 575 13 975 0.013 106.0 0.003 2919 2965 2764 586 11 825 0.013 116.0 0.012 3919 3965 3404 638 52 640 0.081 125.0 0.014 4419 4465 3724 746 108 320 0.338 130.0 0.016 4919 4965 4125 881 135 401 0.337 135.0 0.012 5419 5465 4586 1036 155 461 0.336 140.0 0.011 5919 5965 5058 1212 176 472 0.373 143.0 0.006 6019 6065 5152 1259 47 94 0.502 144.0 0.011 MID-PERFS 6315 5386 1360 101 202 0.502 146.2 0.011 DATUM
* LAST MEASURED GRADIENT * RESERVOIR FLUID GRADIENT
DATUM SUBSEA: FIELD: E.I 456
SOURCE CODE: STME SAND: LOWER 9900
BHP (TVD) LEASE: OCS-G 4325
BOTTOM HOLE TEMP: 144.0 DEG F WELL #: B-8
SI TEST DURATION: 48 HRS API#:
BOMB ON BOTTOM: 48 HRS CHEV NO:
Figure 10: Example of Pressure Survey8
A typical pressure survey contains measured depth (MD), true vertical depth (TVD), temperature, pressure at different depth in a well. Bottom hole Pressure Survey usually measured in pounds per square inch (psi), at the bottom of the hole. A service company typically charges about $300 for a pressure survey conducted on land. Reservoir
pressure changes over time. The goal of BHP survey is to update the changing reservoir pressure and accumulate the reservoir pressure data about a specific
reservoir, in which can help engineers understand and characterize the reservoir better. Minerals Management Service (MMS) provides an online query, an index in delimited ASCII format and an Access file to download. The online query select options include Field, Lease, Well, API and Reservoir. A sample output is shown in Figure 11.
Field e FiekiLeas WellAPI I PI Reservoir TsSI eservir DteDTTVD BH SI Depth DepthaBHPRe ark
AC025 G10380 HA03 608054000902 P1-10 8/7/2001
[13640
12385 Deep water welFigure 11: BHP Survey Search9
Field is the name of the field in which the well is located. Lease number is the number assigned to a lease by the regulatory agency having jurisdiction over mineral activity in the territory where the lease is located. Well is the name assigned to the completion by the lease operator. API well number is a unique well identification number consisting of (from left to right) a two digit state code (or pseudo for Offshore), a three digit county code (or pseudo for Offshore), a five digit unique well code, and if applicable, a two digit sidetrack code as defined in API Bulletin D1 2A. The reservoir has two columns. The first one is the name given to an oil or gas reservoir. The second one is the name given to an oil or gas reservoir as applied to the name submitted on the MMS well summary form.
3.2 IPMAP
To re-iterate the concepts of IPMAP, an information product is traced from data producer to information consumer, including highlighting the cross-system and
organizational boundaries. This section is to apply the IPMAP method to the 3 pressure survey management systems within the EGs firm:
A) No formal system
B) Partially systematized
C) Full cycle system
8 Source: http://petroleumengineeringspreadsheets.com/bhp reports/file
description bhp reports.html. Date
accessed: February 15, 2012
3.2.1 Case A: No formal system
In some business units, the number of active producers is limited. There is no business need to pay for centralized database service or to set up a customized database tool. The engineers leverage their wisdom and know-how to execute the process of
collecting pressure surveys. This approach is named no formal system as the business process integration and standardization is low. The IPMAP of this case is shown in Figure 12.
Well Master Data
---Nod* S Nod* I Node 2
Do P/S P/S Request + Well bore and I
IT DesignTest ell/Reservigr master Data
Master Data
P/5 Ord r Info
Nod@ 4
1 P/S I Well/Reservoir
iMeasure Master Data
P/S Meas ements
Fail
I Nodspreadsheet in
N engineer's
Performcomputer
CIA P/S Qualit Checkcoptr _
P/S Mea rements P/S ort
I
Nod* 6 N m nodhP/S Calculation Softcopy or printed report
m
Hardcopy on a shelf
I Exten IP/5
i Measur nt
The IPMAPs were prepared with Microsoft PowerPoint using the nodes that are drawn on a 5-by-5 matrix, 5 nodes maximum both horizontally and vertically.
The green number that starts with "Node" is the node identification number and it indicates the sequence of the nodes. Each node has exactly one node identification
number. The green arrow represents the direction of the information object flow. In most cases, the green arrow is a solid line and dotted line is only used whenever there is a
need for a feedback loop, for information object to flow back to earlier nodes. The red font on top of the green arrows specifies the information object flowing between the
nodes.
The orange box marks the organizational boundary of the vendor company. The small blue dotted box manifests the system boundary of well master data. Reservoir or
production engineers initiate the request for pressure survey in node 1. In this node, the engineer also designs the pressure survey test. In node 2, they look for well bore and master data to look up the required well/reservoir master data including API number, completion number, well, and reservoir information. These data then delivers to vendor to perform the pressure survey. There are two cross-system and cross-organizational data flows occurred in this two steps.
After node 2, pressure survey order info crosses the organizational boundary to the vendor side. Nodes 3 to 7 are all within the jurisdiction of the vendor. This IPMAP does not go into the technical or operational details of how vendors perform pressure survey. Instead, this IPMAP gives an aggregated overview of the required process to complete the task. Node 3 "Do P/S" confirms that the vendor has received the requested BHP survey and allocates the necessary resources to fulfill the request. The P/S order info is passed from node 8 to node 9, "P/S measurement". Since node 4 is the actual collection of P/S measurement data, it is marked as a collection node. The P/S measurements obtained in node 4 is then delivered to a triangular quality analysis node, node 5 "QA P/S", where the measurements undergo a preliminary quality analysis by the vendor. The verified data goes to node 6 "P/S Calculation", where necessary derivations are calculated. The final data is combined with the original P/S order info into extended P/S measurement, which feeds into node 7 "Prepare P/S Report". Node 7 marks the final destination of the vendor organization and it produces the P/S Report to be delivered to the next node, where the second cross-organizational information product flow occurs. In node 8, engineers receive the pressure survey report from vendor and starts data quality check based on their experiences and expertise. They would validate the well master data information from the survey report with well master data. This is where the second cross-organizational boundary flow by the information product takes place. Next, they would judge the gauge data on the report, whether these values are accurate or not based on the engineer's subject matter knowledge. The engineers would ask the vendors to re-submit a new pressure survey if the quality review failed.