HAL Id: hal-02285559
https://hal.archives-ouvertes.fr/hal-02285559
Submitted on 12 Sep 2019
HAL is a multi-disciplinary open access archive for the deposit and dissemination of sci-entific research documents, whether they are pub-lished or not. The documents may come from teaching and research institutions in France or
L’archive ouverte pluridisciplinaire HAL, est destinée au dépôt et à la diffusion de documents scientifiques de niveau recherche, publiés ou non, émanant des établissements d’enseignement et de recherche français ou étrangers, des laboratoires
A Lab Experiment for Optimizing the Cooling Efficiency
and the Watering Rate of Pavement-Watering
Sophie Parison, Martin Hendel, Arnaud Grados, Kristine Jurski, Laurent
Royon
To cite this version:
Sophie Parison, Martin Hendel, Arnaud Grados, Kristine Jurski, Laurent Royon. A Lab Experiment for Optimizing the Cooling Efficiency and the Watering Rate of Pavement-Watering. Urban Climate, Elsevier, In press. �hal-02285559�
A Lab Experiment for Optimizing the Cooling
Efficiency and the Watering Rate of Pavement-Watering
Sophie PARISON1,2*, Martin HENDEL1,3, Arnaud GRADOS4, Kristine JURSKI4, Laurent ROYON1
1Univ Paris Diderot, Sorbonne Paris Cité, LIED, UMR 8236, CNRS, F-75013, Paris, France 2Paris City Hall, Water and Sanitation & Road and Transportation Departments, Paris, France 3Universite´ Paris-Est, ESIEE Paris, département SEN, F-93162 Noisy-le-Grand, France 4Univ Paris Diderot, Sorbonne Paris Cité, MSC, UMR 7057, CNRS, F-75013, Paris, France *corresponding author: sophie.parison@univ-paris-diderot.fr
Abstract
Due to their tendency to absorb heat, urban materials participate in the formation of urban heat islands thus contributing to increased health risks during heat waves. Since 2013, the city of Paris has experimented in situ pavement-watering campaigns as an emergency cooling tool during heat-waves. These studies have highlighted the influence of the materials being watered on the optimal watering strategy to adopt. In this regard, a laboratory experiment was developed to study the thermal behaviour of various urban materials under heat-wave conditions with or without watering. Here, results from watering an asphalt road structure with twelve different rates are presented to fine-tune the process for optimal cooling. The sample undergoes a heat-wave-like 24-hour cycle inside a climate chamber. Two distinct cooling regimes are highlighted versus the watering rate, corresponding to the increase of evaporation with the watering rate until maximum evaporation rate is reached. This aspect was used to maximise the cooling efficiency of the method while minimising the water consumption. Using the surface heat budget, the evaporative cooling flux was also determined. Pavement-watering was found to have a great impact on heat stored in the pavement and released to the atmosphere. Results otherwise compare favourably with field observations.
Keywords: urban heat island, urban materials, pavement-watering, heat transfer, densely-graded asphalt concrete, climate chamber
Highlights
A laboratory experiment was developed to fine-tune watering on an asphalt road structure
Two cooling-regimes are exhibited allowing the optimisation of the process
Surface heat budget was used to assess the cooling flux and maximum evaporation rate
The method is found to significantly reduce radiative, conductive and convective exchanges
Results compare favourably with previous field studies and overall trend is satisfactory
Nomenclature
α albedo [-]
c specific heat of water: 4.18 kJ/(kg.K) ΔQ absorbed heat flux by the 6-cm top layer
[W/m²]
E evaporation rate [mm/h]
𝜀 emissivity [-]
h convective heat transfer coefficient
[W/(m2.K)]
H upwards atmospheric convective flux
[W/m²]
IR infrared
l vaporization latent heat of water: 2,260 J/kg
LW longwave
MCTP mass convection transport problem
Φ pavement cooling flux [W/m²]
φg global surface heat flow [W/m²]
φrad radiative surface heat flow [W/m²]
Q watering rate [mm/h]
Rn downwards net radiation [W/m2]
density [kg.m-3]
S incident shortwave radiation [W/m2]
σ Stefan-Boltzmann constant [W/(m2.K4)]
Ts surface temperature [°C]
Tz pavement temperature at depth z [°C]
UHI urban heat island
Vz downwards conductive heat flux at depth z [W/m²] Subscript/superscript ref/up reflected/upwards w water z depth [m]
1. Introduction
It is well established that urban heat islands (UHI) pose a serious threat for urban populations and lead to greater cooling energy use in cities, especially during heat-waves [Robine 2008, Stone 2010, Grimmond 2007]. Such events are expected to become both more frequent and intense in the years to come, namely in Paris, France [Lemonsu 2013]. Because of that, a growing number of cities have recently sought ways to mitigate them. Various countermeasures have been proposed with that aim, such as urban greening and watering [Akbari 2001, Bowler 2010, Du 2016,Daniel 2016], urban forms with increased wind permeability [Morris 2001] or promoting the use of cool materials [Santamouris 2013, Qin 2015]. Indeed, because of their low albedo and great heat storage capacity, it is known that man-made pavement materials commonly used in the urban fabric play a major role in the UHI phenomenon [Mohajerani 2017, Asaeda 1996, Erell 2013].
Asphalt concrete structures are one of the most common paving materials in cities and significantly contribute to UHI [Synnefa 2011]. Yet, substituting one material with another is not always possible, since the design goals of a pavement is decisive regarding the mitigation strategies to favour. For instance, road structures are determined by mechanical requirements rather than thermal behaviour. Urban planning should always account for this precondition in order to assess the viability of a UHI mitigation strategy accordingly. Bearing this in mind, pavement-watering constitutes an interesting UHI mitigation tool, as it can easily be performed on existing pavements for areas where other countermeasures are difficult to implement [Kinouchi and Kanda 1997, Bouvier 2013, Li 2013, Daniel 2016].
Previous work by the authors has focused on the implementation of a field study taking place each summer since 2013 in Paris, taking advantage of the city’s non-potable water network to conduct pavement-watering during hot summer days. Pavement-watering provides beneficial thermal and microclimatic effects leading to an improvement of pedestrian thermal comfort with reductions up to 2.8°C in UTCI-equivalent temperature, concurrent with peak outdoor temperatures [Hendel 2014, 2015 & 2016, Parison 2017]. In addition to evaluating the method’s cooling effects, these studies underlined the important role played by the materials themselves on the performance of the process.
Many studies have focused on the thermal behaviour of pavements [Asaeda 1996, Doulos 2004, Takebayashi 2012, Li 2015], but very few of them account for the influence of the underlying layers of the structure. These base layers have an impact on the global behaviour of the pavement structure as a whole [Hendel 2018]. Some laboratory-scale studies have also been conducted [Ueno 2009, Wu 2018], but to date none of them include pavement-watering.
In this paper, experimental lab results are analysed to characterize the thermal behaviour of a watered asphalt road structure under heat-wave-like conditions. The set-up has been used in previous stage under dry conditions only, on five pavement structures including asphalt road and sidewalk, granite sidewalk, stabilized sand and grass. Results showed that grass was the coolest structure, followed by stabilized sand and granite, while asphalt road and sidewalk were the hottest [Hendel 2018]. Here, a wide range of watering rates was tested on the asphalt road in the aim of determining the optimal watering rate. Both temperature and heat flow measurements were conducted at several depths. The evaporative cooling flux, as well as the convective, radiative and conductive contributions were assessed for each rate, and the contribution on the urban climate in terms of heat storage and release was estimated and discussed. In the end, good agreement was found with field studies, thus validating our experimental approach. The work described here has been ongoing since 2016 [Hendel 2016b, 2016c & 2017, Parison 2017b].
2. Material and methods
2.1. Case study structure
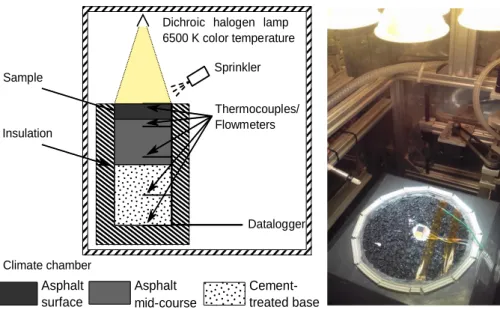
A single asphalt road structure was tested with and without watering of its surface at different watering rates. The cylindrical sample is 32 cm tall and 16 cm in diameter. The structure was directly prepared in a cylindrical test tube following the quality control procedures of the Paris City Hall public space laboratory. Its structure is identical to that prescribed for Parisian roadways and is composed of three different layers: a 4 cm asphalt concrete surface course, a 12 cm asphalt concrete mid-course, and a 16 cm cement-treated base, as illustrated in Figure 1. The thermal properties of these layers has been determined in previous work [Hendel, 2018].
Figure 1: Studied structure sample
Albedo was determined in previous experiments for a dry surface [Hendel 2018]. In order to determine the change in albedo resulting from watering, comparative measurements were conducted with a different sample with a Cary 5 UV-Vis-NIR spectrophotometer and integrating sphere, for both a dry and a wet surface using the halogen lamp spectra of the experimental set-up. The observed decrease in albedo was applied to the albedo of the cylindrical sample. Surface emissivity was determined by infrared (IR) camera using the reference black body method. Values are summarized in Table 1.
Table 1 : Emissivity and albedo values of the asphalt road structure’s top layer
Emissivity of dry surface (𝜀𝑑𝑟𝑦) Albedo of dry surface (𝛼𝑑𝑟𝑦) Albedo of wet surface (𝛼𝑤𝑒𝑡)
0.99 0.08 0.06
2.2. Experimental set-up
The experimental set-up used here is described in detail in Hendel [2018]. The sample is equipped with thermocouples and flowmeters on its surface and 6 and 14 cm deep, and only with a thermocouple 25 cm deep. Those depths are used for all samples and help avoid placing sensors at the interface between different layers. Material layers were sawed to allow instrument placement and reconstructed with bitumen or cement for the cement-treated base. Thermal insulation of its bottom and periphery is ensured using a 5 cm thick polyurethane foam casing. The sample is placed in a climate chamber, which controls air temperature and relative humidity. Irradiance is controlled with a seven-bulb dichroic halogen lamp with a colour temperature of 6500 K placed above the sample. Air circulation inside the chamber is auto-regulated by the chamber and identical between tests. A diagram and photograph of the experimental set-up are presented in Figure 2.
4 cm 16 cm Asphalt surface Asphalt mid-course Cement-treated base
Figure 2: Diagram (left) and photograph (right) of the experimental set-up
Once installed, the sample undergoes a 24-h climate cycle with imposed Parisian heat-wave-like conditions: an 8-hour day phase with artificial insolation, and a 16-8-hour night phase without insolation. Air temperature and relative humidity are set respectively to 35°C and 35% during the day and to 25°C and 70% during the night. What is more, during the day phase, surface-watering can be programmed to the desired frequency using a sprinkler placed near the sample’s surface. Each spray delivers about 1 mL on average, i.e. a film of approximately 0.05 mm (0.05 L/m²) in water height. Different watering rates are programmed by modifying the frequency between two consecutive sprays. Finally, to avoid water infiltration, the edges of the asphalt road sample were sealed. All in all, one dry trial and twelve different watered trials were performed. Measurements are conducted at ten-second intervals. A summary of the characteristics of the 24-h climate cycle is provided in Table 2.
Table 2: Characteristics of the day and night phases
Day phase Night phase
Duration 8 h 16 h Air temperature 35°C 25°C Relative humidity 35% 70% SW radiation (0.3-3 μm) 1200 W/m² 0 W/m² LW radiation (3-100 μm) 180 W/m² 450 W/m² Watering rates (Q) 1.0 - 1.25 - 1.5 - 2.0 - 2.5 - 3.0 mm/h 0 - 0.1 - 0.25 - 0.4 - 0.5 - 0.6 - 0.75 - 0 mm/h
Air temperature is measured with a thermocouple located a few centimetres above the sample’s surface.
2.3. Heat transfer analysis
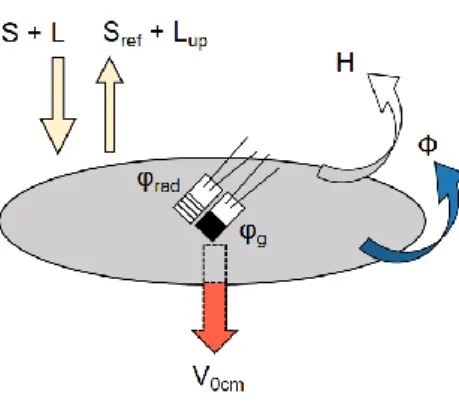
We now present the methodology for determining the latent heat flux created by pavement-watering. The surface heat budget is provided in Figure 3.
Dichroic halogen lamp 6500 K color temperature Datalogger Climate chamber Sample Insulation Thermocouples/ Flowmeters Asphalt surface Asphalt mid-course Cement-treated base Sprinkler
Figure 3: Schematic diagram of heat balance at the pavement surface. S is downward shortwave (SW) radiations, L longwave (LW) radiations, Sref and Lup, respectively the reflected SW and upward LW radiations, H the upward atmospheric convective heat flux, V0cm the absorbed heat flux at the surface, Ф the cooling flux due to watering. φrad is the radiative flux measured by a radiative heat flow sensor (ε=1, α=0) and φg the global heat flux measured by the fluxmeter (ε=0.95, α=0.05).
The energy balance of the surface can be completely described by the following equations for dry and wet surface conditions: 𝑅𝑛 𝑑𝑟𝑦 = (𝑆 + 𝐿) − (𝑆𝑟𝑒𝑓+ 𝐿𝑢𝑝) (1) 𝑅𝑛 𝑑𝑟𝑦 = 𝐻𝑑𝑟𝑦+ 𝑉 0𝑐𝑚 𝑑𝑟𝑦 (2) 𝑅𝑛𝑤𝑒𝑡= 𝐻𝑤𝑒𝑡+ 𝑉0𝑐𝑚𝑤𝑒𝑡+ Ф (3) Ф = 𝑙𝐸 + 𝑐𝜌𝑄(𝑇𝑠𝑤𝑒𝑡− 𝑇𝑤) (4)
Rn is the net downward radiation received by the surface; S and L, respectively, downward shortwave (SW) and
longwave (LW) radiations and Sref and Lup, respectively the reflected SW and upward LW radiations. H is the
upward atmospheric convective heat flux; V0cm is the absorbed heat flux at the surface and Ф the cooling flux due
to watering. The latent heat of vaporization of water is noted l (2260 J/g); E is the evaporation rate of the water film; c is the specific heat of water (4.18 kJ.kg-1.K-1); the water density (1000 kg.m-3); Q is the watering rate; Tswet
is the surface temperature when wet; and finally Tw is the water temperature, i.e. 35°C during the day phase (verified
experimentally).
We now unpack the terms of these equations. According to Jürges [1924], H can be written as:
𝐻 = ℎ(𝑇𝑠− 𝑇𝑎) (5)
where h is the convective heat transfer coefficient and Ta is the air temperature. With α the surface albedo, the Sref
can be written:
𝑆𝑟𝑒𝑓 = 𝛼𝑆 (6)
Lup, is expressed as:
𝐿𝑢𝑝= (1 − 𝜀)𝐿 + 𝜀𝜎𝑇𝑠4 (7)
where ε refers to the surface emissivity, and σ the Boltzmann’s constant. Therefore, using both equations (6) and (7), equation (1) can be rewritten as follows:
To determine the quantities of interest for our experiment, the sample’s surface was equipped with a black-painted global heatflowmeter (ε=0.95, α=0.05), denoted φg, and a radiative heatflowmeter (ε=1, α=0), denoted φrad.
Quantities measured by each sensor are given below:
𝜑𝑔= 𝑅𝑛
𝜀=0.95, 𝛼=0.05
− 𝐻 = 0.95 (𝑆 + 𝐿 − 𝜎𝑇𝑠4) − 𝐻 (9)
𝜑𝑟𝑎𝑑= 𝑅𝑛𝜀=1, 𝛼=0= (𝑆 + 𝐿) − 𝜎𝑇𝑠4 (10)
Using equation (10), incident SW and LW radiation received at the sample surface is obtained using:
𝑆 + 𝐿 = 𝜑𝑟𝑎𝑑+ 𝜎𝑇𝑠4 (11)
Thus, Rndry is obtained directly from equation (8), while H is calculated using equation (12) below, derived from
equation (9).
𝐻𝑑𝑟𝑦= 0.95 (𝑆 + 𝐿 − 𝜎𝑇
𝑠4) − 𝜑𝑔 (12)
V0cm is then calculated as the residual term from equation (2). The heat budget is therefore entirely resolved.
However, this method cannot be used during watering when the radiation flowmeter is not useable and φg includes Φ (with φg = Rnε=0.95, α=0.05 – Hwet – Φ). Instead, the following equations should be considered, obtained by
subtracting equations (2) and (3), and replacing each term.
Ф = (𝐻𝑑𝑟𝑦− 𝐻𝑤𝑒𝑡) + (𝑉 0𝑐𝑚 𝑑𝑟𝑦 − 𝑉0𝑐𝑚𝑤𝑒𝑡) + (𝑅𝑛𝑤𝑒𝑡− 𝑅𝑛 𝑑𝑟𝑦 ) = 𝛥𝐻𝑑𝑟𝑦−𝑤𝑒𝑡+ 𝛥𝑉 0𝑐𝑚 𝑑𝑟𝑦−𝑤𝑒𝑡 − 𝛥𝑅𝑛 𝑑𝑟𝑦−𝑤𝑒𝑡 (13)
Equation (13) shows that the cooling flux Φ is partitioned into changes of convective, conductive and radiative heat flows. Assuming that the convective heat transfer coefficient h is constant and independent of the watering rate, and taking into account that the air temperature is set to 35°C during day phase, equation (5) can be used to derive ΔH as follows: 𝛥𝐻𝑑𝑟𝑦−𝑤𝑒𝑡= ℎ(𝑇 𝑠 𝑑𝑟𝑦 − 𝑇𝑠𝑤𝑒𝑡) (14) ΔV is detailed in equation (15): 𝛥𝑉0𝑐𝑚 𝑑𝑟𝑦−𝑤𝑒𝑡 = 𝑉0𝑐𝑚 𝑑𝑟𝑦 − 𝑉0𝑐𝑚𝑤𝑒𝑡= (𝑉−6𝑐𝑚 𝑑𝑟𝑦 + 𝛥𝑄𝑑𝑟𝑦) − (𝑉 −6𝑐𝑚𝑤𝑒𝑡 + 𝛥𝑄𝑤𝑒𝑡) (15)
with V-6cm the pavement heat flux density measurement 6 cm deep and ΔQ the heat flux absorbed by this 6-cm
top-layer. Assuming that watering does not influence the heat transfer process through the sample, ΔQ can be deemed constant [Hendel, 2015]. Relationship (15) then becomes:
𝛥𝑉0𝑐𝑚𝑑𝑟𝑦−𝑤𝑒𝑡 = 𝑉−6𝑐𝑚𝑑𝑟𝑦 − 𝑉−6𝑐𝑚𝑤𝑒𝑡 (16)
Finally, the radiative part is:
𝛥𝑅𝑛 𝑑𝑟𝑦−𝑤𝑒𝑡 = (𝐿𝑤𝑒𝑡𝑢𝑝 − 𝐿𝑢𝑝 𝑑𝑟𝑦 ) + (𝑆𝑟𝑒𝑓𝑤𝑒𝑡− 𝑆𝑟𝑒𝑓 𝑑𝑟𝑦 ) = 𝜎(𝜀𝑤𝑒𝑡𝑇𝑠𝑤𝑒𝑡 4− 𝜀𝑑𝑟𝑦𝑇𝑠 𝑑𝑟𝑦 4 ) + (𝜀𝑑𝑟𝑦− 𝜀𝑤𝑒𝑡)𝐿 + (𝛼𝑤𝑒𝑡− 𝛼𝑑𝑟𝑦)𝑆 (17)
Since, V-6cm, Ts, ΔQ, S and L are measured and unaffected by surface watering, Φ can be determined on the basis
of equations (13), (14), (16) and (17). From Φ and the advective term, we can therefore obtain the evaporation rate for each trial.
On the basis of previous work [Hendel 2015], two cooling regimes are expected: latent and sensible. The former begins at the start of watering and ends once the maximum evaporation rate is reached, at which point additional watering only increases sensible cooling.
2.4. Watering optimization
The current paper presents results from the lab experiment [Hendel 2018] with the aim of optimising the watering process on the basis of a previously-developed framework [Hendel 2015], without having to implement costly, long lasting field campaigns. Goals chosen for the optimization were:
Maximise pavement cooling Φ
Minimize the watering rate Q
The cooling effects of pavement watering can be assessed by performing a heat transfer analysis, following the steps exposed in section 2.3. By doing so, a preliminary analysis of V0cm, H and Rn is required. Using the two
cooling regimes expected from the above-mentioned framework, both goals can eventually be achieved.
3. Experimental results
We now present the response of the asphalt road in both dry and watered conditions, beginning with surface temperature observations.
3.1. Surface temperature
Figure 4 shows surface temperature as function of time for different watering rates. For clarity, only six out of thirteen different watering rates are presented.
Figure 4: Surface temperature variations of the asphalt road sample with (blue) and without (red) watering for various watering rates (namely 0.1 (a), 0.25 (b), 0.5 (c), 0.75 (d), 2.0 (e) and 3.0 (f) mm/h). Horizontal dashed lines respectively represent day (red) and night
(blue) phases air temperature, while the black vertical dashed line marks the transition between day and night phases.
As can be seen, at the end of day phase for the non-watered trial, surface temperature reaches a maximum of about 62°C, which is usual for an asphalt structure under such conditions [Doulos 2004, Hendel 2014]. At the end of the day phase, an exponential decrease of temperature is immediately observed as the lights are being turned off and the setpoint temperature and humidity switch to their night values.
0 5 10 15 20 25 Durat ion (h) Dry 3.0 m m /h 0 5 10 15 20 25 Durat ion (h) Dry 2.0 m m /h 0 5 10 15 20 25 Durat ion (h) 30 40 50 60 T e m p e ra tu re ( °C ) Dry 0.75 m m /h Dry 0.5 m m /h Dry 0.25 m m /h 30 40 50 60 T e m p e ra tu re ( °C ) Dry 0.1 m m /h upper front lower front Lights on (day phase) Lights off (night phase) (a) (d) (b) (c) (e) (f)
For relatively small watering rates, the appearance of spikes throughout day phase is observed. These spikes are simultaneous with watering. These temperature spikes are caused by the rapid cooling and drying created by water sprinkling [Hendel 2015, Hendel 2018]. As illustrated in Figure 4(a), the limit formed by the spike maxima is referred to as the “upper front” while the spike minima limit is designated as “lower front” for the rest of this article. The presence of spikes suggests that the watering rate should be increased to maximise cooling effects of the method [Hendel 2014].
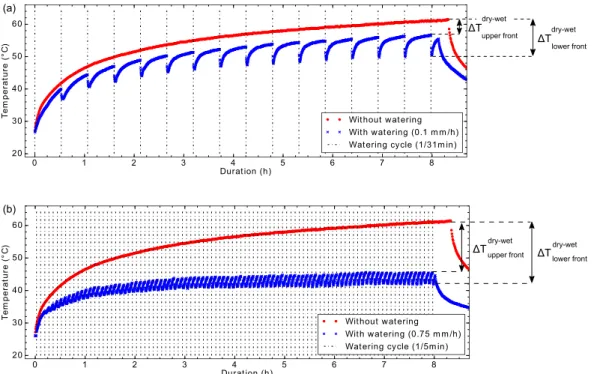
As the watering rate increases, spike frequency increases with the watering frequency while spike amplitude and maximum surface temperatures decrease. Finally, once a certain watering rate is reached, no additional variation in temperature is observed with increased watering, as can be seen for example between Figure 4(e) and 4(f). This means that the maximum evaporable quantity of water under these conditions has been sprinkled, and that additional water does not provide additional latent cooling. A close-up at the watering spikes is provided in Figure 5 for two rates: 0.1 mm/h and 0.75 mm/h. Watering cycles are indicated with dot-dashed vertical lines.
Figure 5: Asphalt road surface temperature during day phase with (blue) and without (red) watering, for 0.1 mm/h (a) and 0.75 mm/h (b). Observed surface cooling, i.e. the difference between non-watered and watered maximum temperatures, noted ΔTmaxdry-wet, illustrated in Figure 5, is summarized for the upper and lower fronts in Table 3.
Table 3: Maximum surface temperature reductions for lower and upper fronts with regard to the dry trial for each rate
Q (mm/h) ΔTmaxdry-wet(°C)
upper front lower front
0.1 4.8 11.0 0.25 6.5 13.0 0.4 10.9 15.9 0.5 12.6 17.2 0.6 15.8 19.1 0.75 15.8 19.5 1.0 15.9 20.9 1.25 18.1 23.1 1.5 22.3 22.1 2.0 21.1 22.2 2.5 20.9 21.8 3.0 22.0 22.6
The watering effect is plotted as a function of the watering rate Q in Figure 6. Error bars shown here take into account the fluctuations observed for watered trials and for the initial temperature value of the current test. They are then propagated into the calculation of ΔTmaxdry-wet.
Figure 6: Difference between non-watered and watered maximum surface temperature ΔTmaxdry-wet for lower and upper fronts as a function of the watering rate. A double linear piecewise regression with zero-intercept is used (dashed lines) to distinguish the two regimes. As expected, two linear regimes are visible: latent and sensible. The former is characterized by a significant increase of surface cooling along with Q. For the latter, cooling only marginally increases with Q. A double piecewise linear regression with forced zero-intercept is performed and plotted beside the upper front observations as well as the equation of the obtained fit. The same applies for the rest of this article when relevant. All R²-coefficients were found greater than 0.95. Roughly, 26°C is gained per additional millimetre sprinkled per hour while evaporation isn’t maximized, whereas only a few tenths of a degree are gained once the surface remains wet. The intersection between these regimes, denoted Qopti, is 0.78 mm/h and represents the optimal watering rate.
3.2. In-depth temperatures
In-depth temperature variations are illustrated in Figure 7 for a dry trial and for the same watering rates as those shown in Figure 4.
Figure 7: Temperature variations 6 cm (left), 14 cm (center) and 25 cm (right) deep for non-watered and watered trials (i.e. 0.1, 0.25, 0.5, 0.75, 2.0 and 3.0 mm/h)
Overall, the thermal behaviour is similar to that at the surface, except for the magnitude of cooling which is reduced, and for a shift in maximum values relative to the end of the day phase due to thermal diffusivity. In addition, no temperature spikes are visible. Again, ΔTmaxdry-wet is presented in Table 4 and plotted in Figure 8.
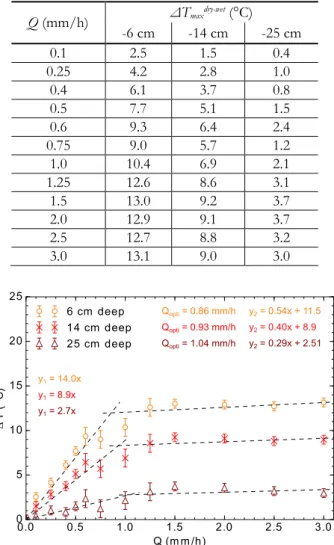
Table 4: Maximum temperature reductions 6 cm, 14 cm and 25 cm deep with regard to the dry trial for each rate
Q (mm/h) ΔTmaxdry-wet (°C) -6 cm -14 cm -25 cm 0.1 2.5 1.5 0.4 0.25 4.2 2.8 1.0 0.4 6.1 3.7 0.8 0.5 7.7 5.1 1.5 0.6 9.3 6.4 2.4 0.75 9.0 5.7 1.2 1.0 10.4 6.9 2.1 1.25 12.6 8.6 3.1 1.5 13.0 9.2 3.7 2.0 12.9 9.1 3.7 2.5 12.7 8.8 3.2 3.0 13.1 9.0 3.0
Figure 8: Difference between non-watered and watered maximum in-depth temperatures ΔTmaxdry-wet 6 cm, 14 cm and 25 cm deep as a function of the watering rate. Best double piecewise fits for both regimes and each depth are illustrated with dashed lines.
0 5 1 0 1 5 2 0 2 5 Du rat ion (h ) Dry 0 .1 m m /h 0 .2 5 m m /h 0 .5 m m /h 0 .7 5 m m /h 2 .0 m m /h 3 .0 m m /h 0 5 1 0 1 5 2 0 2 5 Du rat ion (h ) 3 0 4 0 5 0 6 0 T e m p e ra tu re ( °C ) Dry 0 .1 m m /h 0 .2 5 m m /h 0 .5 m m /h 0 .7 5 m m /h 2 .0 m m /h 3 .0 m m /h 0 5 1 0 1 5 2 0 2 5 Du rat ion (h ) Dry 0 .1 m m /h 0 .2 5 m m /h 0 .5 m m /h 0 .7 5 m m /h 2 .0 m m /h 3 .0 m m /h
Optimal reductions reach around 13°, 9° and 3°C respectively 6 cm, 14 cm and 25 cm deep. Similar values of the optimal watering rate are found, although slightly greater, especially for 25 cm deep. These provide a good range of values for estimating Qopti, i.e. between 0.8 and 1.0 mm/h.
3.3. In-depth conductive heat flux
Conduction heat-flows 6 cm and 14 cm deep are illustrated in Figure 9.
Figure 9: Conduction heat flux 6 cm deep (left) and 14 cm deep (right) for a dry and watered trials (0.1, 0.25, 0.5, 0.75, 2.0 and 3.0 mm/h) At both depths, significant heat absorption (positive values) is exhibited during the day phase, while heat release (negative values) is observed during the night. Unlike temperature signals 6 cm deep, watering heat flux spikes are still visible for the two lowest rates, i.e. 0.1 mm/h and 0.25 mm/h, with an approximate ten-minute delay with respect to water sprinkling. However, spikes are completely dampened for higher rates and for 14 cm deep temperature.
As can be seen, during the day phase, the heat flow signal slope is unchanged by watering, similarly to field observations of pavement-watering [Hendel 2015]. This lends credibility to the hypothesis made that watering does not influence the heat transfer process, i.e. that ΔQ is unchanged 6 cm deep, as assumed in equation (16). Following the method of section 2.3, ΔVzdry-wet the heat flux average difference between a non-watered and a
watered trial at depth z, , was characterized against the watering rate and is illustrated in Figure 10. Error bars are estimated by taking into account the initial value of the conduction heat flow and the standard deviation of the difference between dry and watered signals on the 8h-time window used to compute the average. For 6 cm deep, this quantity is the same as for equation (16). Reductions of 120 and 65 W/m² are exhibited 6 cm and 14 cm deep respectively, for rates greater than Qopti. This compares well with field observations where reductions between 100
and 150 W/m2 were observed 5 cm deep [Hendel 2015].
0 5 10 15 20 25 Durat ion (h) -50 0 50 100 150 200 250 H e a t fl u x ( W /m ²) Dry 0.1 m m /h 0.25 m m /h 0.5 m m /h 0.75 m m /h 2.0 m m /h 3.0 m m /h
Figure 10: Average day-phase difference between dry and watered conduction heat flux to watering rate, for 6 and 14 cm deep signals.
3.4. Atmospheric convective heat flux
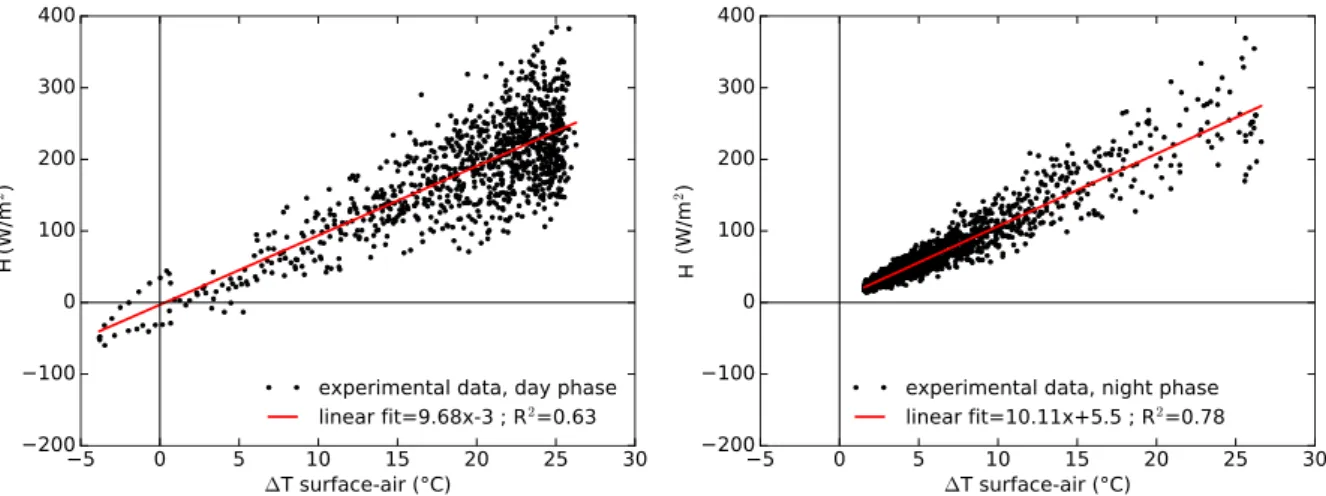
Following the method presented in Section 2.3, we now address the assessment of the atmospheric heat flux H. It is determined for a non-watered trial using equation (12). It is illustrated in Figure 11 as a function of Ts – Ta, the
difference between surface and air temperature.
Figure 11: Convective heat flux during the day phase (left) and the night phase (right), both fitted using a linear regression. A linear regression was performed on both datasets for day and night phases following equation (14), with h being the slope of the regression. Very similar values were found for day and night phases, namely 9.7 and 10.1 W/(m².K), respectively. These values are coherent considering natural convection and are similar to what was observed in the field for heat-wave like conditions (i.e. 3.5 vs 10 W/(m².K) here) [Hendel 2015]. It is also noteworthy that any error in the value of incident radiation (S+L) only creates an upwards or downwards shift in the data (intercept), but no change in slope. In other words, a non-zero intercept elegantly indicates inaccuracies in the measurement of incident radiation, without affecting the convective heat transfer coefficient.
3.5. Stored and released energy
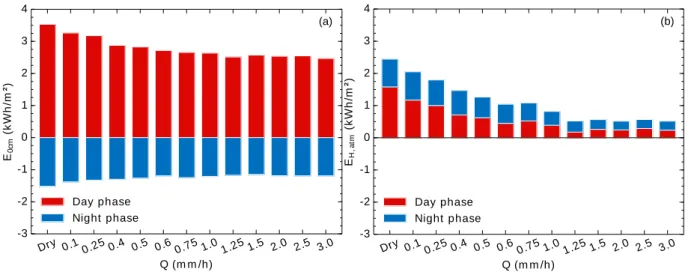
We now look at heat storage and release in terms of energy, for both pavement conduction and convection. On the one hand, pavement surface conduction energy density, E0cm, is obtained by integrating V0cm, using relationship V0cmwet = V0cmdry – ΔV-6cmdry-wet for watered trials. Positive values of V0cm (day phase) indicate storage, while negative
(i.e. night phase) indicate heat release. On the other hand, atmospheric convective energy density, EH, atm, is equal
is set to 35°C), this energy is almost continually released to the atmosphere regardless of the considered phase, meaning that the material has a negative impact on thermal comfort. Both E0cm and EH, atm are illustrated in Figure
12.
Figure 12: Stored (day phase) and released (night phase) pavement surface conduction energy density, E0cm (a), and released (day and night phases) atmospheric convective energy density, EH, atm (b), to watering rate.
From Figure 12, it is clear that the asphalt structure stores much more conductive energy that it is able to release, even for watered trials, and even though the night phase is twice as long as the day phase. For high watering rates, a reduction of up to about 1 kWh/m² is exhibited during the day phase, and up to 0.3 kWh/m² during the night phase. Those values correspond to a 28% and 21% reduction of stored and released energy, respectively.
As seen in Figure 12 (b), both day and night contributions to convective heat release are significantly reduced by watering, although it is only conducted during the day phase. Also, we observe that released atmospheric convective energy is 3.2 to 23 times (dry test to highest watering rate, respectively) smaller than absorbed net radiation energy. Besides, with watering, convective exchanges are reduced up to 70-85% during day phase and up to 40-68% during night phase compared to a dry test. Thus, pavement-watering has a much stronger impact on the atmospheric convective exchanges that it has on conductive storage.
3.6. Evaporative cooling flux
We now focus on the total pavement cooling flux Ф, calculated from equation (13). Having determined h and assuming that it is constant during the day regardless of the watering rate, ΔHdry-wet is obtained immediately using
equation (14). ΔV0cmdry-wet has already been calculated using equation (16) and was plotted in Figure 10 for 6 cm
deep. ΔRndry-wet is obtained with equation (17). In wet conditions, the emissivity of the surface, εw, is that of water,
equal to 0.98. Dry emissivity, εd, and albedo difference Δα in both conditions were measured experimentally and
are presented in Table 1. All three contributions and Ф are illustrated in Figure 13 at the end of day phase. Error bars were estimated by propagating the sources of error on the calculation of Ф from equation (13). Results of the piecewise regression are also indicated in Figure 13 (b).
Dry 0.1 0.25 0.4 0.5 0.6 0.75 1.0 1.25 1.5 2.0 2.5 3.0 Q (m m /h) -3 -2 -1 0 1 2 3 4 E0 cm (k W h /m ²) Day phase Night phase (a) Dry 0.1 0.25 0.4 0.5 0.6 0.75 1.0 1.25 1.5 2.0 2.5 3.0 Q (m m /h) -3 -2 -1 0 1 2 3 4 EH ,a tm (k W h /m ²) Day phase Night phase (b)
Figure 13 : Net radiation dry-wet difference ΔRndry-wet, absorbed surface heat flux dry-wet difference ΔV0cmdry-wet and convective heat flux dry-wet difference ΔHdry-wet (a), and pavement cooling flux Ф (b) to watering rate Q at the end of day phase. A double linear piecewise
regression with zero-intercept is used on Ф (b) (dashed lines).
In Figure 13(a), ΔRndry-wet strongly decreases with Q, i.e. net radiation increases as a result of watering. On the
contrary, pavement conduction and convective exchanges are both reduced by watering, as seen by the increase of ΔV0cmdry-wet and ΔHdry-wet. Indeed, for a given watering rate, pavement cooling is partitioned into a reduction of
atmospheric convective exchanges (38% of Φ) and of pavement conduction (24%) and an increase in net radiation (38%). Given the importance of convective exchanges and upward radiation on the negative impact of pavements on pedestrians during the day, it is very interesting to find that these terms are the most impacted by watering. The significant reduction of pavement conduction is also noteworthy since it mostly affects heat release during the night, thus limiting the night time heat release and therefore the pavement’s contribution to UHI.
In Figure 13(b), compared with Figure 6, the overall shape of Ф is comparable and a similar value for Qopti is found.
Pavement cooling ranges from 160 to 550 W/m² during these trials, reaching about 500 W/m² for Qopti. It should
be noted that for small rates, since the surface does not remain wet throughout the experiment, Ф corresponds to an average value. In reality, it oscillates between a maximum and a zero value.
We finally take interest in determining the maximum evaporation rate under our experimental conditions. First, sensible and latent contributions of the cooling flux were assessed using equation (4). The sensible part is given by Фsens = cQ(Tswet – Tw). Each term of the latter equation is known and the maximum surface temperature at the end
of day phase was taken for Tswet. The latent flux, lE, is then obtained by subtracting the sensible flux Фsens from the
total cooling flux Ф. Both Фsens and lE are presented in Figure 14.
Figure 14: Latent and sensible cooling flux, lE and Фsens respectively, to watering rate.
0.0 0.5 1.0 1.5 2.0 2.5 3.0 Q (m m /h) 0 100 200 300 400 500 600 C o o li n g f lu x ( W /m ²)
Lat ent cooling flux Sensible cooling flux
y1 = 624x
As expected, the sensible cooling flux only represents a few tens of W/m², whereas the latent flux reaches up to 500 W/m2. In other words, more than 95% of total cooling is exclusively due to the evaporation of the water film.
Finally, the evaporation rate E determined with this method is confronted with that obtained from the mass convection transport problem (MCTP). Derived from Pagliarini [2011], the evaporation rate can be estimated from the latent cooling flux, which is:
𝑙𝐸 = 0.622 𝑙ℎ 𝐶𝑝,𝑎𝑖𝑟 𝑝0𝑇𝑠 𝑤𝑒𝑡( 𝑝𝑠 𝑇𝑠𝑤𝑒𝑡− 𝑝𝑣 𝑇𝑎𝑤𝑒𝑡) (18)
with h the convective exchange coefficient, calculated in section 3.4, cair the specific heat of air (1.005 J/(g.K)), p0, ps and pv respectively total air pressure, saturation vapour pressure at Tswet and partial vapor pressure at Tawet equal
to 35°C whether wet or dry in our case. Results are illustrated in Figure 15.
Figure 15: Evaporation rate of the water-film sprinkled during the day phase as a function of the watering rate.
It should be noted that the mass convection transport problem described in equation (18) is not valid for small watering rates during which evaporation is not continuous. For this reason, concerned data points were marked grey and labelled as “invalid” on Figure 15.
As can be seen, E is approximately equal to the watering rate, i.e. all sprinkled water is evaporated, until Qopti. For
higher watering rates, additional water does not evaporate, i.e. the maximum evaporation rate has been reached. This value is consistent with previous estimates of Qopti obtained from surface temperatures and the total cooling
flux Ф (around 0.8 mm/h). On the other hand, EMCTP reaches a maximum value of 1.15 mm/h from about
0.75 mm/h i.e. once the surface remains wet, although E is not calculated from the watering rate values. This value is close to the one found with the other method, although slightly greater. It is however similar to the values found using in-depth temperature in section 3.2. No overlap is found between the error bars, which could indicate either an underestimation of the uncertainties, more likely for pvwhich outweigh the other terms, and/or to a lesser
extend h, ps, or inaccuracies in the estimation of one of these term. Indeed, relative humidity strongly oscillates
inside the chamber, which impacts the value of pvsignificantly.Ultimately, the maximum evaporable quantity of
water using this method was found, which is useful to know how much water should be sprinkled on the surface.
4. Discussion
We now compare results from this experimental set-up with field observations obtained in Paris since 2013 under similar weather conditions [Hendel, 2015; Hendel2014], summarized in Table 5. Values may not add up due to rounding errors. The structures studied in the field and in the lab are similar in composition though not identical. In the field, the sensor was placed after road construction, requiring excavation and filling. This required replacing
y1 = 0.95x y2 = 0.05x + 0.76 0.0 0.5 1.0 1.5 2.0 2.5 3.0 Q (m m /h) 0.5 1.0 1.5 2.0 2.5 3.0 E (m m /h ) E = Q
EM CTP(inv alid dom ain)
EM CTP
the mid-course at the location of the sensor was a 34-cm-thick concrete layer. This was later explained by the presence of a district-heating main. Other areas located nearby, not above the heat district main, had a normal, asphalt concrete mid-course. These differences were found to be responsible for an increase of surface temperature of up to 2°C at night with similar thermal behaviour [Hendel 2014].
Regarding the surface finish, it is expected that the field material should be smoother as a result of aging due to traffic, although this should only affect the water retention capacity of the surface, which doesn’t impact lab results. All else being equal, these differences are likely to induce additional errors in the transposition of lab results to the field.
Table 5: Confrontation of our results with field observations [Hendel, 2015] for optimal watering rates found in both cases.
Quantity of interest Unit Hendel (2015) Lab experiment
Total daytime absorbed radiation (dry conditions),
∫day R
n dt kWh/m² 2.5 - 3.3 5.1
Surface and air temperature difference (dry
conditions), Ts – Ta °C 10 - 15 25
Optimal evaporation rate mm/h 0.31 - 0.41 0.78 - 0.81
Pavement-watering sensible cooling, Фsens W/m² 4 - 7 5 - 10
Pavement-watering latent cooling, lE W/m² 198 - 256 470 - 500
Proportion of cooling due to evaporation % 80 - 85 95
Maximum surface temperature reduction, ΔTmax °C 3 pm to 6:30 pm) 13 (average from 20 - 21
Sprinkled water temperature °C 20 - 25 35
Convective heat transfer coefficient, h W.m-2.K-1 3.5 10
Reduction in atmospheric convection, ΔHdry-wet W/m² 40 180 - 200
Reduction in pavement conduction , ΔV0cmdry-wet W/m² 70 - 130 (-5cm) 110 (-6cm)
Grey-body emitted radiation increase,
σ(εwetTswet 4 – εdryTsdry 4) W/m² 85 160
Reflected infrared radiation reduction,
(εdry – εwet)L W/m²
assumed
negligible 2
Reflected visible radiation increase,
(αwet – αdry)S W/m²
assumed
negligible 35
Increase in net radiation, ΔRndry-wet W/m² 85 180 - 190
Compared to the field experiment, an approximate factor of two is observed for almost every parameter in the lab, except for the watering sensible cooling flux Φsenswhich is comparable. This is because only 5 % of cooling is due to Φsens in our case vs 20 % in the field. This can be at least partially explained because water sprinkled in our case
is initially hotter (35°C against 20-25°C) and the harsher conditions resulting in a higher maximum evaporation rate, all else being equal.
Surface temperature reductions are greater in the lab, which is consistent with the higher dry surface temperatures (respectively 62°C vs 50-55°C). This holds true for the latent cooling flux as well which is approximately twice as high as in the field. This can be understood when having a look at each term contributing to total cooling flux Φ detailed in equation (13), i.e. ΔHdry-wet, ΔV
0cmdry-wet and ΔRndry-wet.
First, the reduction in convective exchange ΔHdry-wet happens to be about 4 to 5 times greater than in the field. This is attributed to both a higher surface temperature reduction, i.e. approximately twice as much, and also to the higher convective heat transfer coefficient h, three times greater than in the field (3.5 vs 10 W.m-2.K-1). This is
associated with differences in wind speed between the lab and the field, even though the circulation conditions inside the climate chamber are satisfactory with heat-wave conditions (typically v <10 km/h). Indeed, h is strongly
taken into account in the calculation of h (10 W.(m².K)-1). Similarly, h was calculated from field measurements
[Hendel 2015].
On the other hand, the reduction in pavement conduction ΔV0cmdry-wet is similar despite the difference in measurement depth (5 cm deep in the field vs 6 cm deep here). In both cases, the pavement heat flux 5/6cm deep
V-6cmis halved by watering.
Also, the increase in grey-body radiation is also found to be two times greater than in the field, mostly because the surface temperature reduction is significantly greater in the lab than in the field. Finally, the changes in reflected SW and LW radiation were both neglected in Hendel [2015]. This results in an additional 33 W/m² in the total net radiation increase, ΔRndry-wet, which is doubled in total.
These differences between lab and field observations can be explained by the stronger radiation inside the climate chamber. Although Rn is quite similar in terms of average value, i.e. approximately 650 W/m², artificial insolation
in the lab is constant and lasts twice as long resulting in twice the amount of daily absorbed radiation. Also, air temperature is set to 35°C and relative humidity 35% during the day, while weather conditions for in-field campaigns are variable. Nonetheless, checking the difference between surface and air temperatures in dry conditions, also much greater in the lab than in the field (25 vs 10-15°C), confirms that the air temperature is not the main parameter influencing our results rather than the daily absorbed radiation, for instance. These conditions imply that the laboratory experiment approaches steady-state conditions at the surface at the end of the day phase, which is not the case in the field.
Surface cooling effects are partitioned into a reduction of convective exchanges (38% of surface cooling), of pavement conduction (24%) and an increase in net radiation (38%). All three of these components have positive implications for pedestrian thermal stress and the UHI phenomenon. Indeed, pavement energy storage (day) is reduced by 28% which in turn reduces heat release (night) by 21%, an important parameter in the formation of UHI. Furthermore, released atmospheric convection is reduced up to 70% during the day phase and up to 50% during the night phase compared to a non-watered test, even though watering was only performed during the day. This contributes to lower air temperatures in the immediate vicinity of the watered pavement. Finally, the increase in net radiation by 30% is also positive for pedestrians since it tends to alleviate their radiative budget by reducing the contribution from the pavement.
In the aim of transposing lab results to the field, it would seem that total daily absorbed radiation is an appropriate normalizing factor. Indeed, the comparison of lab and field results illustrates that all surface heat budget terms are more or less doubled, as per daily absorbed radiation. This parameter includes information on the past conditions underwent by the pavement in both the lab and the field, thus taking account of the non-steady state thermal conditions. This would provide a first approach for transposing lab results to the field, whether for asphalt or other materials, in particular with respect to their implications in terms of an appropriate pavement-watering strategy. Further testing in the field and lab is necessary to confirm this.
5. Conclusion
A laboratory experiment was used to optimise the cooling effects and water consumption of pavement watering on a Parisian asphalt road structure that underwent a 24-hour climatic cycle of heat-wave-like conditions for several watering rates. Significant surface temperature reductions were exhibited, ranging from 5° to 22°C respectively for watering rates from 0.1 to 3.0 mm/h, while reductions of pavement conduction ranged from 30 to 120 W/m² and from 150 to 550 W/m² for total pavement cooling. These results suggest that this lab experiment faithfully reproduces the effects of pavement-watering when accounting for the difference in daytime net radiation. Two distinct pavement-watering cooling regimes are observed: latent and sensible. In the latent phase, evaporation increases one-to-one with watering; in the sensible regime, only a limited increase in cooling is obtained from additional watering. The intersection of these two regimes corresponds to the point for which cooling effects are
this value is equal to the maximum evaporation rate under the prevailing conditions. With this approach, an optimal watering rate of approximately 0.8 mm/h was obtained from all indicators, thus building up a body of evidence converging towards this value. Accounting for the difference in daytime net radiation, good agreement was found with previous field results.
For a 0.8 mm/h watering rate, temperatures were significantly reduced (respectively by about 20°, 10°, 7° and 2°C for surface and 6, 14 and 25 cm deep). Pavement heat flux is reduced by about 110 W/m². Evaporative cooling flux was calculated and found to be up to 400 W/m² for the latent part and 20 W/m² for the sensible part, both for 0.8 mm/h. This cooling effect is partitioned into a reduction of atmospheric convective exchanges (38% of surface cooling), of pavement conduction (24%) and an increase in net downward radiation (38%), each of which contribute to improving the urban environment.
In case of the implementation of an outdoor watering campaign, the optimal watering rate could be estimated by normalizing lab results by net daytime radiation. However, field experimentation also poses other strong technical and operational constraints that draw the limits of this approach. Because of road curvature and other factors not reproduced in the lab including runoff, the retention capacity of the pavement should be considered in order to sprinkle no more than the amount of water a surface is able to hold, i.e. its surface roughness. Thus by adjusting the frequency between each cycle, the optimal watering rate can be achieved. Also, the question of the appropriate infrastructure dedicated to watering remains unresolved. In our case, by setting the watering rate, the watering frequency of the cleaning trucks is defined. Yet, this parameter is a major source of constraints as the filling of the water tanks can be long, thus potentially compromising the technical feasibility of the method. In any case, the validity of these hypotheses will be tested during future in situ watering campaigns on alternative pavements, currently being prepared by the City of Paris and whose first implementation is planned as soon as for 2019. Further lab testing will investigate the effects of pavement-watering on other Parisian structures in order to determine the method’s effectiveness on each paving material. Finally, innovative street materials will be considered, such as permeable structures enabling water storage near the surface, both relevant to allow evaporation and to absorb large amounts of water, thus permitting the decrease of the frequency between cycles without changing the cooling efficiency.
Acknowledgments
The authors are grateful the Roads and Traffic and the Waste and Water Divisions of the City of Paris for their significant time, expertise and material support. Funding for this study was provided by APUR (Parisian urban planning agency) and the Water and Sanitation Department of the City of Paris. The authors would also like to acknowledge Agnès Maître and Willy Daney de Marcillac at INSP UMR 7588 at Sorbonne Université for the use of their Cary 5 UV-Vis-NIR spectrophotometer and their technical assistance.
References
H. Akbari, M. Pomerantz, and H. Taha, “Cool surfaces and shade trees to reduce energy use and improve air quality in urban areas,” Sol. Energy, vol. 70, no. 3, pp. 295–310, Jan. 2001.
T. Asaeda, V. T. Ca, and A. Wake, “Heat storage of pavement and its effect on the lower atmosphere,” Atmos. Environ., vol. 30, no. 3, pp. 413–427, Feb. 1996.
Bouvier, M., A. Brunner, and F. Aimé. “Nighttime watering streets and induced effects on the surrounding refreshment in case of hot weather. The city of Paris experimentations”. Techniques Sciences Méthodes (12), 43–55, 2013 (in French).
D. E. Bowler, L. Buyung-Ali, T. M. Knight, and A. S. Pullin, “Urban greening to cool towns and cities: A systematic review of the empirical evidence,” Landsc. Urban Plan., vol. 97, no. 3, pp. 147–155, Sep. 2010.
Daniel, M., Lemonsu, A., & Viguie, V, “Role of watering practices in large-scale urban planning strategies to face the heat-wave risk in future climate”, Urban Climate, 2016
L. Doulos, M. Santamouris, and I. Livada, “Passive cooling of outdoor urban spaces. The role of materials,” Sol. Energy, vol. 77, no. 2, pp. 231–249, Jan. 2004.
Du, H., Song, X., Jiang, H., Kan, Z., Wang, Z., Cai, Y., « Research on the cooling island effects of water body: a case study of Shanghai”, China. Ecol. Indic. 67, 31e38, 2016.
E. Erell, D. Pearlmutter, D. Boneh, and P.B. Kuttel, “Effect of high-albedo materials on pedestrian heat stress in urban street canyons,” Urban Clim., Oct. 2013.
S. Grimmond, "Urbanization and global environmental change: local effects of urban warming." Geographical Journal, 173.1, 83-88, 2007.
M. Hendel, M. Colombert, Y. Dxiab, and L. Royon. (2014). Improving a pavement-watering method on the basis of pavement surface temperature measurements. Urban Climate, 10(December), 189–200, 2014.
M. Hendel, M. Colombert, Y. Diab, and L. Royon, “An analysis of pavement heat flux to optimize the water efficiency of a pavement-watering method,” Appl. Therm. Eng., vol. 78, pp. 658–669, Mar. 2015.
M. Hendel, P. Gutierrez, M. Colombert, Y. Diab, and L. Royon, “Measuring the effects of urban heat island mitigation techniques in the field: Application to the case of pavement-watering in Paris,” Urban Clim., vol. 16, pp. 43–58, Jun. 2016.
Hendel, M., Grados, A., & Royon, L. . Fine tuning pavement-watering to urban paving materials: a laboratory approach. In Fourth International Conference on Countermeasures to Urban Heat Islands. May 30th - June 1st, Singapore, 2016b.
M. Hendel, A. Grados, and L. Royon, “Caractérisation du comportement de revêtements urbains soumis à arrosage urbain,” in Congrès Français de Thermique 2016, 2016c.
M. Hendel, S. Parison, A. Grados, K. Jurski, and L. Royon, “Comportement thermique des revêtements urbains soumis à arrosage urbain,” in XIIIe Colloque Inter-universitaire Franco-Québecois, 2017, (In French).
M. Hendel, S. Parison, A. Grados and L. Royon, “Which pavement structures are best suited to limiting the UHI effect? An experimental laboratory approach,” Building and Environment, p. under review, 2018.
W. Jürges, “Heat transfer on a flat wall,” Beihefte zum Gesundheits-Ingenieur, vol. 19, no. 1, pp. 1227–1249 (in German), 1924
T. Kinouchi and M. Kanda, “An Observation on the Climatic Effect of Watering on Paved Roads,” J. Hydrosci. Hydraul. Eng., vol. 15, no. 1, pp. 55–64, 1997.
A. Lemonsu, R. Kounkou-Arnaud, J. Desplat, J. L. Salagnac, and V. Masson, “Evolution of the Parisian urban climate under a global changing climate,” Clim. Change, vol. 116, no. 3–4, pp. 679–692, Jul. 2013.
Li, H., J. Harvey, and D. Jones (2013, December). Cooling Effect of Permeable Asphalt Pavement Under Dry and Wet Conditions. Transportation Research Record: Journal of the Transportation Research Board 2372(-1), 97–107
Li, H. (2015). A comparison of thermal performance of different pavement materials. In Eco-Efficient Materials for Mitigating Building Cooling Needs (pp. 63-124).
A. Mohajerani, J. Bakaric & T. Jeffrey-Bailey, “The urban heat island effect, its causes, and mitigation, with reference to the thermal properties of asphalt concrete”, Journal of environmental management, 197, 522-538, 2017
C.J.G. Morris, I. Simmonds, N. Plummer, “Quantification of the influences of wind and cloud on the nocturnal urban heat island of a large city”, J. Appl. Meteorol. 40 (2), 169e182, 2001.
Pagliarini, G., and S. Rainieri. "Dynamic thermal simulation of a glass-covered semi-outdoor space with roof evaporative cooling." Energy and Buildings 43.2-3 (2011): 592-598.
S. Parison, M. Hendel, K. Jurski, and L. Royon, “The Impact of Different Watering Strategies on the Cooling Effects of Pavement-Watering during Heat-Waves,” in PLEA 2017 Proceedings - Design to Thrive, 2017, pp. 120–127.
S. Parison, M. Hendel, A. Grados, K. Jurski, and L. Royon, “Rafraîchissement de revêtements urbains par arrosage,” in Congrès Français de Thermique 2017 : Thermique, Mers et Océans, 2017b.
Y. Qin and J. E. Hiller, “Understanding pavement-surface energy balance and its implications on cool pavement development,” Energy Build., vol. 85, pp. 389–399, Dec. 2014.
Qin, Yinghong. "A review on the development of cool pavements to mitigate urban heat island effect." Renewable and sustainable energy reviews 52 (2015): 445-459.
J.M. Robine, S.L.K. Cheung, S. Le Roy, H.Van Oyen, C. Griffiths, J.P. Michel, and F.R. Herrmann, “Death toll exceeded 70,000 in Europe during the summer of 2003,” C.R. Biol., vol. 331, no.2, pp. 171–178, Feb. 2008.
Santamouris, M., “Using cool pavements as a mitigation strategy to fight urban heat island - a review of the actual developments”, Renew. Sust. Energy Rev. 26, 224e240, 2013
B. Stone, JJ. Hess, and H. Frumkin, "Urban form and extreme heat events: are sprawling cities more vulnerable to climate change than compact cities?." Environmental health perspectives 118.10, 2010.
Synnefa, A., Karlessi, T., Gaitani, N., Santamouris, M., Assimakopoulos, D.N., Papakatsikas, C., 2011. Experimental testing of cool colored thin layer asphalt and estimation of its potential to improve the urban microclimate. Build. En- viron. 46 (1), 38e44
H. Takebayashi and M. Moriyama, "Study on surface heat budget of various pavements for urban heat island mitigation." Advances in Materials Science and Engineering (2012).
T. Ueno and K. Tamaoki, “Thermal Characteristics of Urban Land Cover by Indoor Lamp-Irradiation Experiment,” in The Seventh International Conference on Urban Climate, 2009, no. July, pp. 1–4.
H. Wu, B. Sun, Z. Li, and J. Yu, “Characterizing thermal behaviors of various pavement materials and their thermal impacts on ambient environment,” J. Clean. Prod., vol. 172, pp. 1358–1367, 2018.