HAL Id: hal-00302772
https://hal.archives-ouvertes.fr/hal-00302772
Submitted on 15 May 2007HAL is a multi-disciplinary open access
archive for the deposit and dissemination of sci-entific research documents, whether they are pub-lished or not. The documents may come from teaching and research institutions in France or abroad, or from public or private research centers.
L’archive ouverte pluridisciplinaire HAL, est destinée au dépôt et à la diffusion de documents scientifiques de niveau recherche, publiés ou non, émanant des établissements d’enseignement et de recherche français ou étrangers, des laboratoires publics ou privés.
Ground-based measurements of tropospheric and
stratospheric bromine monoxide above Nairobi (1° S,
36° E)
S. Fietkau, T. Medeke, A. Richter, N. Sheode, B.-M. Sinnhuber, F. Wittrock,
N. Theys, M. van Roozendael, J. P. Burrows
To cite this version:
S. Fietkau, T. Medeke, A. Richter, N. Sheode, B.-M. Sinnhuber, et al.. Ground-based measurements of tropospheric and stratospheric bromine monoxide above Nairobi (1° S, 36° E). Atmospheric Chemistry and Physics Discussions, European Geosciences Union, 2007, 7 (3), pp.6527-6555. �hal-00302772�
ACPD
7, 6527–6555, 2007 BrO measurements above Nairobi S. Fietkau et al. Title Page Abstract Introduction Conclusions References Tables Figures ◭ ◮ ◭ ◮ Back CloseFull Screen / Esc
Printer-friendly Version Interactive Discussion
EGU
Atmos. Chem. Phys. Discuss., 7, 6527–6555, 2007 www.atmos-chem-phys-discuss.net/7/6527/2007/ © Author(s) 2007. This work is licensed
under a Creative Commons License.
Atmospheric Chemistry and Physics Discussions
Ground-based measurements of
tropospheric and stratospheric bromine
monoxide above Nairobi (1
◦
S, 36
◦
E)
S. Fietkau1, T. Medeke1, A. Richter1, N. Sheode1,*, B.-M. Sinnhuber1, F. Wittrock1, N. Theys2, M. van Roozendael2, and J. P. Burrows1
1
Institute for Environmental Physics, University of Bremen, Bremen, Germany 2
Institut d’A ´eronomie Spatiale de Belgique, Brussels, Belgium *
now at: Departement of Atmospheric and Oceanic Science, McGill University, Montreal, Canada
Received: 14 March 2007 – Accepted: 3 May 2007 – Published: 15 May 2007 Correspondence to: S. Fietkau (fietkau@iup.physik.uni-bremen.de)
ACPD
7, 6527–6555, 2007 BrO measurements above Nairobi S. Fietkau et al. Title Page Abstract Introduction Conclusions References Tables Figures ◭ ◮ ◭ ◮ Back CloseFull Screen / Esc
Printer-friendly Version Interactive Discussion
EGU Abstract
Ground based observations of stratospheric and tropospheric bromine monoxide, BrO, from a multi axial differential optical absorption spectrometer, MAXDOAS, located at the UNEP/UNON site in Nairobi (1◦S, 36◦
E) are presented for the year 2003. Differ-ences in BrO slant column densities at 90◦ and 80◦ solar zenith angle retrieved from
5
the zenith-sky measurements are used to study stratospheric BrO. They show only small variations with season, as expected for the small seasonality in stratospheric Bry and NO2 in this region. A pronounced diurnal variation can be observed, the average value for the morning being 1.3×10¹⁴ molecules/cm2 and for the evening 1.5×10¹⁴ molecules/cm2. The measurements are compared with simulations from a
10
one-dimensional photochemical stacked box model which is coupled with a radiative transfer model to allow direct comparisons between the observations and the model calculations. In general the model reproduces the measurements very well. The dif-ferences in the absolute values are 15% for the evening and 20% for the morning which is within the limits of the combined uncertainties. Both seasonality and diurnal
15
variation are well reproduced by the model. A sensitivity study shows that inclusion of the reaction BrONO2+ O(3P) significantly improves the agreement between model calculations and measurements, indicating an important role of this reaction in the stratosphere near to the equator. Tropospheric BrO columns and profile information is derived from the combined results obtained in the different viewing directions for the
av-20
erage over several clear days. The resulting tropospheric BrO columns are in the range of 4–7.5×10¹²molecules/cm2which is significant but lower than in previous studies at mid and high latitudes. The vertical distribution of the tropospheric BrO peaks at about 3 km indicating the absence of local sources at this high altitude site.
ACPD
7, 6527–6555, 2007 BrO measurements above Nairobi S. Fietkau et al. Title Page Abstract Introduction Conclusions References Tables Figures ◭ ◮ ◭ ◮ Back CloseFull Screen / Esc
Printer-friendly Version Interactive Discussion
EGU 1 Introduction
Bromine species are well known to play an important role in ozone depletion in the stratosphere (WMO, 2002). The total amount of stratospheric inorganic bromine was estimated to be 18–21 ppt in 1999 from organic precursor measurements and from coincident measurements of bromine monoxide (BrO) (e.g. Pfeilsticker, 2000). Its
con-5
tribution to the total stratospheric ozone loss is estimated to be about 25%. As reported by the World Meteorological Organization in 2006 the global tropospheric burden of Br from the sum of methyl bromide and halons peaked in 1998 and has declined since (Montzka et al., 2003). By mid-2004, tropospheric Br was 0.6 to 0.9 ppt below the peak; the mean decline from 1998 to 2004 beeing between –0.1 and –0.15 ppt Br/yr.
10
The decline is solely the result of a decrease in global mixing ratios of methyl bromide, which declined at a mean rate of –0.24 ppt/yr from 1999 to 2004, or somewhat faster than expected (WMO, 2006).
In spite of their importance for stratospheric ozone depletion, there have been few measurements of the inorganic bromine compounds e.g. BrONO2, HOBr and BrCl,
15
the only exception being bromine monoxide (BrO). Both in situ and remote sensing measurements of BrO have been successful. Studies of BrO behaviour have been reported at high and middle latitudes using resonance fluorescence spectroscopy from aircraft (e.g., Brune et al., 1988,1989; Toohey et al., 1990; Avallone et al., 1995) and balloon (McKinney et al., 1997) and ground-based zenith sky UV-visible spectroscopy
20
(e.g., Arpag et al., 1994; Fish et al, 1995; Richter et al. 1999) and balloon-borne UV-visible spectroscopy (e.g., Pundt et al., 2002; Fitzenberger et al., 2000; Harder et al., 2000).
Zenith-sky measurements in mid-latitudes show a pronounced diurnal variation with larger BrO values in the evening than in the morning at twilight. This is explained by the
25
release of BrO from its reservoir species bromine nitrate, BrONO2, hypobromous acid, HOBr, and bromine chloride, BrCl, and the reaction of HOBr with O(3P) during daytime. Accounting for about half of the inorganic bromine in the lower stratosphere, BrONO2
ACPD
7, 6527–6555, 2007 BrO measurements above Nairobi S. Fietkau et al. Title Page Abstract Introduction Conclusions References Tables Figures ◭ ◮ ◭ ◮ Back CloseFull Screen / Esc
Printer-friendly Version Interactive Discussion
EGU
is the major bromine reservoir species. During sunset BrO is converted to BrONO2, a small amount reacts with ClO to form BrCl. Studies have shown that certain bromine reservoirs can take part in heterogeneous reactions on PSCs (Abbatt, 1994) and on sulfate aerosols. The most important of these reactions is hydrolysis of BrONO2 on aerosols and polar stratospheric clouds within the polar vortex, which releases HOBr.
5
As a result provided that sufficient amounts of particles are present HOBr is expected to be the most abundant bromine reservoir before sunrise. The seasonal variation of twilight BrO is characterised by larger values in winter than in summer. This is a consequence of a more efficient formation of BrONO2 and subsequently of HOBr as
a result of the higher amounts of stratospheric NO2 in summer. The main reason for
10
the seasonality of NO2 is the variation in day length and thus photolysis of the main reservoir species N2O5at mid-latitudes.
During the last years significant amounts of BrO were also observed in the tropo-sphere (e.g. Hausmann and Platt, 1994, Richter et al., 1998; Wagner and Platt, 1998; Stutz et al., 2002, van Roozendael et al., 2002; Bobrowski et al., 2003). Currently the
15
sources and sinks of the reactive bromine in the troposphere and their impact on atmo-spheric chemistry are not well understood, heterogeneous release from sea salt, short lived organic species and volcanic emissions being some possible sources. Several studies have shown a strong impact of enhanced BrO on ozone levels in the tropo-sphere, both in model calculations and in measurements (e.g. Kaleschke et al., 2004;
20
von Glasow et al., 2004).
In contrast to mid- and high latitudes, BrO measurements in tropical regions have so far been limited to relatively short campaigns (e.g. Gabriel et al., 2002, Leser et al., 2002). To improve on this situation, a permanent DOAS measurement station was set-up in 2002 in Nairobi (1◦S, 36◦
E) as part of the BREmian DOAS (Differential
25
Optical Absorption Spectroscopy) network of atmospheric Measurements (BREDOM). Measurements of BrO in the tropics are of significance because of the expected ab-sence of seasonality as result of the small variations of the NO2values during the year and the smaller impact of horizontal transport. As result of the high tropopause, the
ACPD
7, 6527–6555, 2007 BrO measurements above Nairobi S. Fietkau et al. Title Page Abstract Introduction Conclusions References Tables Figures ◭ ◮ ◭ ◮ Back CloseFull Screen / Esc
Printer-friendly Version Interactive Discussion
EGU
BrO columns are also expected to be generally smaller than in mid and high latitudes. This makes tropical measurements an important dataset for the sensitive validation of satellite measurements and atmospheric models.
BrO columns can also be measured from space by instruments such as GOME and SCIAMACHY, and the satellite data have been used for numerous studies (e.g.
Wag-5
ner et al., 2001; Richter et al., 1998). However, the diffuser plate used for irradiance measurements on the GOME instrument exhibits a time dependent interference pat-tern, which correlates with BrO. To compensate for this, GOME BrO measurements are usually normalised in low latitudes (Richter et al., 2002; van Roozendael et al., 2002) and as a result do not provide independent information in the tropics. Therefore
10
validation of satellite BrO measurements is not attempted here.
In this paper, the first full annual cycle of continuous ground-based zenith-sky mea-surements of stratospheric BrO at low latitudes is presented. To test our current un-derstanding of bromine chemistry, the measurements are compared with calculations of BrO slant column densities from a 1-D photochemical stacked box model which is
15
based on the SLIMCAT model from Chipperfield (1999), coupled with a radiative trans-fer model (Rozanov et al., 2001) to allow direct comparisons between the observed and modelled data. This provides an important low-latitude extension of the model-measurement comparisons reported in Sinnhuber et al. (2002). Furthermore, addi-tional data taken simultaneously to the zenith-sky measurements in horizon pointing
20
geometry are analyzed with a profile retrieval algorithm and the resulting tropospheric profiles and columns of BrO are discussed.
2 Instrument
A MAX (Multi-AXis)-DOAS instrument was used for the measurements in Nairobi. The instrument has a telescope with a moving mirror to enable not only measurements
25
in zenith-sky direction but also measurements of scattered light at multiple elevation angles (off-axis). For the Nairobi measurements the off-axis viewing directions of 4◦,
ACPD
7, 6527–6555, 2007 BrO measurements above Nairobi S. Fietkau et al. Title Page Abstract Introduction Conclusions References Tables Figures ◭ ◮ ◭ ◮ Back CloseFull Screen / Esc
Printer-friendly Version Interactive Discussion
EGU
7◦, 16◦ and 30◦ above the horizon are used. Two spectrometers take simultaneous
measurements in adjacent spectral ranges covering
a) 320–410 nm with a spectral resolution corresponding to a Full Width Half maxi-mum, FWHM, of 0.5 nm and,
b) 395–565 nm with a spectral resolution corresponding to a FWHM of 0.9 nm.
5
Here, only data from the UV instrument are considered. Details about the MAXDOAS instrument used in this study can be found in Wittrock et al. (2004).
The instrument is located at the United Nations campus, UNON, in Gigiri (1◦S,
36◦E), close to Nairobi. It was set-up with the support of the United Nations
Envi-ronmental Programme, UNEP, and the staff of the Ozone Secretariat. Gigiri is on the
10
edge of the city Nairobi, approximately 10 km from the centre of Nairobi. The region is a mixture of urban area and tropical vegetation. The off-axis angles measured by the system point in the South direction towards the city of Nairobi.
3 Data analysis
3.1 BrO slant column densities
15
For the analysis of the measured spectra the Differential Optical Absorption Spec-troscopy (DOAS) method is applied (Solomon, 1987, Platt, 1994). The fundamental principle being used in DOAS is the separation of high frequency from lower frequency features in the spectral domain. It separates the differential structures of the absorp-tion cross secabsorp-tions of the absorbers to obtain their integrated amount along the light
20
path. Since some of the absorbers have absorption structures in the same wavelength regions, all of the relevant absorbers have to be taken into account simultaneously. Mie and Rayleigh scattering on air molecules and aerosols as well as instrumental ef-fects are corrected by a polynomial. To account for rotational Raman scattering on air molecules, which is known as the Ring effect, an additional effective cross section, the
25
ACPD
7, 6527–6555, 2007 BrO measurements above Nairobi S. Fietkau et al. Title Page Abstract Introduction Conclusions References Tables Figures ◭ ◮ ◭ ◮ Back CloseFull Screen / Esc
Printer-friendly Version Interactive Discussion
EGU
the radiative transfer model SCIATRAN in a version that includes Rotational Raman scattering (Vountas et al., 1998). The relevant cross sections, σ, the polynomial and a reference spectrum, I0, usually taken at high sun are fitted to the logarithm of the measured spectra, I: ln I0(λ) I(λ) = X i σ′ i(λ)SCDi + X p apλp. 5
Here, λ is the wavelength, i the index of the respective trace gas and apare coefficients of the polynomial. This fitting algorithm yields the slant column density, SCD. For O3 and NO2 these can be converted into the vertical amount by means of an air mass factor, AMF:
AMF =SCD VCD.
10
The AMF is calculated by the radiative transfer model SCIATRAN (Rozanov et al., 2001) which includes full multiple scattering and has been evaluated in recent studies (e.g. Hendrick et al., 2006). For species having relatively small photochemical change between SZA of 80◦ and 90◦ this procedure is robust. However BrO amounts change
rapidly between these SZA. Significant uncertainties result in the determination of the
15
vertical column densities of BrO when the diurnal change of BrO (Fish et al., 1995) is not accurately accounted for. Therefore, for this study the difference in BrO slant column density (DSCD) between 90◦ and 80◦ SZA is preferred. The 90◦–80◦ SZA
range was chosen in several previous studies because this maximizes the sensitivity of the observations to the stratosphere at twilight (Solomon et al., 1987). In comparison
20
the tropospheric air mass factors are small in this range of SZA reducing the impact of tropospheric BrO.
In this study the fitting window from 344.7 nm to 359.0 nm is used for BrO. This wavelength region encompasses two absorption bands of BrO. Reference spectra of NO2, O3(at 221 K and 241 K), O4, HCHO, BrO and Ring are fitted to the atmospheric
25
ACPD
7, 6527–6555, 2007 BrO measurements above Nairobi S. Fietkau et al. Title Page Abstract Introduction Conclusions References Tables Figures ◭ ◮ ◭ ◮ Back CloseFull Screen / Esc
Printer-friendly Version Interactive Discussion
EGU
features caused by Mie and Rayleigh scattering. The spectral features due to the solar Fraunhofer lines are removed by using a Fraunhofer reference spectrum taken in the zenith direction on the same day around noon. To obtain the DSCDs the average of the slant column densities in the solar zenith angle (SZA) range from 89◦ to 92◦ is
calculated and then the reference slant column density at 80◦ (+/–2◦) is subtracted.
5
The accuracy of the measurements is estimated to about 20%.
3.2 Profile retrieval
To derive tropospheric vertical profiles and columns the profile retrieval algorithm BREAM (BREmian Advanced MAX-DOAS retrieval algorithm) is used (Wittrock, 2006). In a first step the aerosol extinction profile is calculated by using the oxygen dimer O4
10
(Wagner et al., 2004; Wittrock et al., 2004, Frieß et al., 2006). This is possible since the O4 profile can be calculated from the temperature and pressure profiles. The BREAM algorithm uses the radiative transfer model SCIATRAN to calculate O4 slant column densities based on meteorological data and an a priori aerosol extinction profile. After-wards in an iterative process the aerosol extinction profile is scaled in its total quantity
15
as well as in its structure until the measured and modelled slant column densities of O4are in agreement. In the second step of the algorithm block air mass factors of the selected absorber are calculated by SCIATRAN using the obtained aerosol settings. Block air mass factors are air mass factors for individual layer heights of the absorber. The overall air mass factor is simply the average of the block air mass factor weighted
20
by the distribution of the trace gas. This concept allows the description of the rela-tion between the measurements and the absorber profile as a linear system. To solve the linear system which is ill-posed, the Optimal Estimation method (Rodgers, 1976; Rodgers, 1990) is used in a third step. The output of the retrieval is the profile of the se-lected absorber. A more detailed description of the algorithm can be found in Wittrock
25
ACPD
7, 6527–6555, 2007 BrO measurements above Nairobi S. Fietkau et al. Title Page Abstract Introduction Conclusions References Tables Figures ◭ ◮ ◭ ◮ Back CloseFull Screen / Esc
Printer-friendly Version Interactive Discussion
EGU
3.3 Chemical model studies
The atmospheric simulations of the stratospheric BrO calculated within this study use a 1D photochemical stacked box model (henceforth 1D model). This is based on the photochemical scheme from the SLIMCAT model described in detail by Chipperfield et al. (1999). The model contains a comprehensive description of stratospheric Ox, NOx,
5
ClOx, BrOx, HOx and CHyOx oxidation chemistry. With a few exceptions which were described by Sinnhuber et al. (2002) the model calculations use the photochemical reaction rate constants and photolysis cross-sections from the NASA/JPL compilation (Sander et al., 2003). It has 21 levels ranging from about 870 to 0.02 hPa (an altitude range from about 2 to 80 km). The model was initiated with the output of a global 2-D
10
chemistry, transport and photochemistry model. The 2-D model is described in more detail by Sinnhuber et al. (2003) and references therein. Temperature and pressure are from the ECMWF.
For the study shown here all of the species in the model were integrated separately using a 5 minute time step. A series of model experiments at the 15th of each month
15
at latitude of 1.27◦S were performed. Two runs with different meteorological input data
were made, one using climatological and the other using ECMWF data for the year 2003. A third run using the ECMWF data includes the reaction BrONO2 + O(3P) -> BrO + NO3.
To calculate BrO slant column densities from the modelled BrO the radiative transfer
20
model SCIATRAN is used. The model uses full spherical geometry and takes into ac-count multiple scattering and the variation of BrO with solar zenith angle along the slant path. The calculations were made for a wavelength of 350 nm, the centre wavelength of the fitting window used.
ACPD
7, 6527–6555, 2007 BrO measurements above Nairobi S. Fietkau et al. Title Page Abstract Introduction Conclusions References Tables Figures ◭ ◮ ◭ ◮ Back CloseFull Screen / Esc
Printer-friendly Version Interactive Discussion
EGU
4 Results and discussion
4.1 Stratospheric BrO
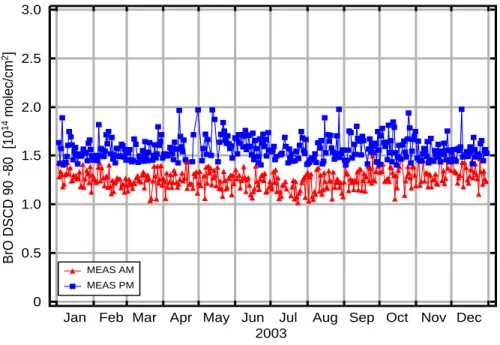
The stratospheric BrO DSCDs over Nairobi for the year 2003 are presented in Fig. 1. This plot shows the variation of the morning AM 90◦–80◦DSCD and the afternoon PM
90◦–80◦ DSCD. It can be seen that the afternoon values are higher than the morning
5
values. Any seasonal variation in the AM and PM values is small relative to the errors. The AM-PM differences (Fig. 2) are explained by the release of BrO from BrONO2and
HOBr during the day and formation of the reservoir species at night.
As mentioned above the seasonal variation of BrO is most likely controlled by the seasonal variation of NO2 as a result of the formation of the reservoir BrONO2 and
10
transport of Br containing precursors into the stratosphere from the troposphere. As shown in Fig. 3, no strong seasonal variation of NO2 is observed over Nairobi where day length varies only slightly over the year. This in combination with the constant Br input explains the lack of seasonality in the BrO DSCDs.
The absolute values of the BrO DSCD are about 1.5×10¹⁴ molecules/cm2 for the
15
evening and about 1.3×10¹⁴ molecules/cm2 for the morning which is in the same or-der of magnitude as for measurements at mid- and high latitude sites. Measurements above Bremen (53◦N) by Richter et al. (1999) show a pronounced seasonal variation
with DSCDs of up to 1.9×10¹⁴ molecules/cm2 in winter and 0.5×10¹⁴ molecules/cm2 in summer. A similar seasonality of BrO was observed by Schofield et al. (2004) over
20
Lauder (45◦S), the stratospheric BrO columns reported in this study ranging from 1.5
to 3×10¹³ molecules/cm2. BrO DSCDs from 22 January to 24 May 1993 over Col-orado (40◦
N) were reported by Arpag et al. (1994). They used a different instrument setup than the measurements in Bremen and Nairobi. The telescope was first pointed at an 80◦ angle relative to the zenith towards the setting sun and was in April
re-25
orientated towards the east. The values of the BrO DSCDs ranged from 0.8 to 1.8×10¹⁴ molecules/cm2but no seasonal variation was observed. Recent measurements at the tropical Station Reunion-Island (21◦S) also show no seasonal variation, in agreement
ACPD
7, 6527–6555, 2007 BrO measurements above Nairobi S. Fietkau et al. Title Page Abstract Introduction Conclusions References Tables Figures ◭ ◮ ◭ ◮ Back CloseFull Screen / Esc
Printer-friendly Version Interactive Discussion
EGU
with this study (Theys et al., 20071).
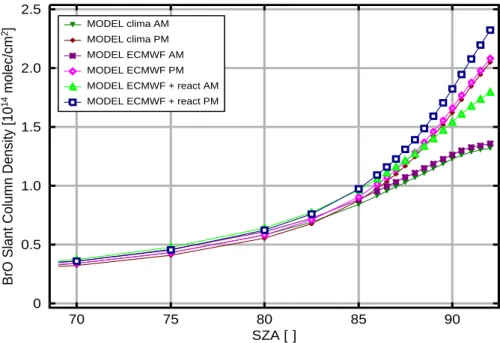
For the comparison of measured and modelled data different model runs were per-formed. The first run used climatological data as meteorological input. Figure 5 shows DSCDs of the model for all months in comparison with the measurements. For the measurements the monthly mean is presented. The seasonal and the diurnal
varia-5
tion are well captured by the model. However, the observed BrO DSCDs are higher than the DSCDs for the run with climatological data by about 4×10¹³ molecules/cm2 (25%) in the evening and 6×10¹³ molecules/cm2 (45%) in the morning. To test if the use of the climatological data instead of meteorological data of the year 2003 could be a reason for the differences, a second run using ECMWF data of 2003 as input was
10
performed. Both the slant column densities of the calculated stratospheric BrO (Fig. 4) and the DSCDs show no significant difference when the climatological or the ECMWF data are used in the calculation.
As investigated by Soller et al. (2001) the reaction of BrONO2 with O(3P) could be an important loss of bromine nitrate in the stratosphere, resulting in increased
concen-15
trations of BrO during daytime. Due to the low concentrations of O(3P) the influence is small in the lower stratosphere but dramatically increases above an altitude of 20 km. If the reaction BrONO2 + O(3P) -> BrO + NO3is included in the calculations the
val-ues of the slant column densities increases by about 20% in the morning and by about 10% in the evening (Fig. 4). This is in good agreement with the sensitivity studies
pre-20
sented by Sinnhuber et al. (2002) where similar results were obtained for mid-latitude situations. The difference of the BrO DSCDs between the modelled and observed data decreases to values of about 2×10¹³ molecules/cm2 (15%) in the evening and 3×10¹³ molecules/cm2 (20%) in the morning (Fig. 5). These differences are compa-rable to the mean differences for different latitudes that were found in the study of
25
Sinnhuber et al. (2002). There, differences ranged from 0.4×10¹³ molecules/cm2 to
1
Theys, N., Van Roozendael, M., Hendrick, F., et al.: Retrieval of stratospheric and tropo-spheric BrO columns from multi-axis DOAS measurements at Reunion Island, Atmos. Chem. Phys. Discuss., submitted, 2007.
ACPD
7, 6527–6555, 2007 BrO measurements above Nairobi S. Fietkau et al. Title Page Abstract Introduction Conclusions References Tables Figures ◭ ◮ ◭ ◮ Back CloseFull Screen / Esc
Printer-friendly Version Interactive Discussion
EGU
2.8×10¹³molecules/cm2for AM values and from 0.6×10¹³molecules/cm2to 3.2×10¹³ molecules/cm2 for PM values. Sensitivity studies by Sinnhuber et al. (2002) have shown that by varying the reaction rate constants within the given limits of the JPL reaction rate recommendations the BrO 90–80◦DSCD can change by up to 25%.
Con-sidering the fit errors of the measurements of about 20% the measurements and the
5
model calculations are in a good agreement. Even though the DSCD between 90◦and
80◦is weighted towards the stratospheric BrO parts of the differences could be related
to tropospheric BrO in the measurements as discussed below.
The model runs performed here are also consistent with a model calculation in the Sinnhuber et al. (2002) study that was made for the tropical site of Kaashidhoo (5◦N,
10
73◦E). Both sites don’t show seasonal variation, the PM/AM ratio for Kaashidhoo is 1.4
and for the Nairobi site ranging from 1.35 to 1.65. Because of the absence of useful BrO measurements at Kaashidhoo no comparison of modelled and measured BrO is available and no validation of the model in the tropics could be made in the Sinnhuber et al. (2002) study. The present study closes this gap with the Nairobi measurements.
15
The good agreement between model results and observations of Nairobi is in agree-ment with the results of Sinnhuber et al. (2002) indicating that the used model of the mechanisms controlling the stratospheric BrO is also valid for the tropical region.
4.2 Tropospheric BrO
While for the stratospheric observations only the zenith viewing direction is used
be-20
cause of its short light path through the troposphere, for tropospheric observations the measurements pointing to the horizon are useful. In good approximation, the light path through the stratosphere does not depend on the viewing direction, while in the lowest atmospheric layers the light path increases strongly as the viewing direction approaches the horizon. As the vertical sensitivity is a function of elevation angle the
25
combination of all measurements can be used to retrieve vertical profiles of absorber concentrations. If a sufficient amount of absorber is present in the troposphere a clear
ACPD
7, 6527–6555, 2007 BrO measurements above Nairobi S. Fietkau et al. Title Page Abstract Introduction Conclusions References Tables Figures ◭ ◮ ◭ ◮ Back CloseFull Screen / Esc
Printer-friendly Version Interactive Discussion
EGU
distinction between the slant column densities of the different viewing directions should be observable.
For the Nairobi BrO measurements this distinction proves to be difficult. On a single day, the differences between the slant column densities are small and not systematic. This is the result of the measurement uncertainty at these small absorptions and the
5
changing viewing conditions in the presence of clouds. From measurements of sin-gle days the profile retrieval used in this study was not able to calculate tropospheric profiles and columns.
To improve the signal to noise of the BrO slant column densities averaged slant column densities were calculated. For the period from January to March 2003 all days
10
with good weather conditions, altogether 29 days, were used. The resulting averaged slant column densities are shown in Fig. 6. In addition the slant column densities are averaged over 2.5◦ solar zenith angle bins in this figure. It can be seen that the slant
column densities for the different viewing directions have systematic differences with the smallest value in the zenith-viewing direction and a crossing of the results from
15
the different off-axis measurements at about 65◦ SZA. This indicates the presence of
BrO in the troposphere. The relatively small difference between the different viewing directions and the change with solar zenith angle can only be explained by BrO which is not concentrated in the boundary layer but rather in the free troposphere. This can be analysed in more detail using a profile inversion.
20
For the profile retrieval calculations the slant column densities of BrO and O4, the solar zenith angles and the solar azimuth angles of all 29 days were averaged. Ad-ditionally a mean measurement time was calculated as the profile retrieval needs this input. This is not critical as observation conditions do not vary strongly over 3 months at this latitude. The BREAM profile retrieval algorithm was then used to calculate a
25
mean aerosol extinction profile and a mean absorber profile for every hour using all values in this hour.
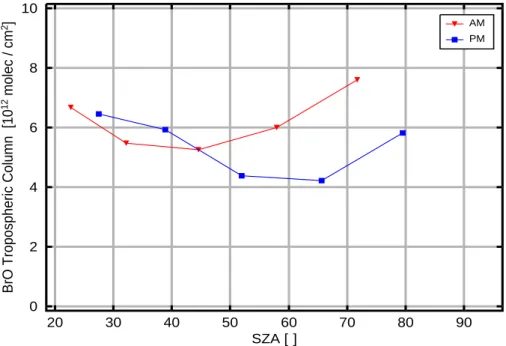
The mean tropospheric vertical column density of BrO calculated by the profile re-trieval algorithm from the slant column densities shown in Fig. 6 is presented in Fig. 7.
ACPD
7, 6527–6555, 2007 BrO measurements above Nairobi S. Fietkau et al. Title Page Abstract Introduction Conclusions References Tables Figures ◭ ◮ ◭ ◮ Back CloseFull Screen / Esc
Printer-friendly Version Interactive Discussion
EGU
The values range between 4 and 7.5×10¹² molecules/cm2. Compared to previous measurements at mid latitudes (e.g. van Roozendael et al., 2002) the values of Nairobi are small. These studies estimated values of 6–37×1012 molecules/cm2 for the tro-pospheric background of BrO based on systematic comparisons of ground-based and GOME satellite measured BrO columns. From GOME measurements above the
equa-5
torial pacific region a BrO background of 40×1012 molecules/cm2 was estimated for the free troposphere using cloudy and clear scenes (Richter et al., 2002). One pos-sible reason for the differences could be that the calculations of the profile retrieval were made up to an altitude of 6.5 km only because for higher altitudes the information content is too low. At Lauder (45◦S) in New Zealand also relatively small values of
10
tropospheric BrO have been measured (Schofield et al., 2004). Upper limits for the tro-pospheric columns of 12×1012molecules/cm2and in the mean 2×10¹²molecules/cm2 were calculated.
There are only two previous measurements of tropospheric BrO in the tropics. During a cruise of the research vessel “Polarstern” from Bremerhaven (54◦N) to Cape Town
15
(34◦S) measurements in the marine boundary layer were made with a MAX-DOAS
instrument (Leser et al., 2003). In the tropics, tropospheric BrO columns were only rarely above the detection limit. The maximum of vertical column densities of BrO for single measurements range between 2.4 to 3×10¹² molecules/cm2. With an average of 1×10¹² molecules/cm2 of the vertical column density the values are significantly
20
smaller than the values in Nairobi.
At Reunion-Island (21◦S) MAX-DOAS measurements similar to those reported here
for Nairobi were performed (Theys et al., 20071). The measured vertical column den-sities of about 10–12×1012 molecules/cm2are slightly higher than the vertical column densities of Nairobi. A possible explanation for the differences could be that at
Reunion-25
Island additional BrO is introduced in the troposphere by sea salt aerosol from breaking waves. Another factor that could contribute is the fact that Nairobi is situated in an alti-tude of about 1.6 km above sea level whereas the Reunion-Island measurements took place close to sea level. Considering the error of about 25% in the profile retrieval, the
ACPD
7, 6527–6555, 2007 BrO measurements above Nairobi S. Fietkau et al. Title Page Abstract Introduction Conclusions References Tables Figures ◭ ◮ ◭ ◮ Back CloseFull Screen / Esc
Printer-friendly Version Interactive Discussion
EGU
measurements are in an excellent agreement.
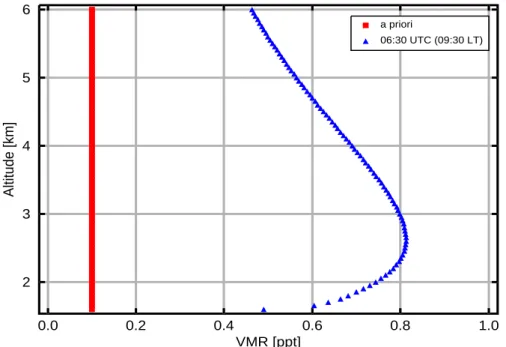
A typical retrieved vertical profile of tropospheric BrO is shown in Fig. 8. As already pointed out above, the small differences of the BrO slant column densities from the different viewing directions indicate that the bulk of the BrO is not close to the surface. This is confirmed by the result of the formal inversion that peaks between 2 and 3 km.
5
Compared with the balloon-borne measurements of atmospheric profiles of BrO in Kiruna (68◦N) (Fitzenberger et al., 2000) the shape of the profile is in good agreement.
The absolute values of the Nairobi measurements at the tropospheric maximum of about 1 ppt are about half the Kiruna summer values of 2 ppt. In contrast the winter profile of the Kiruna measurements with 0.6 ppt shows lower values.
10
The relatively small values of tropospheric BrO which are in the range of the assumed atmospheric background indicate that no large local sources of BrO are present in Nairobi and no transport of BrO for example from biomass burning areas or methyl bromide from the coffee plantations near Nairobi take place.
5 Summary
15
In this study, one year of ground-based zenith-sky measurements of BrO above Nairobi (1◦S, 36◦E) are reported. This is the first comprehensive BrO measurement at low
latitudes and provides the opportunity to test our understanding of bromine chemistry in tropical regions.
The measured stratospheric differential slant column densities (90◦–80◦ SZA) show
20
only little seasonal variation. This is related to the small seasonal variation of Bry and the lack of a seasonality of NO2 which is anti-correlated to BrO via the forma-tion of BrONO2. A clear diurnal variation of BrO can be observed, the average BrO DSCD being 1.3×10¹⁴ molecules/cm2in the morning and 1.5×10¹⁴ molecules/cm2 in the evening. This PM/AM ratio of 1.2 is slightly lower than that observed at mid-latitude
25
stations.
ACPD
7, 6527–6555, 2007 BrO measurements above Nairobi S. Fietkau et al. Title Page Abstract Introduction Conclusions References Tables Figures ◭ ◮ ◭ ◮ Back CloseFull Screen / Esc
Printer-friendly Version Interactive Discussion
EGU
chemical model combined with radiative transfer calculations shows good agreement. In the morning the values of the measurements are 20% and in the evening 15% larger than predicted by the model but the diurnal variation and the lack of seasonality are well reproduced. The use of climatological or actual meteorological fields has no significant impact on the results. However, the agreement between model and measurement can
5
be further improved to be within the combined uncertainties by including the reaction BrONO2+ O(3P) (Soller et al., 2001).This implies that this reaction plays an important role at low latitudes.
The good agreement between model and observations are in line with the results reported by Sinnhuber et al. (2002) for mid and high latitudes indicating that our current
10
knowledge of the mechanisms controlling the stratospheric BrO is also valid for the tropical region.
Using the multiple observation directions of the MAX-DOAS instrument it was possi-ble to determine the tropospheric BrO column and approximate vertical distribution for an average of 29 clear days. The tropospheric vertical column densities of 4–7.5×10¹²
15
molecules/cm2are in the range of the tropospheric BrO background and lower than es-timates based on GOME data. They are however limited to the lowest 6.5 km where the profile retrieval is most sensitive. The low columns and the lack of a surface maximum indicate that no large local sources of BrO are present in Nairobi and surroundings. The measurements reported here provide further support for the notion of a tropospheric
20
BrO background concentration between 0.5 and 1 ppt of still unknown origin.
Acknowledgements. This project has been funded in parts by the German Federal Ministry
of Education and Research (BMBF) via Project 50EE0005, the German Aerospace Agency (DLR), the German Research Council (DFG) and the State and University of Bremen. We would like to thank the UNEP (United Nations Environmental Project) staff for their great assistance
25
and support without which the establishment of the station and the routine measurements would not have been possible. We thank M. Chipperfield for SLIMCAT data and the ECMWF for providing meteorological and climatological data.
ACPD
7, 6527–6555, 2007 BrO measurements above Nairobi S. Fietkau et al. Title Page Abstract Introduction Conclusions References Tables Figures ◭ ◮ ◭ ◮ Back CloseFull Screen / Esc
Printer-friendly Version Interactive Discussion
EGU References
Arpag, K. H., Johnston, P. V., Miller, H. L., Sander, R. W., and Solomon, S.: Observations of stratospheric BrO column over Colorado, 40 N, J. Geophys. Res., 99, 8175–8181, 1994. Abbatt, J. P. D.: Heterogenous reaction of HOBr with HBr and HCl on ice surfaces at 228 K,
Geophys. Res. Lett., 21, 665–668, 1994.
5
Avallone, L. M, Toohey, D. W., Schauffler, S. M., Pollock, W. H., Heidt, L. E., Atlas, E. L., and Chan, K. R.: In situ measurements of BrO during AASE II, Geophys. Res. Lett., 22, 831–834, 1995.
Bobrowski, N., G. H ¨onninger, B. Galle, and U. Platt, Detection of bromine monoxide from a volcanic plume, Nature, 423, 273–276., 2003.
10
Brune, W. H., Toohey, D. W., Anderson, J. G., Starr, W. L., Vedder, J. F., and Danielsen, E. F.: In situ northern mid-latitude observations of ClO, O3 and BrO in the wintertime lower stratosphere, Science, 242, 558–562, 1988.
Brune, W. H Anderson, J. G., and Chan, K. R.: In situ observations of BrO over Antarctica: ER-2 aircraft results from 54◦S to 72◦S latitude, J. Geophys. Res., 94, 16 639–16 647, 1989.
15
Chipperfield, M. P.: Multiannual simulations with a three-dimensional chemical transport model, J. Geophys. Res., 104, 1781–1805, 1999.
DeMore, W. B., Sander, S. P., Golden, D. M., Hampson, R. F., Kuryolo, M. J., Howard, C. J., Ravishankara, A. R., Kolb, C. E., and Molina, M. J.: Chemical kinetics and photochemical data for use in stratospheric modelling, JPL Publ. 97-4, Jet Propul. Lab, Pasadena, Calif.,
20
1997.
Fish, D. J., Jones, R. L., and Strong, E. K.: Mid-latitude observations of the diurnal variation of stratospheric BrO, J. Geophys. Res., 100, 18 863–18 871, 1995.
Fitzenberger, R., B ¨osch, H., Camy-Peyret, C., Chipperfield, M. P., Harder, H., Platt, U., Sinnhu-ber, B.-M., Wagner, T., and Pfeilsticker, K.: First profile measurements of tropospheric BrO,
25
Geophys. Res. Lett., 27, 2921–2924, 2000.
Frieß, U., Monks, P. S., Remedios, J. J., Rozanov, A., Sinreich, R., Wagner, T., and Platt, U.: MAX-DOAS O4 measurements: A new technique to derive information on atmospheric aerosols: 2. Modeling studies, J. Geophys. Res., 111, D14203, doi:10.1029/2005JD006618, 2006.
30
Gabriel, R., von Glasow, R., Sander, R., Andrae, M. O., and Crutzen, P. J.: Bromide content of sea-salt aerosol particles collected over the Indian Ocean during INDOEX 1999, J. Geophys.
ACPD
7, 6527–6555, 2007 BrO measurements above Nairobi S. Fietkau et al. Title Page Abstract Introduction Conclusions References Tables Figures ◭ ◮ ◭ ◮ Back CloseFull Screen / Esc
Printer-friendly Version Interactive Discussion
EGU
Res., 107(D19), 8032, doi:10.1029/2001JD001133, 2002.
Harder, H., B ¨osch, H., Camy-Peyret, C., Chipperfield, M. P., Fitzenberger, R., Payan, S., Perner, D., Platt, U., Sinnhuber, B.-M., and Pfeilsticker, K.: Comparison of measured and modelled stratospheric BrO: Implications for the total amount of stratospheric bromine, Geophys. Res. Lett., 27, 3695–3698, 2000.
5
Hausmann, M. and Platt, U.: Spectroscopic measurement of bromine oxide and ozone in the high Arctic during Polar Sunrise Experiment 1992, J.Geophys. Res., 99, 25 399–25 413, 1994.
Hendrick, M., Van Roozendael, A. Kylling, A. Petritoli, A. Rozanov, S. Sanghavi, R. Schofield, C. von Friedeburg, T. Wagner, F. Wittrock, D. Fonteyn, and M. De Mazi `ere: Intercomparison
10
exercise between different radiative transfer models used for the interpretation of ground-based zenith-sky and multi-axis DOAS observations, Atmos. Chem. Phys., 6, 93–108, 2006,
http://www.atmos-chem-phys.net/6/93/2006/.
Kaleschke L., Richter, A., Burrows, J. P., Afe, O., Heygster, G., Notholt, J., Rankin, A. M., Roscoe, H. K., Hollwedel, J., Wagner, T., and Jacobi, H.-W.: Frost flowers on sea ice as
15
a source of sea salt and their influence on tropospheric halogen chemistry, Geophys. Res. Lett., 31, L16114, doi:10.1029/2004GL020655, 2004.
Leser, H., H ¨onninger, G., and Platt, U.: MAX DOAS measurements of BrO and NO2in the ma-rine boundary layer, Geophys. Res. Lett., 30(10), 1537, doi:10.1029/2002GL015811, 2003. McKinney, K. A., Pierson, J. M., and Toohey, D. W.: A wintertime in situ profile of BrO between
20
17 and 27 km in the Arctic vortex, Geophys. Res. Lett., 24, 853–856, 1997.
Montzka, S. A., Butler, J. H., Hall, B. D., Mondeel, D. J., and Elkins, J. W.: A decline in tro-pospheric organic bromine, Geophys. Res. Lett., 30(15), 1826, doi:10.1029/2003GL017745, 2003.
Pfeilsticker, K., Sturges, W. T., B ¨osch, H., Camy-Peyret, C., Chipperfield, M. P., Engel, A.,
25
Fitzenberger, R., M ¨uller, M., and Sinnhuber, B.-M.: Lower stratospheric organic and inor-ganic bromine budget for the arctic winter 1998/99, Geophs. Res. Lett., 27, 3305–3308, 2000.
Platt, U.: Differential optical absorption spectroscopy (DOAS), in Air monitoring by Spectro-scopic Techniques, Chem. Anal. Ser., 127, edited by M.W. Sigrist, 27–84, John Wiley, New
30
York, 1994.
Pundt, I., van Roozendael, M., Wagner, T., Richter, A., Chipperfield, M. P., Burrows, J. P., Fayt, C., Hendrick, F., Pfeilsticker, K., Platt, U., and Pommereau, J.-P.: Simultaneous UV – vis
ACPD
7, 6527–6555, 2007 BrO measurements above Nairobi S. Fietkau et al. Title Page Abstract Introduction Conclusions References Tables Figures ◭ ◮ ◭ ◮ Back CloseFull Screen / Esc
Printer-friendly Version Interactive Discussion
EGU
measurements of BrO from balloon, satellite and ground: Implications for tropospheric BrO, in Proceedings of the Fifth European Symposium on Stratospheric Ozone, Eur. Comm. Air Pollut. Res. Rep. 73, 316–319, 1999a.
Pundt, I., Pommereau, J.-P., Chipperfield, M. P., Van Roozendael, M., and Goutail, F.: Climatol-ogy of the stratospheric BrO vertical distribution by balloon-borne UV–visible spectrometry,
5
J. Geophys. Res., 107, 4806, doi:10.1029/2002JD002230, 2002.
Richter, A., Wittrock, F., Eisinger, M., and Burrows, J. P.: GOME observations of tropospheric BrO in Nothern Hemispheric Spring and Summer 1997, Geophys. Res. Lett, 25, 2683–2688, 1998.
Richter, A., Eisinger, M., Ladst ¨atter-Weißenmayer, A., and Burrows, J. P.: DOAS zenith sky
10
observations: 2. Seasonal Variation of BrO over Bremen (53 ˚ N) 1994-1995, J. Atmosph. Chem., 32, 83–99, 1999.
Richter, A., Wittrock, F., Ladst ¨atter-Weißenmayer, A., and Burrows, J. P.: GOME measurements of stratospheric and tropospheric BrO, Adv. Space Res, 29, 1667–1672, 2002.
Rodgers, C. D.: Retrieval of atmospheric temperature and composition from remote
measure-15
ments of thermal radiation, Reviews of Geophysics and Space Physics, 14(4), 609–624, 1976.
Rodgers, C. D.: Characterization and error analysis of profiles retrieved from remote sounding measurements, J. Geophys. Res., 95(D5), 5587–5595, 1990.
Rozanov, A., Rozanov, V., and Burrows, J. P.: A numerical radiative transfer model for a
spher-20
ical planetary atmosphere: Combined differential-integral approach involving the Piccard it-erative approximation, J. Quant. Spectrosc. Radiat. Transfer, 69, 491–512, 2001.
Sander, S. P., Friedl, R. R., Golden, D. M., Kurylo, M. J., Huie, R. E., Orkin, V. L., Moortgat, G. K., Ravishankara, A. R., Kolb, C. E., Molina, M. J., and Finlayson-Pitts, B. J.: Chemical Kinetics and Photochemical Data for Use in Atmospheric Studies, NASA, JPL Publication,
25
14, 02–25, 2003.
Schofield, R., Kreher, K., Connor, B. J., Johnston, P. V., Thomas, A., Shooter, D., Chip-perfield, M. P., Rodgers, C. D., and Mount, G. H.: Retrieved tropospheric and strato-spheric BrO columns over Lauder, New Zealand, J. Geophys. Res., 109, D143404, doi:10.1029/2003JD004463,2004.
30
Sinnhuber, B.-M., Arlander, D. W., Bovensmann, H., Burrows, J. P., Chipperfield, M. P., Enell, C.-F., Frieß, U., Hendrick, F., Johnston, P. V., Jones, R. L., Kreher, K., Mohamed-Tahrin, N., M ¨uller, R., Pfeilsticker, K., Platt, U., Pommereau, J.-P., Pundt, I., Richter, A., South,
ACPD
7, 6527–6555, 2007 BrO measurements above Nairobi S. Fietkau et al. Title Page Abstract Introduction Conclusions References Tables Figures ◭ ◮ ◭ ◮ Back CloseFull Screen / Esc
Printer-friendly Version Interactive Discussion
EGU
A. M., Toernkvist, K. K., Van Roozendael, M., Wagner, T., and Wittrock, F.: Comparison of measurements and model calculations of stratospheric bromine monoxide, J. Geophys. Res., 107, 4398, doi:10.1029/2001JD000940, 2002.
Sinnhuber M., Burrows, J. P., Chipperfield, M. P., Jackman, C. H., Kallenrode, M.-B., K ¨unzi, K. F., and Quack, M.: A model study of the impact of magnetic field structure on
at-5
mospheric composition during solar proton events, Geophys. Res. Lett, 30(15), 1818, doi:10.1029/2003GL017265, 2003.
Soller, R., Nicovich, J. M., and Wine, P. H.: Temperature-Dependent Rate Coefficients for the Reactions of Br(2P3/2), Cl(2P3/2) and O(3PJ) with BrONO2, J. Phys. Chem. A, 105, 1416– 1422, 2001.
10
Solomon, S., Schmeltekopf, A. L., and Sanders, R. W.: On the interpretation of zenith sky absorption-measurements, J. Geophys. Res., 92, 8311–8319, 1987.
Stutz, J., Ackermann, R., Fast, J. D., and Barrie, L.: Atmospheric Reactive Chlo-rine and bromine at the Great Salt Lake, Utah, Geophys. Res. Lett., 29, 1380, doi:10.1029/2002GL014812, 2002.
15
Toohey, D. W., Anderson, J. G., Brune, W. H., and Chan, K. R.: In situ measurements of BrO in the Arctic stratosphere, Geophys. Res. Lett., 17, 513–516, 1990.
Van Roozendael, M., Wagner, T., Richter, A., Pundt, I., Arlander, D. W., Burrows, J. P., Chip-perfield, M., Fayt, C., Johnston, P. V., Lambert, J.-C., Kreher, K., Pfeilsticker, K., Platt, U., Pommereau, J.-P., Sinnhuber, B.-M., Tørnkvist, K. K., and Wittrock, F.: Intercomparison of
20
BrO measurements from ERS-2 GOME, ground-based and balloon platforms, Adv. Space Res., 29, 1661–1666, 2002.
von Glasow R., von Kuhlmann, R., Lawrence, M. G., Platt, U., and Crutzen, P. J.: Impact of reactive bromine chemistry in the troposphere, Atmos. Chem. Phys. Discuss., 4, 4877– 4913, 2004,
25
http://www.atmos-chem-phys-discuss.net/4/4877/2004/.
Vountas, M., Rozanov, V. V., and Burrows, J. P.: Impact of Raman scattering on radiative transfer in earth’s atmosphere, J. Quant. Spectrosc. Radiat. Transfer, 60, 943–961, 1998. Wagner, T., and Platt, U.: Satellite mapping of enhanced BrO concentrations in the troposphere,
Nature, 395, 486–490, 1998.
30
Wagner, T., Leue, C., Wenig, M., Pfeilsticker, K., and Platt, U.: Spatial and temporal distribution of enhanced boundary layer BrO concentrations measured by the GOME instrument aboard ERS-2, J. Geophys. Res., 106, 24 225–24 235, 2001.
ACPD
7, 6527–6555, 2007 BrO measurements above Nairobi S. Fietkau et al. Title Page Abstract Introduction Conclusions References Tables Figures ◭ ◮ ◭ ◮ Back CloseFull Screen / Esc
Printer-friendly Version Interactive Discussion
EGU
Wagner, T., Dix, B., von Friedeburg, C., Frieß, U., Sanghavi, S., Sinreich, R., and Platt, U.: MAX-DOAS O4 measurements: A new technique to derive information on atmo-spheric aerosols – Principles and information content, J.Geophys. Res., 109, D22205, doi:10.1029/2004JD004904, 2004.
Wittrock, F., Oetjen, H., Richter, A., Fietkau, S., Medeke, T., Rozanov, A., and Burrows, J. P.:
5
MAX-DOAS measurements of atmospheric trace gases in Ny- ˚Alesund – Radiative transfer studies and their application, Atmos. Chem. Phys., 4, 995–966, 2004,
http://www.atmos-chem-phys.net/4/995/2004/.
Wittrock, F.: The retrieval of oxygenated volatile organic compounds by remote sensing tech-niques, PhD thesis,http://nbn-resolving.de/urn:nbn:de:gbv:46-diss000104818, University of
10
Bremen, 2006.
WMO(World Meteorological Organization): Scientific Assessment of Ozone Depletion: 2006, Global Ozone Research and Monitoring Project-Report No. 50, Geneva, 2006.
ACPD
7, 6527–6555, 2007 BrO measurements above Nairobi S. Fietkau et al. Title Page Abstract Introduction Conclusions References Tables Figures ◭ ◮ ◭ ◮ Back CloseFull Screen / Esc
Printer-friendly Version Interactive Discussion EGU 0 0.5 1.0 1.5 2.0 2.5 3.0 2003
Jan Feb Mar Apr May Jun Jul Aug Sep Oct Nov Dec
MEAS AM MEAS PM
BrO DSCD 90˚-80˚ [10
14 molec/cm 2]
Fig. 1.Observations of stratospheric BrO above Nairobi for the year 2003. Shown are morning and evening differential slant column densities between solar zenith angles of 90◦and 80◦.
ACPD
7, 6527–6555, 2007 BrO measurements above Nairobi S. Fietkau et al. Title Page Abstract Introduction Conclusions References Tables Figures ◭ ◮ ◭ ◮ Back CloseFull Screen / Esc
Printer-friendly Version Interactive Discussion EGU -1.0 -0.5 0 0.5 1.0 2003
Jan Feb Mar Apr May Jun Jul Aug Sep Oct Nov Dec
BrO AM-PM Difference [10
14 molec/cm 2]
ACPD
7, 6527–6555, 2007 BrO measurements above Nairobi S. Fietkau et al. Title Page Abstract Introduction Conclusions References Tables Figures ◭ ◮ ◭ ◮ Back CloseFull Screen / Esc
Printer-friendly Version Interactive Discussion EGU 0 1 2 3 4 2003
Jan Feb Mar Apr May Jun Jul Aug Sep Oct Nov Dec
MEAS AM MEAS PM
NO
2
Vertical Column Density [10
15 molec/cm 2]
Fig. 3. NO2 vertical column densities above Nairobi observed at solar zenith angles around 90◦. Morning and afternoon values are given. The scatter in the second half of the year is the result of local pollution affecting the measurements in the presence of clouds.
ACPD
7, 6527–6555, 2007 BrO measurements above Nairobi S. Fietkau et al. Title Page Abstract Introduction Conclusions References Tables Figures ◭ ◮ ◭ ◮ Back CloseFull Screen / Esc
Printer-friendly Version Interactive Discussion EGU 0 0.5 1.0 1.5 2.0 2.5 70 75 80 85 90 MODEL clima AM MODEL clima PM MODEL ECMWF AM MODEL ECMWF PM MODEL ECMWF + react AM MODEL ECMWF + react PM
SZA [˚]
BrO Slant Column Density [10
14
molec/cm
2]
Fig. 4.Modelled BrO slant column densities for Nairobi, 15 August 2003. Two runs with different
meteorological input data were made, one using climatological and the other ECMWF data for the year 2003. A third run using the ECMWF data includes the reaction BrONO2+ O(
3 P) → BrO + NO3.
ACPD
7, 6527–6555, 2007 BrO measurements above Nairobi S. Fietkau et al. Title Page Abstract Introduction Conclusions References Tables Figures ◭ ◮ ◭ ◮ Back CloseFull Screen / Esc
Printer-friendly Version Interactive Discussion EGU 0 0.5 1.0 1.5 2.0 2.5 3.0 2003
Jan Feb Mar Apr May Jun Jul Aug Sep Oct Nov Dec
MEAS AM MEAS PM MODEL clima AM MODEL clima PM MODEL ECMWF AM MODEL ECMWF PM MODEL ECMWF + react AM MODEL ECMWF + react PM
BrO DSCD 90˚-80˚ [10
14 molec/cm 2]
Fig. 5. Comparison of observed and modelled BrO differential slant column densities for the year 2003. For the observations the monthly mean is presented.
ACPD
7, 6527–6555, 2007 BrO measurements above Nairobi S. Fietkau et al. Title Page Abstract Introduction Conclusions References Tables Figures ◭ ◮ ◭ ◮ Back CloseFull Screen / Esc
Printer-friendly Version Interactive Discussion EGU 0 0.5 1.0 1.5 2.0 2.5 40 50 60 70 80 90 Zenith Off Axis 4˚ Off Axis 7˚ Off Axis 16˚ Off Axis 30˚ SZA[˚]
Slant Column Density [10
14 molec/cm 2]
Fig. 6.Mean BrO slant column densities. For the calculation of the average all days with good weather conditions, altogether 29 days, in the period January to March 2003 were used. In addition the slant columns are averaged over intervals of 2.5◦ solar zenith angle. All off-axis viewing directions yield larger BrO columns than the zenith-sky measurement but the relative order changes with solar zenith-angle.
ACPD
7, 6527–6555, 2007 BrO measurements above Nairobi S. Fietkau et al. Title Page Abstract Introduction Conclusions References Tables Figures ◭ ◮ ◭ ◮ Back CloseFull Screen / Esc
Printer-friendly Version Interactive Discussion EGU 0 2 4 6 8 10 20 30 40 50 60 70 80 90 AM PM SZA [˚]
BrO Tropospheric Column [10
12 molec / cm 2]
Fig. 7. Mean tropospheric vertical column of BrO above Nairobi (averaging period January– March 2003). Compared with mid latitude stations the values are small and in the range of the tropospheric BrO background.
ACPD
7, 6527–6555, 2007 BrO measurements above Nairobi S. Fietkau et al. Title Page Abstract Introduction Conclusions References Tables Figures ◭ ◮ ◭ ◮ Back CloseFull Screen / Esc
Printer-friendly Version Interactive Discussion EGU 2 3 4 5 6 0.0 0.2 0.4 0.6 0.8 1.0 a priori 06:30 UTC (09:30 LT) VMR [ppt] Altitude [km]
Fig. 8.Mean tropospheric BrO profile at Nairobi. The profile maximum is situated in an altitude of about 2.5 to 3 km (1 to 1.5 km above station ground). Also shown is the a priori used in the profile retrieval. While the profiles are shown in 50 m layers, the information content of the retrieved profile is about 1.5 independent pieces of information.